Statistical Analysis of Haverland Electric Heater Market Case Study
VerifiedAdded on 2020/05/28
|8
|1776
|196
Case Study
AI Summary
This case study delves into the electric heating market in France, focusing on the company Haverland. It begins with a SWOT analysis, highlighting Haverland's strengths, weaknesses, opportunities, and threats within the market. The study then profiles Haverland's customer base, examining various heating system preferences and consumer behaviors. A detailed statistical analysis is conducted, including a multiplicative decomposition method to analyze monthly sales data and determine seasonal trends. The assignment also includes a linear regression analysis to forecast future sales and provides insights into market trends. The findings indicate potential growth in the electric heater market and offer recommendations for Haverland's business strategy, focusing on customer loyalty and effective communication channels.

Running head: CASE STDY STATISTICS
Case Study Statistics
Name of the Student:
Name of the University:
Author’s note:
Case Study Statistics
Name of the Student:
Name of the University:
Author’s note:
Paraphrase This Document
Need a fresh take? Get an instant paraphrase of this document with our AI Paraphraser
1CASE STDY STATISTICS
Table of Contents
Answer No. 1:...........................................................................................................................................................................................................2
Answer No. 2:...........................................................................................................................................................................................................2
Answer No. 3:...........................................................................................................................................................................................................2
Answer No. 4:...........................................................................................................................................................................................................3
Answer No. 5:...........................................................................................................................................................................................................5
Annotated Bibliography:..............................................................................................................................................................................................7
2CASE STDY STATISTICS
Question and Answers of Case Study
Answer No. 1:
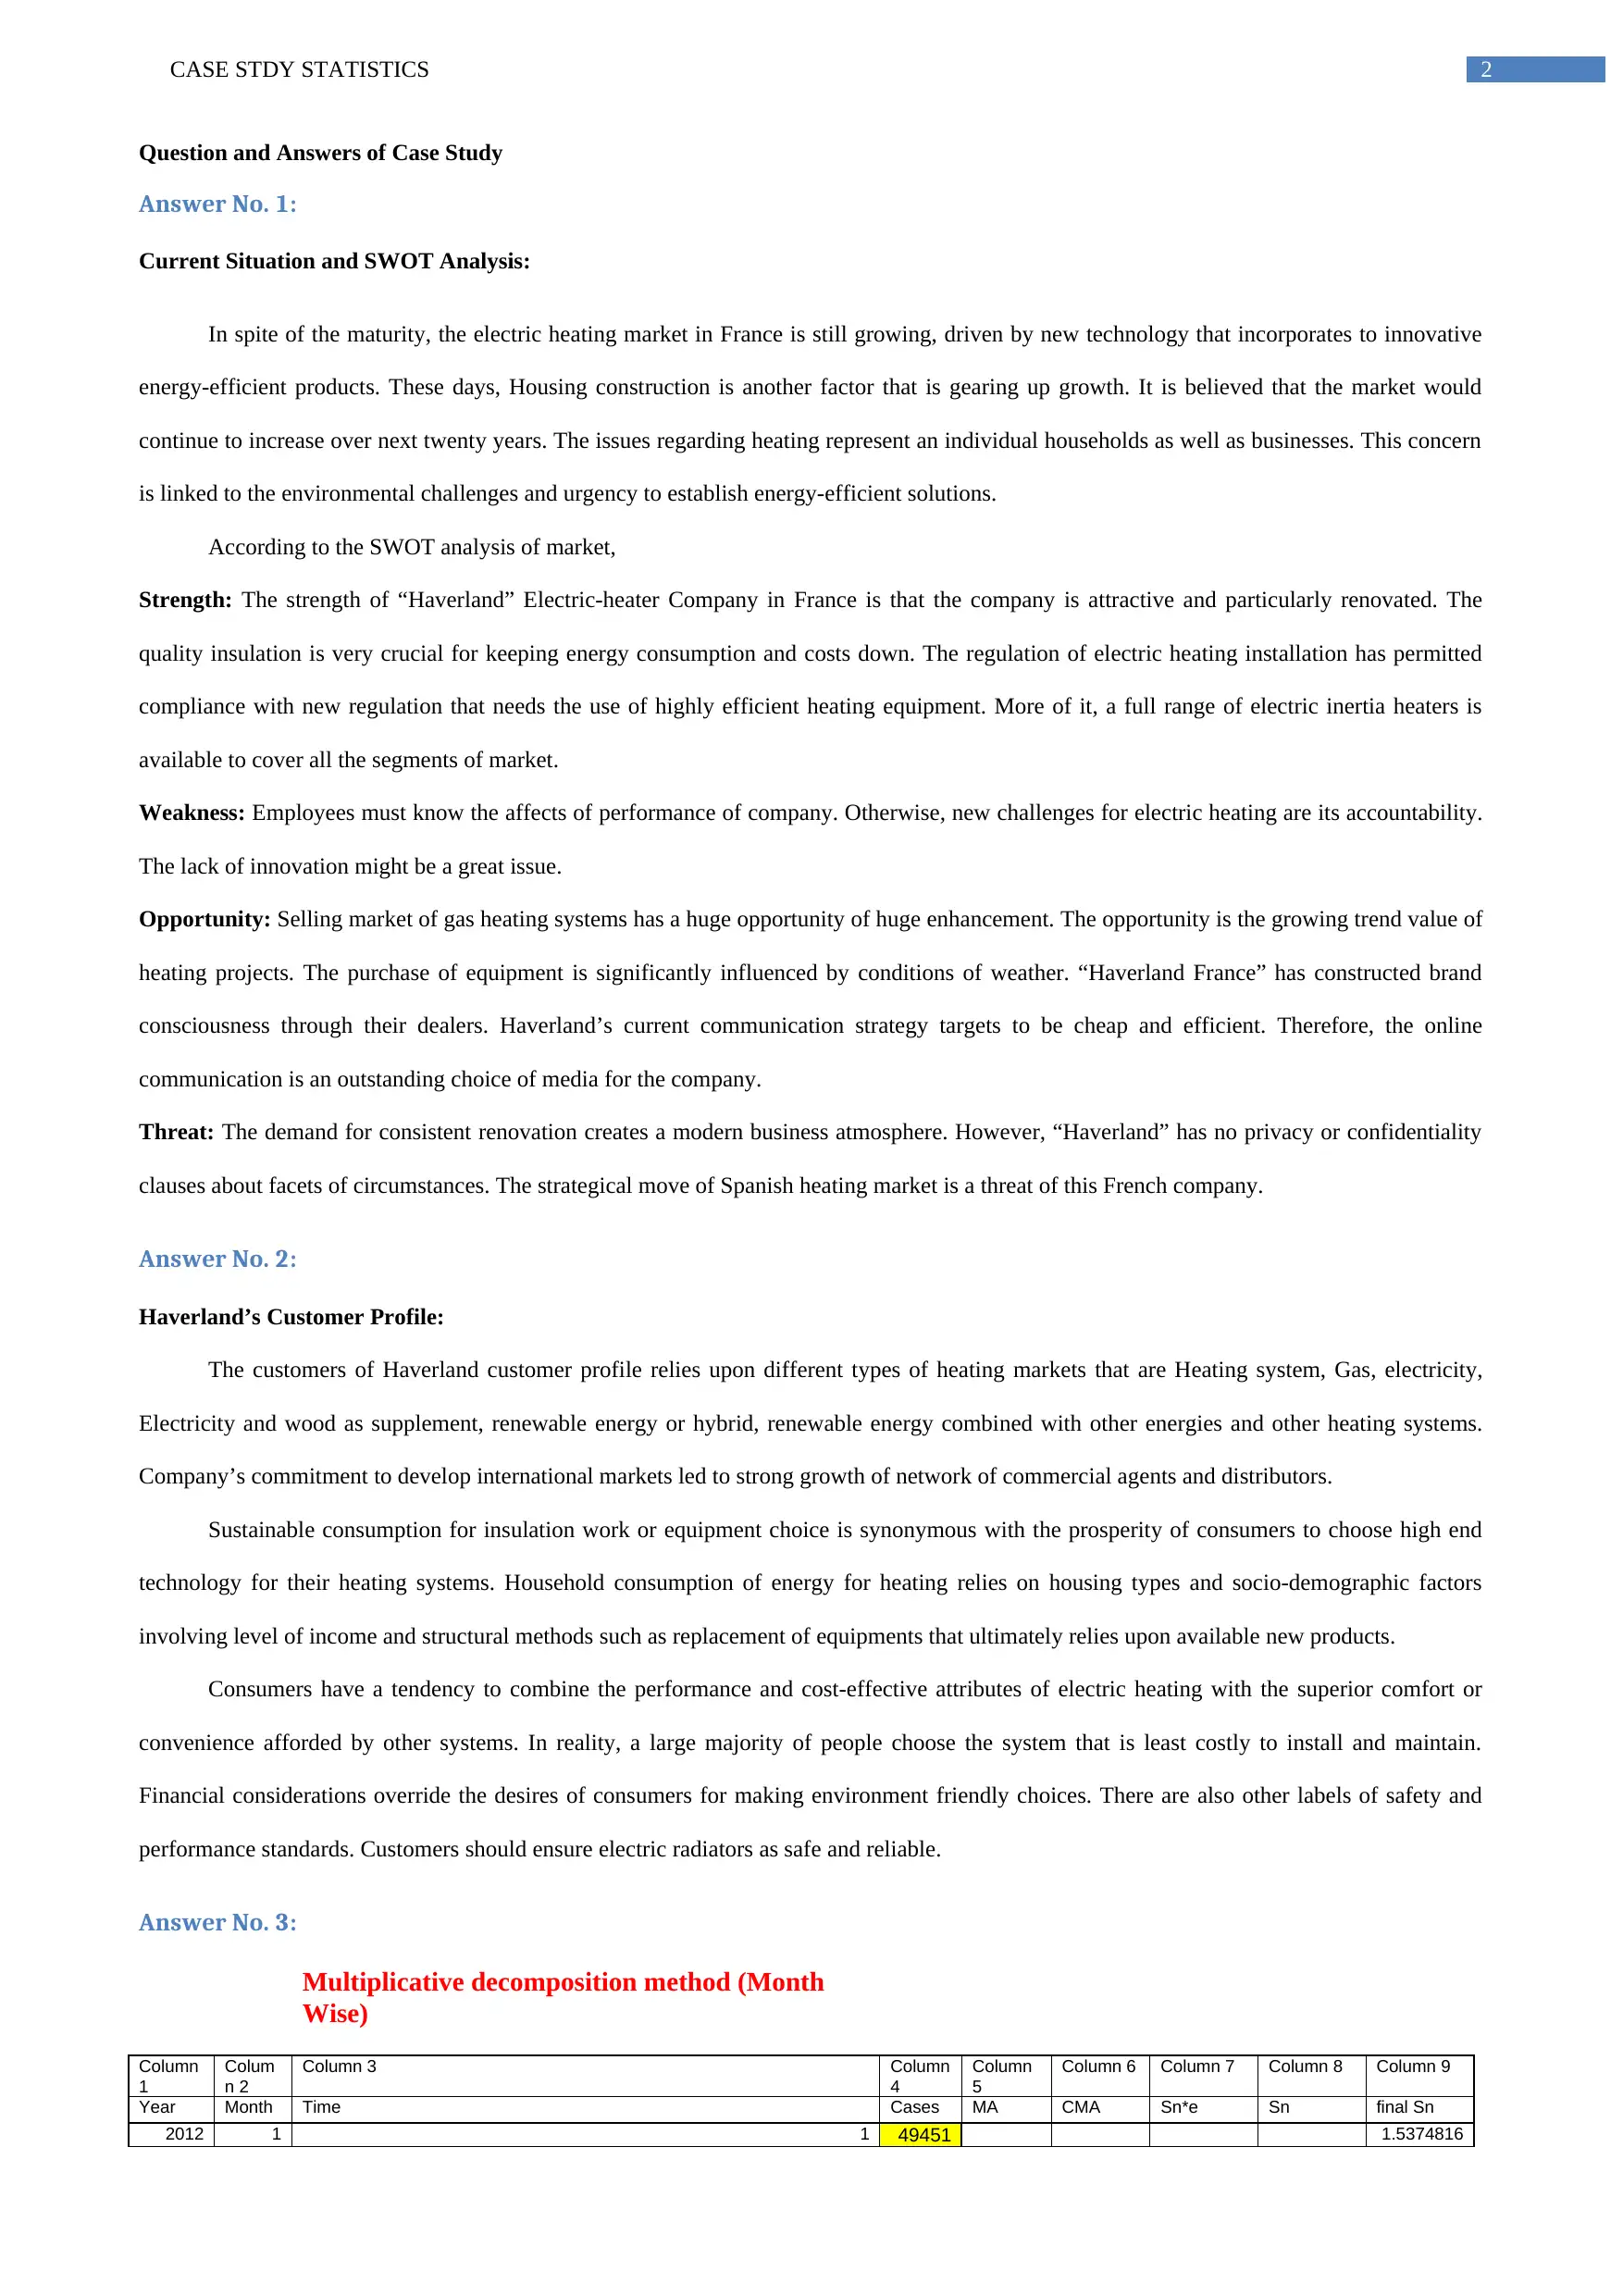
Current Situation and SWOT Analysis:
In spite of the maturity, the electric heating market in France is still growing, driven by new technology that incorporates to innovative
energy-efficient products. These days, Housing construction is another factor that is gearing up growth. It is believed that the market would
continue to increase over next twenty years. The issues regarding heating represent an individual households as well as businesses. This concern
is linked to the environmental challenges and urgency to establish energy-efficient solutions.
According to the SWOT analysis of market,
Strength: The strength of “Haverland” Electric-heater Company in France is that the company is attractive and particularly renovated. The
quality insulation is very crucial for keeping energy consumption and costs down. The regulation of electric heating installation has permitted
compliance with new regulation that needs the use of highly efficient heating equipment. More of it, a full range of electric inertia heaters is
available to cover all the segments of market.
Weakness: Employees must know the affects of performance of company. Otherwise, new challenges for electric heating are its accountability.
The lack of innovation might be a great issue.
Opportunity: Selling market of gas heating systems has a huge opportunity of huge enhancement. The opportunity is the growing trend value of
heating projects. The purchase of equipment is significantly influenced by conditions of weather. “Haverland France” has constructed brand
consciousness through their dealers. Haverland’s current communication strategy targets to be cheap and efficient. Therefore, the online
communication is an outstanding choice of media for the company.
Threat: The demand for consistent renovation creates a modern business atmosphere. However, “Haverland” has no privacy or confidentiality
clauses about facets of circumstances. The strategical move of Spanish heating market is a threat of this French company.
Answer No. 2:
Haverland’s Customer Profile:
The customers of Haverland customer profile relies upon different types of heating markets that are Heating system, Gas, electricity,
Electricity and wood as supplement, renewable energy or hybrid, renewable energy combined with other energies and other heating systems.
Company’s commitment to develop international markets led to strong growth of network of commercial agents and distributors.
Sustainable consumption for insulation work or equipment choice is synonymous with the prosperity of consumers to choose high end
technology for their heating systems. Household consumption of energy for heating relies on housing types and socio-demographic factors
involving level of income and structural methods such as replacement of equipments that ultimately relies upon available new products.
Consumers have a tendency to combine the performance and cost-effective attributes of electric heating with the superior comfort or
convenience afforded by other systems. In reality, a large majority of people choose the system that is least costly to install and maintain.
Financial considerations override the desires of consumers for making environment friendly choices. There are also other labels of safety and
performance standards. Customers should ensure electric radiators as safe and reliable.
Answer No. 3:
Multiplicative decomposition method (Month
Wise)
Column
1
Colum
n 2
Column 3 Column
4
Column
5
Column 6 Column 7 Column 8 Column 9
Year Month Time Cases MA CMA Sn*e Sn final Sn
2012 1 1 49451 1.5374816
Question and Answers of Case Study
Answer No. 1:
Current Situation and SWOT Analysis:
In spite of the maturity, the electric heating market in France is still growing, driven by new technology that incorporates to innovative
energy-efficient products. These days, Housing construction is another factor that is gearing up growth. It is believed that the market would
continue to increase over next twenty years. The issues regarding heating represent an individual households as well as businesses. This concern
is linked to the environmental challenges and urgency to establish energy-efficient solutions.
According to the SWOT analysis of market,
Strength: The strength of “Haverland” Electric-heater Company in France is that the company is attractive and particularly renovated. The
quality insulation is very crucial for keeping energy consumption and costs down. The regulation of electric heating installation has permitted
compliance with new regulation that needs the use of highly efficient heating equipment. More of it, a full range of electric inertia heaters is
available to cover all the segments of market.
Weakness: Employees must know the affects of performance of company. Otherwise, new challenges for electric heating are its accountability.
The lack of innovation might be a great issue.
Opportunity: Selling market of gas heating systems has a huge opportunity of huge enhancement. The opportunity is the growing trend value of
heating projects. The purchase of equipment is significantly influenced by conditions of weather. “Haverland France” has constructed brand
consciousness through their dealers. Haverland’s current communication strategy targets to be cheap and efficient. Therefore, the online
communication is an outstanding choice of media for the company.
Threat: The demand for consistent renovation creates a modern business atmosphere. However, “Haverland” has no privacy or confidentiality
clauses about facets of circumstances. The strategical move of Spanish heating market is a threat of this French company.
Answer No. 2:
Haverland’s Customer Profile:
The customers of Haverland customer profile relies upon different types of heating markets that are Heating system, Gas, electricity,
Electricity and wood as supplement, renewable energy or hybrid, renewable energy combined with other energies and other heating systems.
Company’s commitment to develop international markets led to strong growth of network of commercial agents and distributors.
Sustainable consumption for insulation work or equipment choice is synonymous with the prosperity of consumers to choose high end
technology for their heating systems. Household consumption of energy for heating relies on housing types and socio-demographic factors
involving level of income and structural methods such as replacement of equipments that ultimately relies upon available new products.
Consumers have a tendency to combine the performance and cost-effective attributes of electric heating with the superior comfort or
convenience afforded by other systems. In reality, a large majority of people choose the system that is least costly to install and maintain.
Financial considerations override the desires of consumers for making environment friendly choices. There are also other labels of safety and
performance standards. Customers should ensure electric radiators as safe and reliable.
Answer No. 3:
Multiplicative decomposition method (Month
Wise)
Column
1
Colum
n 2
Column 3 Column
4
Column
5
Column 6 Column 7 Column 8 Column 9
Year Month Time Cases MA CMA Sn*e Sn final Sn
2012 1 1 49451 1.5374816
⊘ This is a preview!⊘
Do you want full access?
Subscribe today to unlock all pages.
Trusted by 1+ million students worldwide
3CASE STDY STATISTICS
6
2 2
60045
2.2635498
9
3 3
10584
35493.7
5
31772.87
5
0.3331143
3
0.4645596
5
0.7329619
4 4
21895
28052 25696.62
5
0.8520574
2
0.8750541
2
1.3806221
1
5 5
19684
23341.2
5
27426.5 0.7177000
3
0.7634629
7
1.2045584
8
6 6
41202
31511.7
5
36291.12
5
1.1353189 1.2001841
7
1.8935980
9
7 7
43266
41070.5 50158.87
5
0.8625791
5
0.8321703
1
1.3129619
1
8 8
60130
59247.2
5
65362.5 0.9199464
5
0.8515812
6
1.3435876
6
9 9
92391
71477.7
5
78616 1.1752187
8
1.2376060
9
1.9526407
7
10 10
90124
85754.2
5
90492.37
5
0.9959292
2
1.0109541
4
1.5950392
2
11 11 10037
2
95230.5 95136.5 1.0550314
5
1.0550314
5
1.6645824
9
12 12
98035
95042.5 98255 0.9977609
3
0.9977609
3
1.5742235
5
2013 1 13
91639
101467.
5
94039.5 0.9744734
9
0.9744734
9
1.5374816
6
2 14 11582
4
86611.5 80732.5 1.4346638
6 1.4346638
6
2.2635498
9
3 15
40948
74853.5 68704.12
5
0.5960049
7
0.4645596
5 0.7329619
4 16
51003
62554.7
5
56793 0.8980508
2
0.8750541
2
1.3806221
1
5 17
42444
51031.2
5
52450.12
5
0.8092259
1
0.7634629
7
1.2045584
8
6 18
69730
53869 55120.37
5
1.2650494
5
1.2001841
7
1.8935980
9
7 19
52299
56371.7
5
65230.12
5
0.8017614
6
0.8321703
1
1.3129619
1
8 20
61014
74088.5 77901.87
5
0.7832160
7
0.8515812
6
1.3435876
6
9 21 11331
1
81715.2
5
87162.75 1.2999934 1.2376060
9
1.9526407
7
10 22 10023
7
92610.2
5
97698.87
5
1.0259790
6 1.0109541
4
1.5950392
2
11 23
95879
102787.
5
1.6645824
9
12 24 10172
3
1.5742235
5
Averag
e
18.933075
2
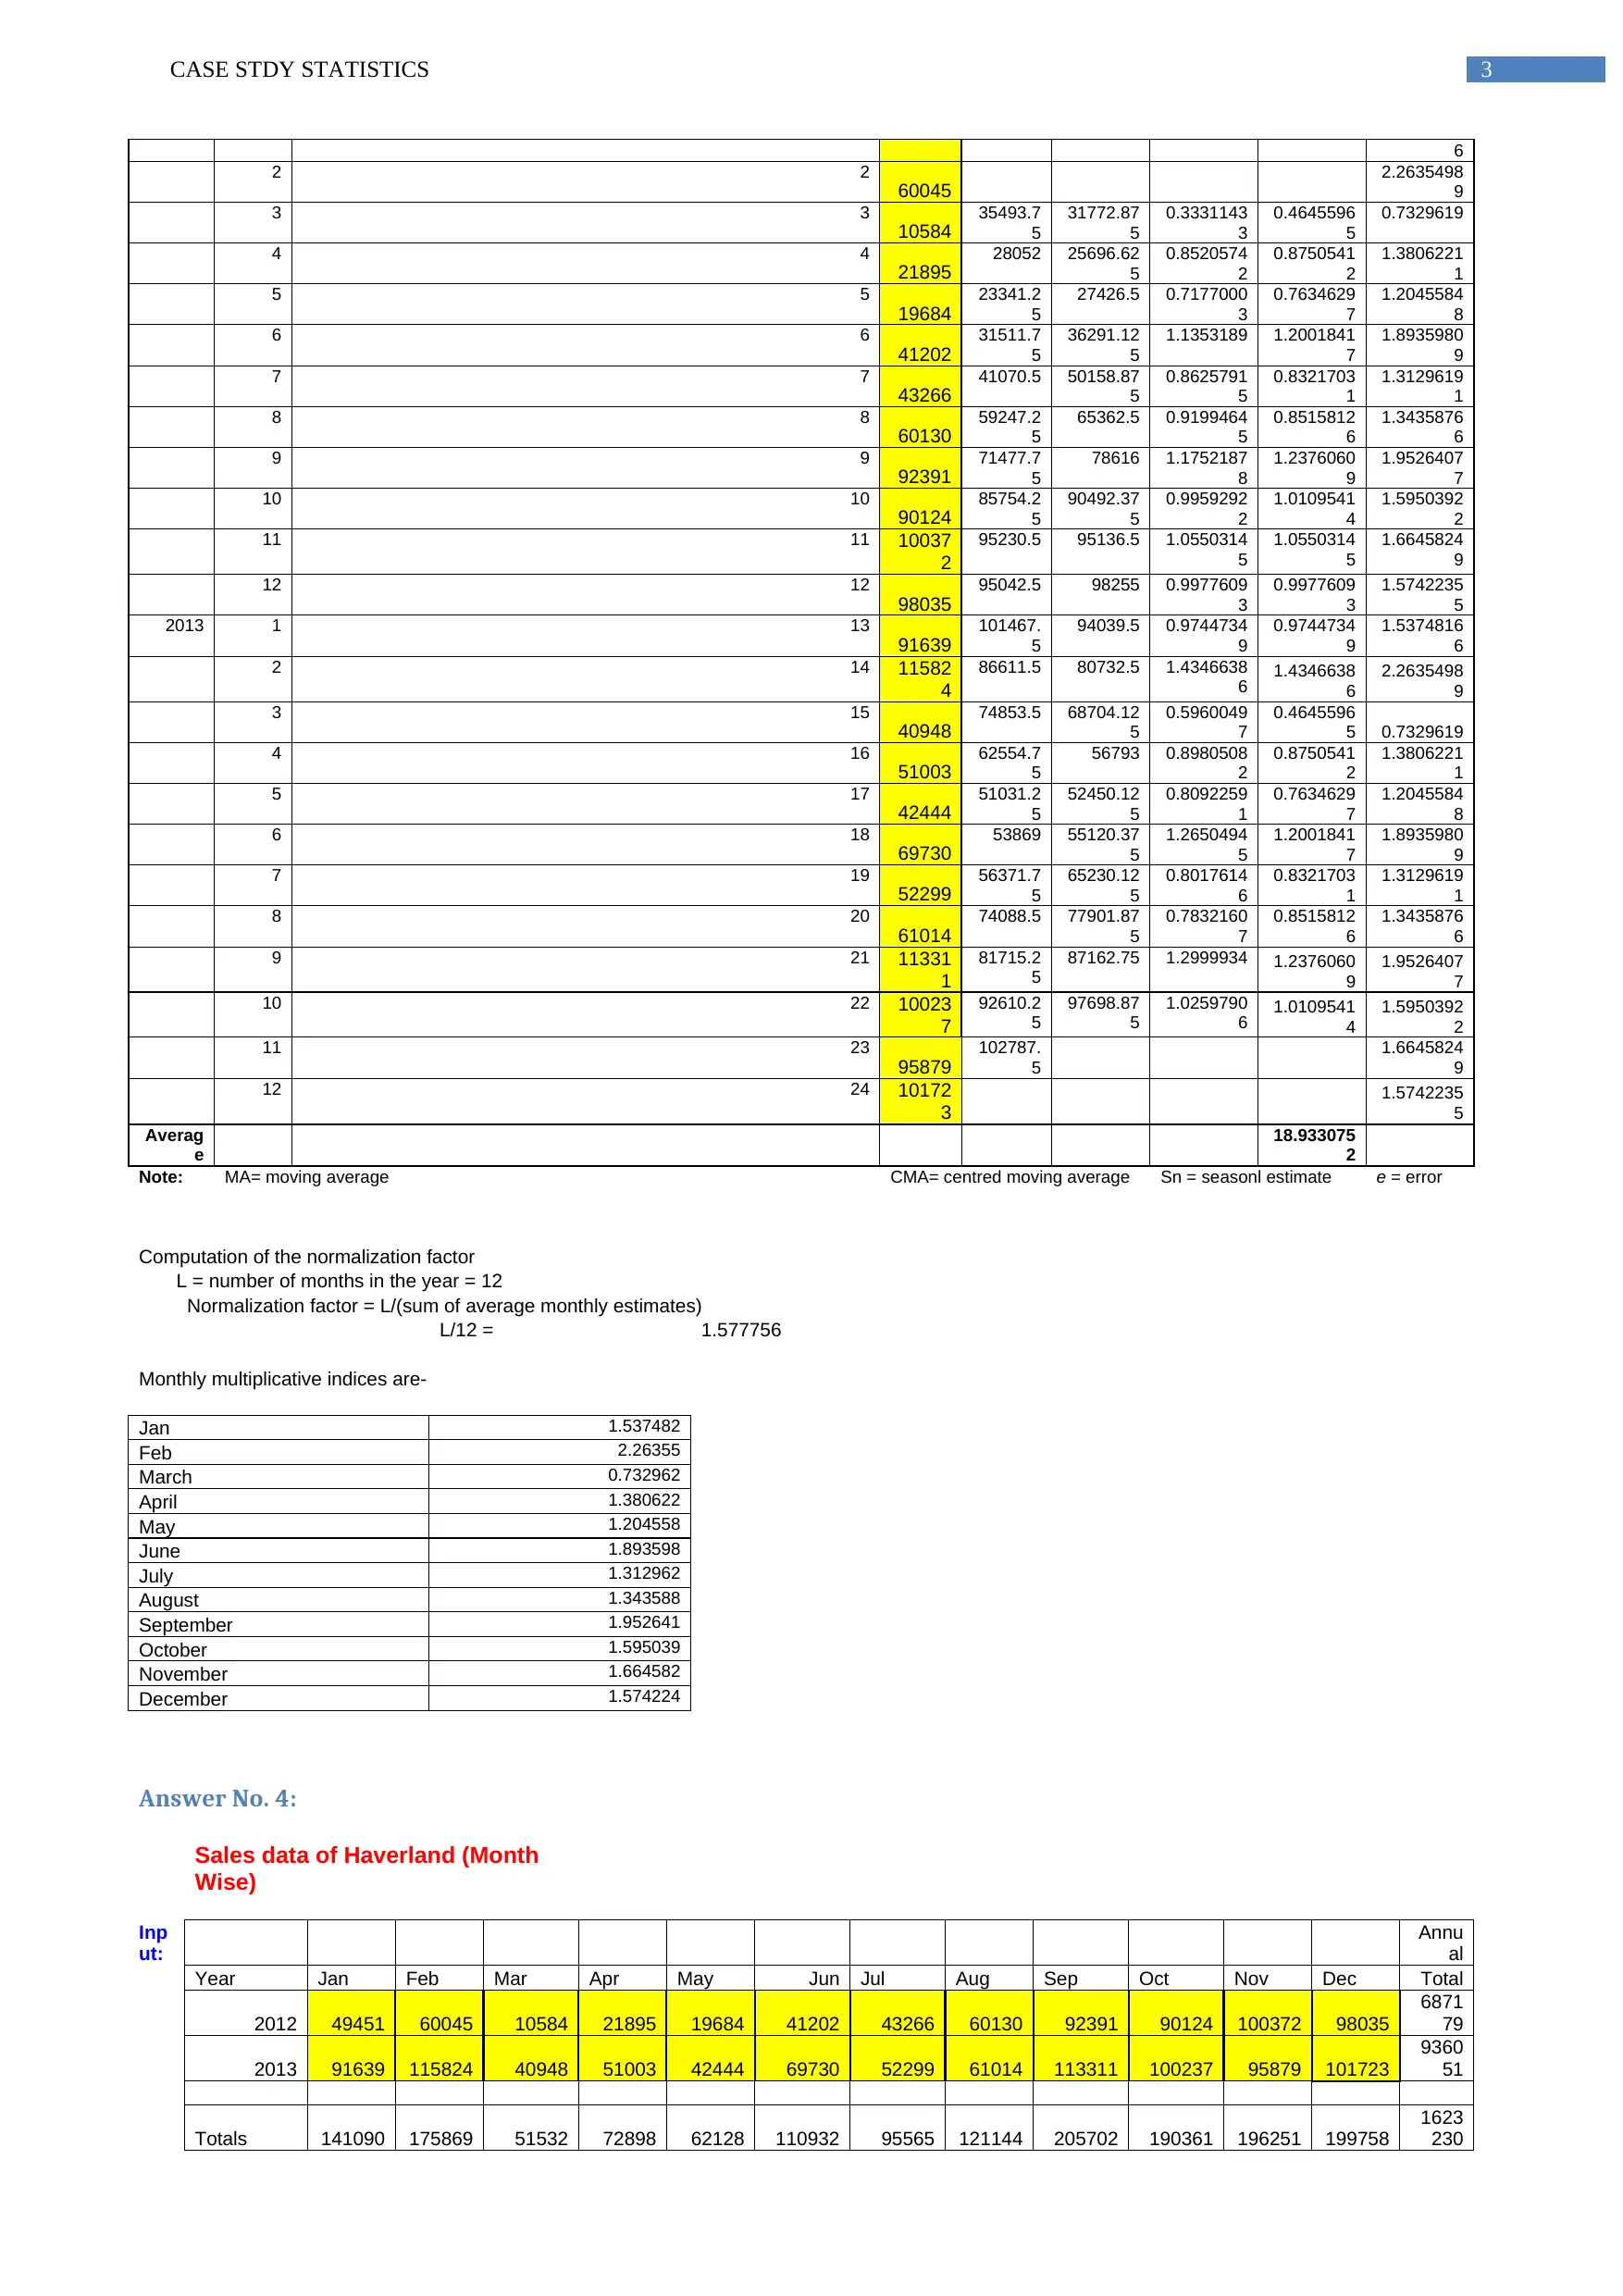
Note: MA= moving average CMA= centred moving average Sn = seasonl estimate e = error
Computation of the normalization factor
L = number of months in the year = 12
Normalization factor = L/(sum of average monthly estimates)
L/12 = 1.577756
Monthly multiplicative indices are-
Jan 1.537482
Feb 2.26355
March 0.732962
April 1.380622
May 1.204558
June 1.893598
July 1.312962
August 1.343588
September 1.952641
October 1.595039
November 1.664582
December 1.574224
Answer No. 4:
Sales data of Haverland (Month
Wise)
Inp
ut:
Annu
al
Year Jan Feb Mar Apr May Jun Jul Aug Sep Oct Nov Dec Total
2012 49451 60045 10584 21895 19684 41202 43266 60130 92391 90124 100372 98035
6871
79
2013 91639 115824 40948 51003 42444 69730 52299 61014 113311 100237 95879 101723
9360
51
Totals 141090 175869 51532 72898 62128 110932 95565 121144 205702 190361 196251 199758
1623
230
6
2 2
60045
2.2635498
9
3 3
10584
35493.7
5
31772.87
5
0.3331143
3
0.4645596
5
0.7329619
4 4
21895
28052 25696.62
5
0.8520574
2
0.8750541
2
1.3806221
1
5 5
19684
23341.2
5
27426.5 0.7177000
3
0.7634629
7
1.2045584
8
6 6
41202
31511.7
5
36291.12
5
1.1353189 1.2001841
7
1.8935980
9
7 7
43266
41070.5 50158.87
5
0.8625791
5
0.8321703
1
1.3129619
1
8 8
60130
59247.2
5
65362.5 0.9199464
5
0.8515812
6
1.3435876
6
9 9
92391
71477.7
5
78616 1.1752187
8
1.2376060
9
1.9526407
7
10 10
90124
85754.2
5
90492.37
5
0.9959292
2
1.0109541
4
1.5950392
2
11 11 10037
2
95230.5 95136.5 1.0550314
5
1.0550314
5
1.6645824
9
12 12
98035
95042.5 98255 0.9977609
3
0.9977609
3
1.5742235
5
2013 1 13
91639
101467.
5
94039.5 0.9744734
9
0.9744734
9
1.5374816
6
2 14 11582
4
86611.5 80732.5 1.4346638
6 1.4346638
6
2.2635498
9
3 15
40948
74853.5 68704.12
5
0.5960049
7
0.4645596
5 0.7329619
4 16
51003
62554.7
5
56793 0.8980508
2
0.8750541
2
1.3806221
1
5 17
42444
51031.2
5
52450.12
5
0.8092259
1
0.7634629
7
1.2045584
8
6 18
69730
53869 55120.37
5
1.2650494
5
1.2001841
7
1.8935980
9
7 19
52299
56371.7
5
65230.12
5
0.8017614
6
0.8321703
1
1.3129619
1
8 20
61014
74088.5 77901.87
5
0.7832160
7
0.8515812
6
1.3435876
6
9 21 11331
1
81715.2
5
87162.75 1.2999934 1.2376060
9
1.9526407
7
10 22 10023
7
92610.2
5
97698.87
5
1.0259790
6 1.0109541
4
1.5950392
2
11 23
95879
102787.
5
1.6645824
9
12 24 10172
3
1.5742235
5
Averag
e
18.933075
2
Note: MA= moving average CMA= centred moving average Sn = seasonl estimate e = error
Computation of the normalization factor
L = number of months in the year = 12
Normalization factor = L/(sum of average monthly estimates)
L/12 = 1.577756
Monthly multiplicative indices are-
Jan 1.537482
Feb 2.26355
March 0.732962
April 1.380622
May 1.204558
June 1.893598
July 1.312962
August 1.343588
September 1.952641
October 1.595039
November 1.664582
December 1.574224
Answer No. 4:
Sales data of Haverland (Month
Wise)
Inp
ut:
Annu
al
Year Jan Feb Mar Apr May Jun Jul Aug Sep Oct Nov Dec Total
2012 49451 60045 10584 21895 19684 41202 43266 60130 92391 90124 100372 98035
6871
79
2013 91639 115824 40948 51003 42444 69730 52299 61014 113311 100237 95879 101723
9360
51
Totals 141090 175869 51532 72898 62128 110932 95565 121144 205702 190361 196251 199758
1623
230
Paraphrase This Document
Need a fresh take? Get an instant paraphrase of this document with our AI Paraphraser
4CASE STDY STATISTICS
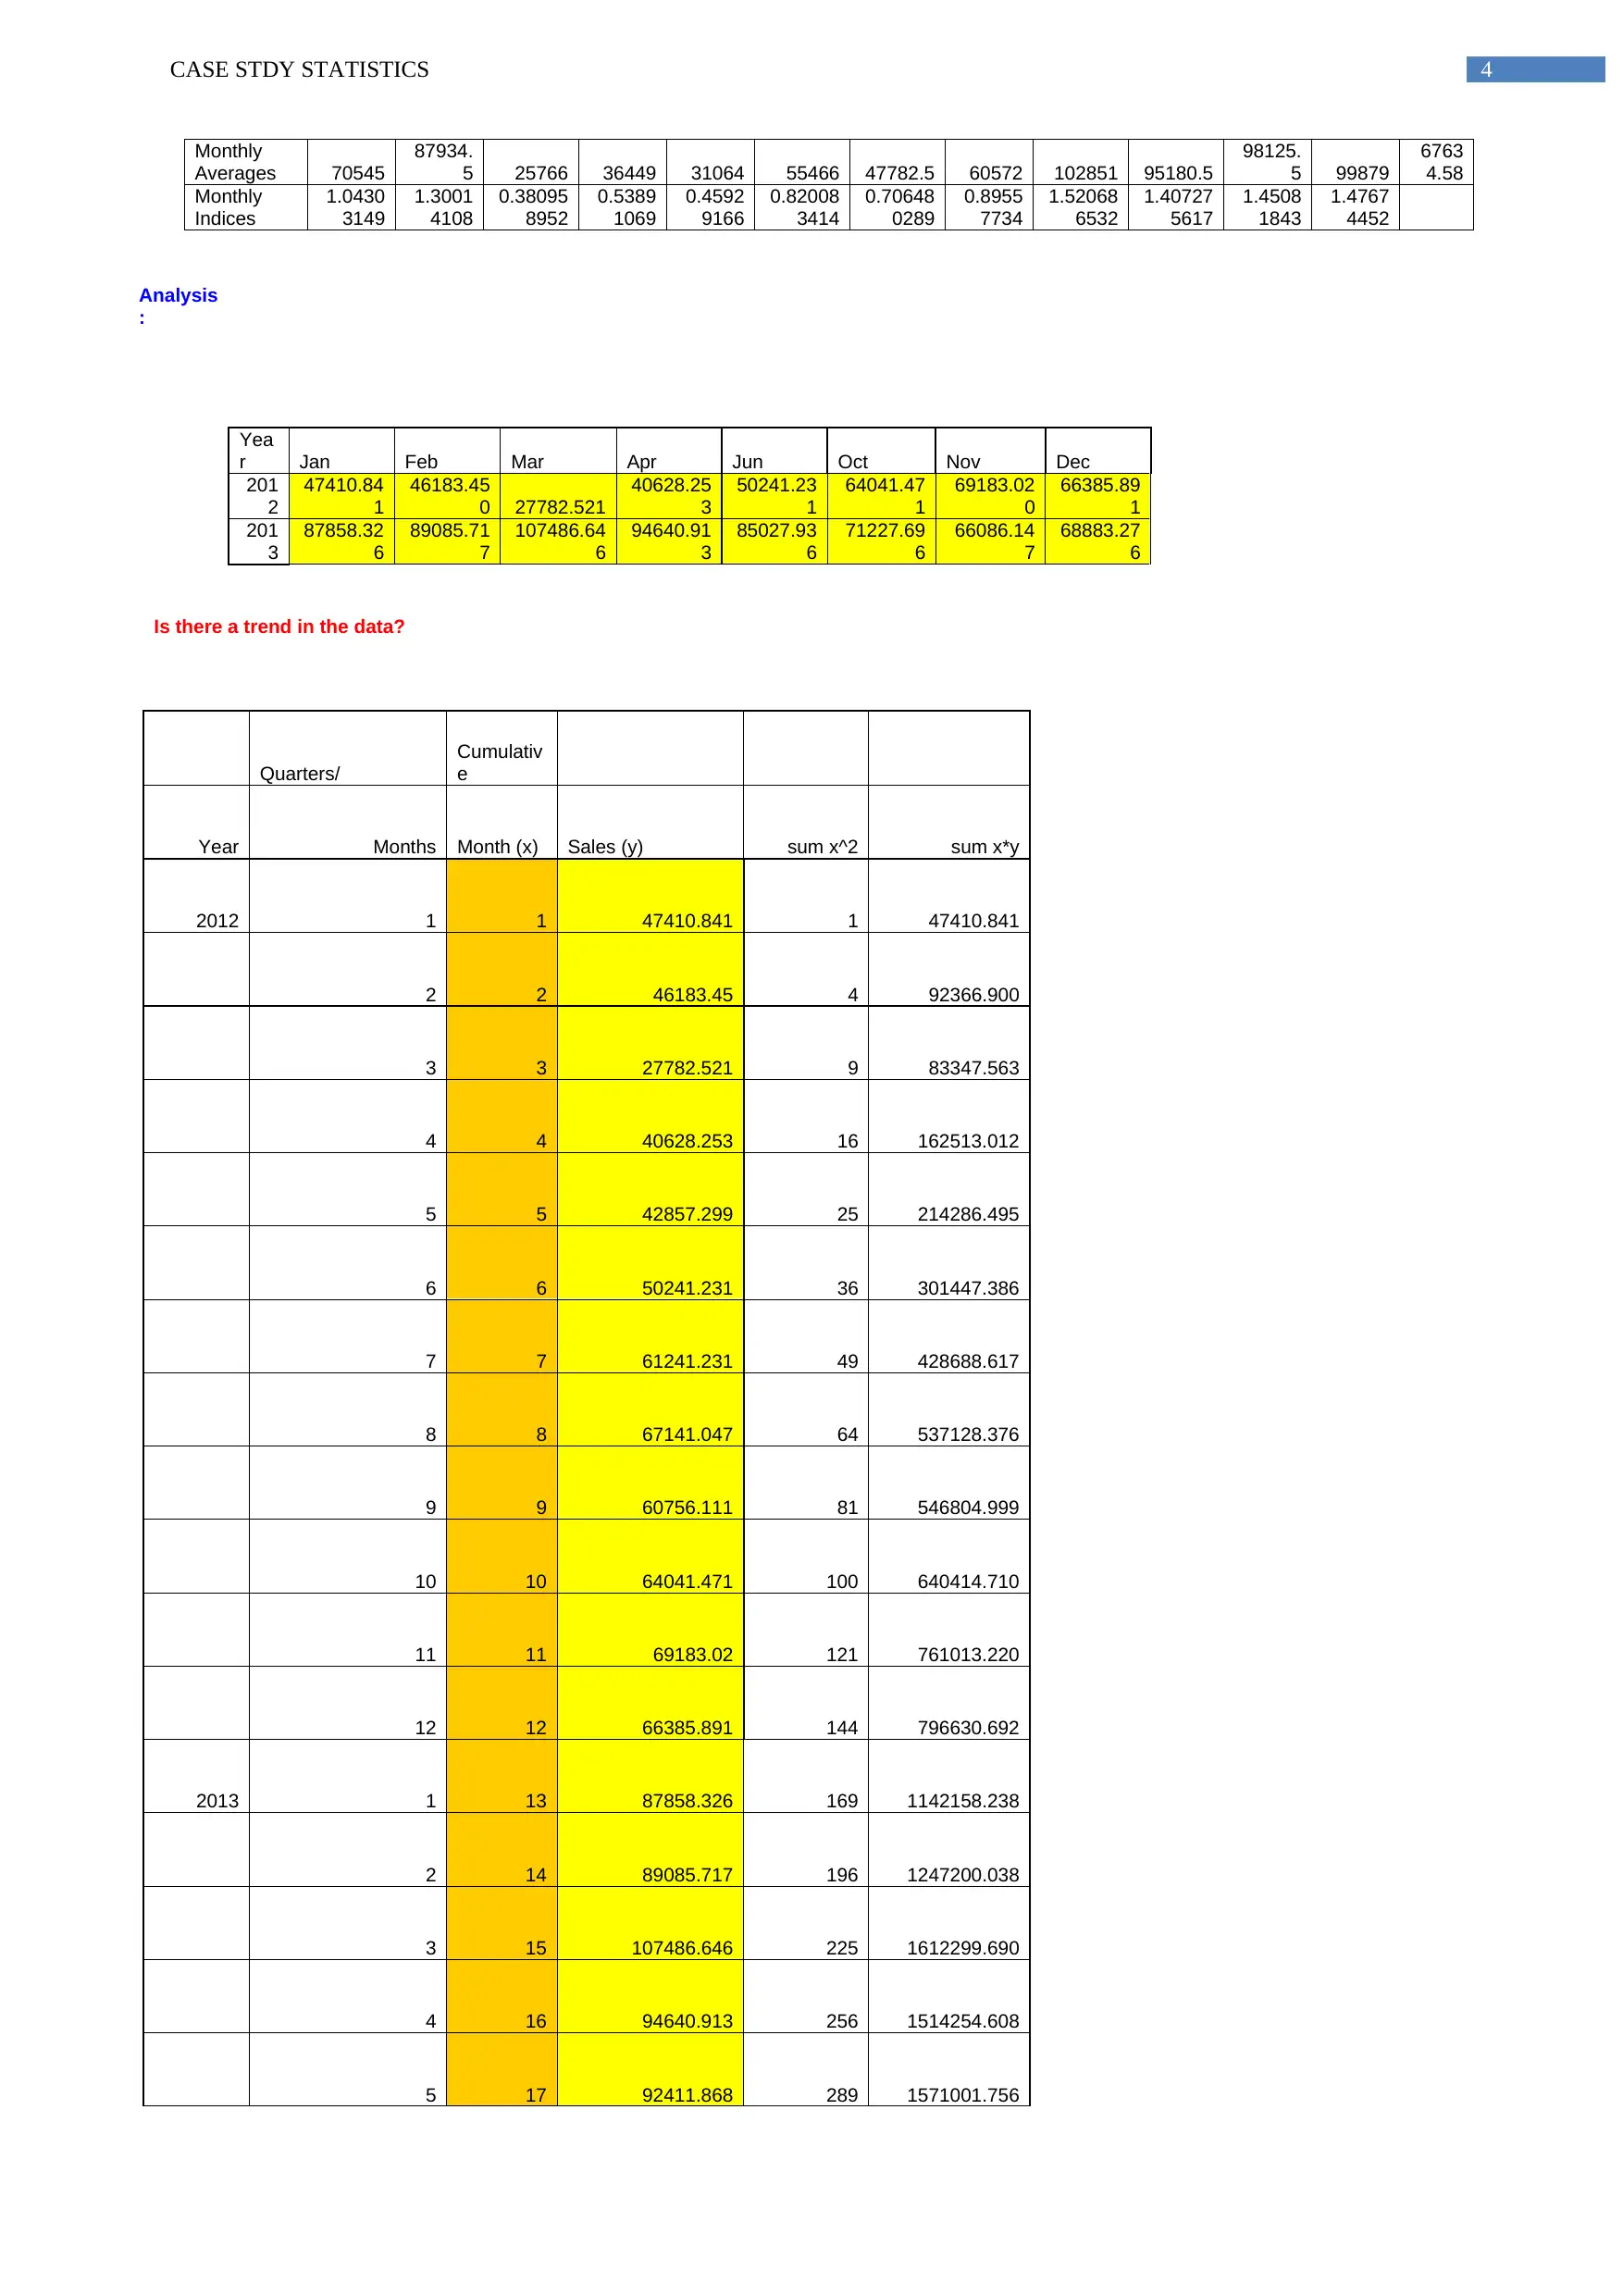
Monthly
Averages 70545
87934.
5 25766 36449 31064 55466 47782.5 60572 102851 95180.5
98125.
5 99879
6763
4.58
Monthly
Indices
1.0430
3149
1.3001
4108
0.38095
8952
0.5389
1069
0.4592
9166
0.82008
3414
0.70648
0289
0.8955
7734
1.52068
6532
1.40727
5617
1.4508
1843
1.4767
4452
Analysis
:
Yea
r Jan Feb Mar Apr Jun Oct Nov Dec
201
2
47410.84
1
46183.45
0 27782.521
40628.25
3
50241.23
1
64041.47
1
69183.02
0
66385.89
1
201
3
87858.32
6
89085.71
7
107486.64
6
94640.91
3
85027.93
6
71227.69
6
66086.14
7
68883.27
6
Is there a trend in the data?
Quarters/
Cumulativ
e
Year Months Month (x) Sales (y) sum x^2 sum x*y
2012 1 1 47410.841 1 47410.841
2 2 46183.45 4 92366.900
3 3 27782.521 9 83347.563
4 4 40628.253 16 162513.012
5 5 42857.299 25 214286.495
6 6 50241.231 36 301447.386
7 7 61241.231 49 428688.617
8 8 67141.047 64 537128.376
9 9 60756.111 81 546804.999
10 10 64041.471 100 640414.710
11 11 69183.02 121 761013.220
12 12 66385.891 144 796630.692
2013 1 13 87858.326 169 1142158.238
2 14 89085.717 196 1247200.038
3 15 107486.646 225 1612299.690
4 16 94640.913 256 1514254.608
5 17 92411.868 289 1571001.756
Monthly
Averages 70545
87934.
5 25766 36449 31064 55466 47782.5 60572 102851 95180.5
98125.
5 99879
6763
4.58
Monthly
Indices
1.0430
3149
1.3001
4108
0.38095
8952
0.5389
1069
0.4592
9166
0.82008
3414
0.70648
0289
0.8955
7734
1.52068
6532
1.40727
5617
1.4508
1843
1.4767
4452
Analysis
:
Yea
r Jan Feb Mar Apr Jun Oct Nov Dec
201
2
47410.84
1
46183.45
0 27782.521
40628.25
3
50241.23
1
64041.47
1
69183.02
0
66385.89
1
201
3
87858.32
6
89085.71
7
107486.64
6
94640.91
3
85027.93
6
71227.69
6
66086.14
7
68883.27
6
Is there a trend in the data?
Quarters/
Cumulativ
e
Year Months Month (x) Sales (y) sum x^2 sum x*y
2012 1 1 47410.841 1 47410.841
2 2 46183.45 4 92366.900
3 3 27782.521 9 83347.563
4 4 40628.253 16 162513.012
5 5 42857.299 25 214286.495
6 6 50241.231 36 301447.386
7 7 61241.231 49 428688.617
8 8 67141.047 64 537128.376
9 9 60756.111 81 546804.999
10 10 64041.471 100 640414.710
11 11 69183.02 121 761013.220
12 12 66385.891 144 796630.692
2013 1 13 87858.326 169 1142158.238
2 14 89085.717 196 1247200.038
3 15 107486.646 225 1612299.690
4 16 94640.913 256 1514254.608
5 17 92411.868 289 1571001.756
5CASE STDY STATISTICS
6 18 85027.936 324 1530502.848
7 19 74027.543 361 1406523.317
8 20 68128.120 400 1362562.400
9 21 74513.056 441 1564774.176
10 22 71227.696 484 1567009.312
11 23 66086.147 529 1519981.381
12 24 68883.276 576 1653198.624
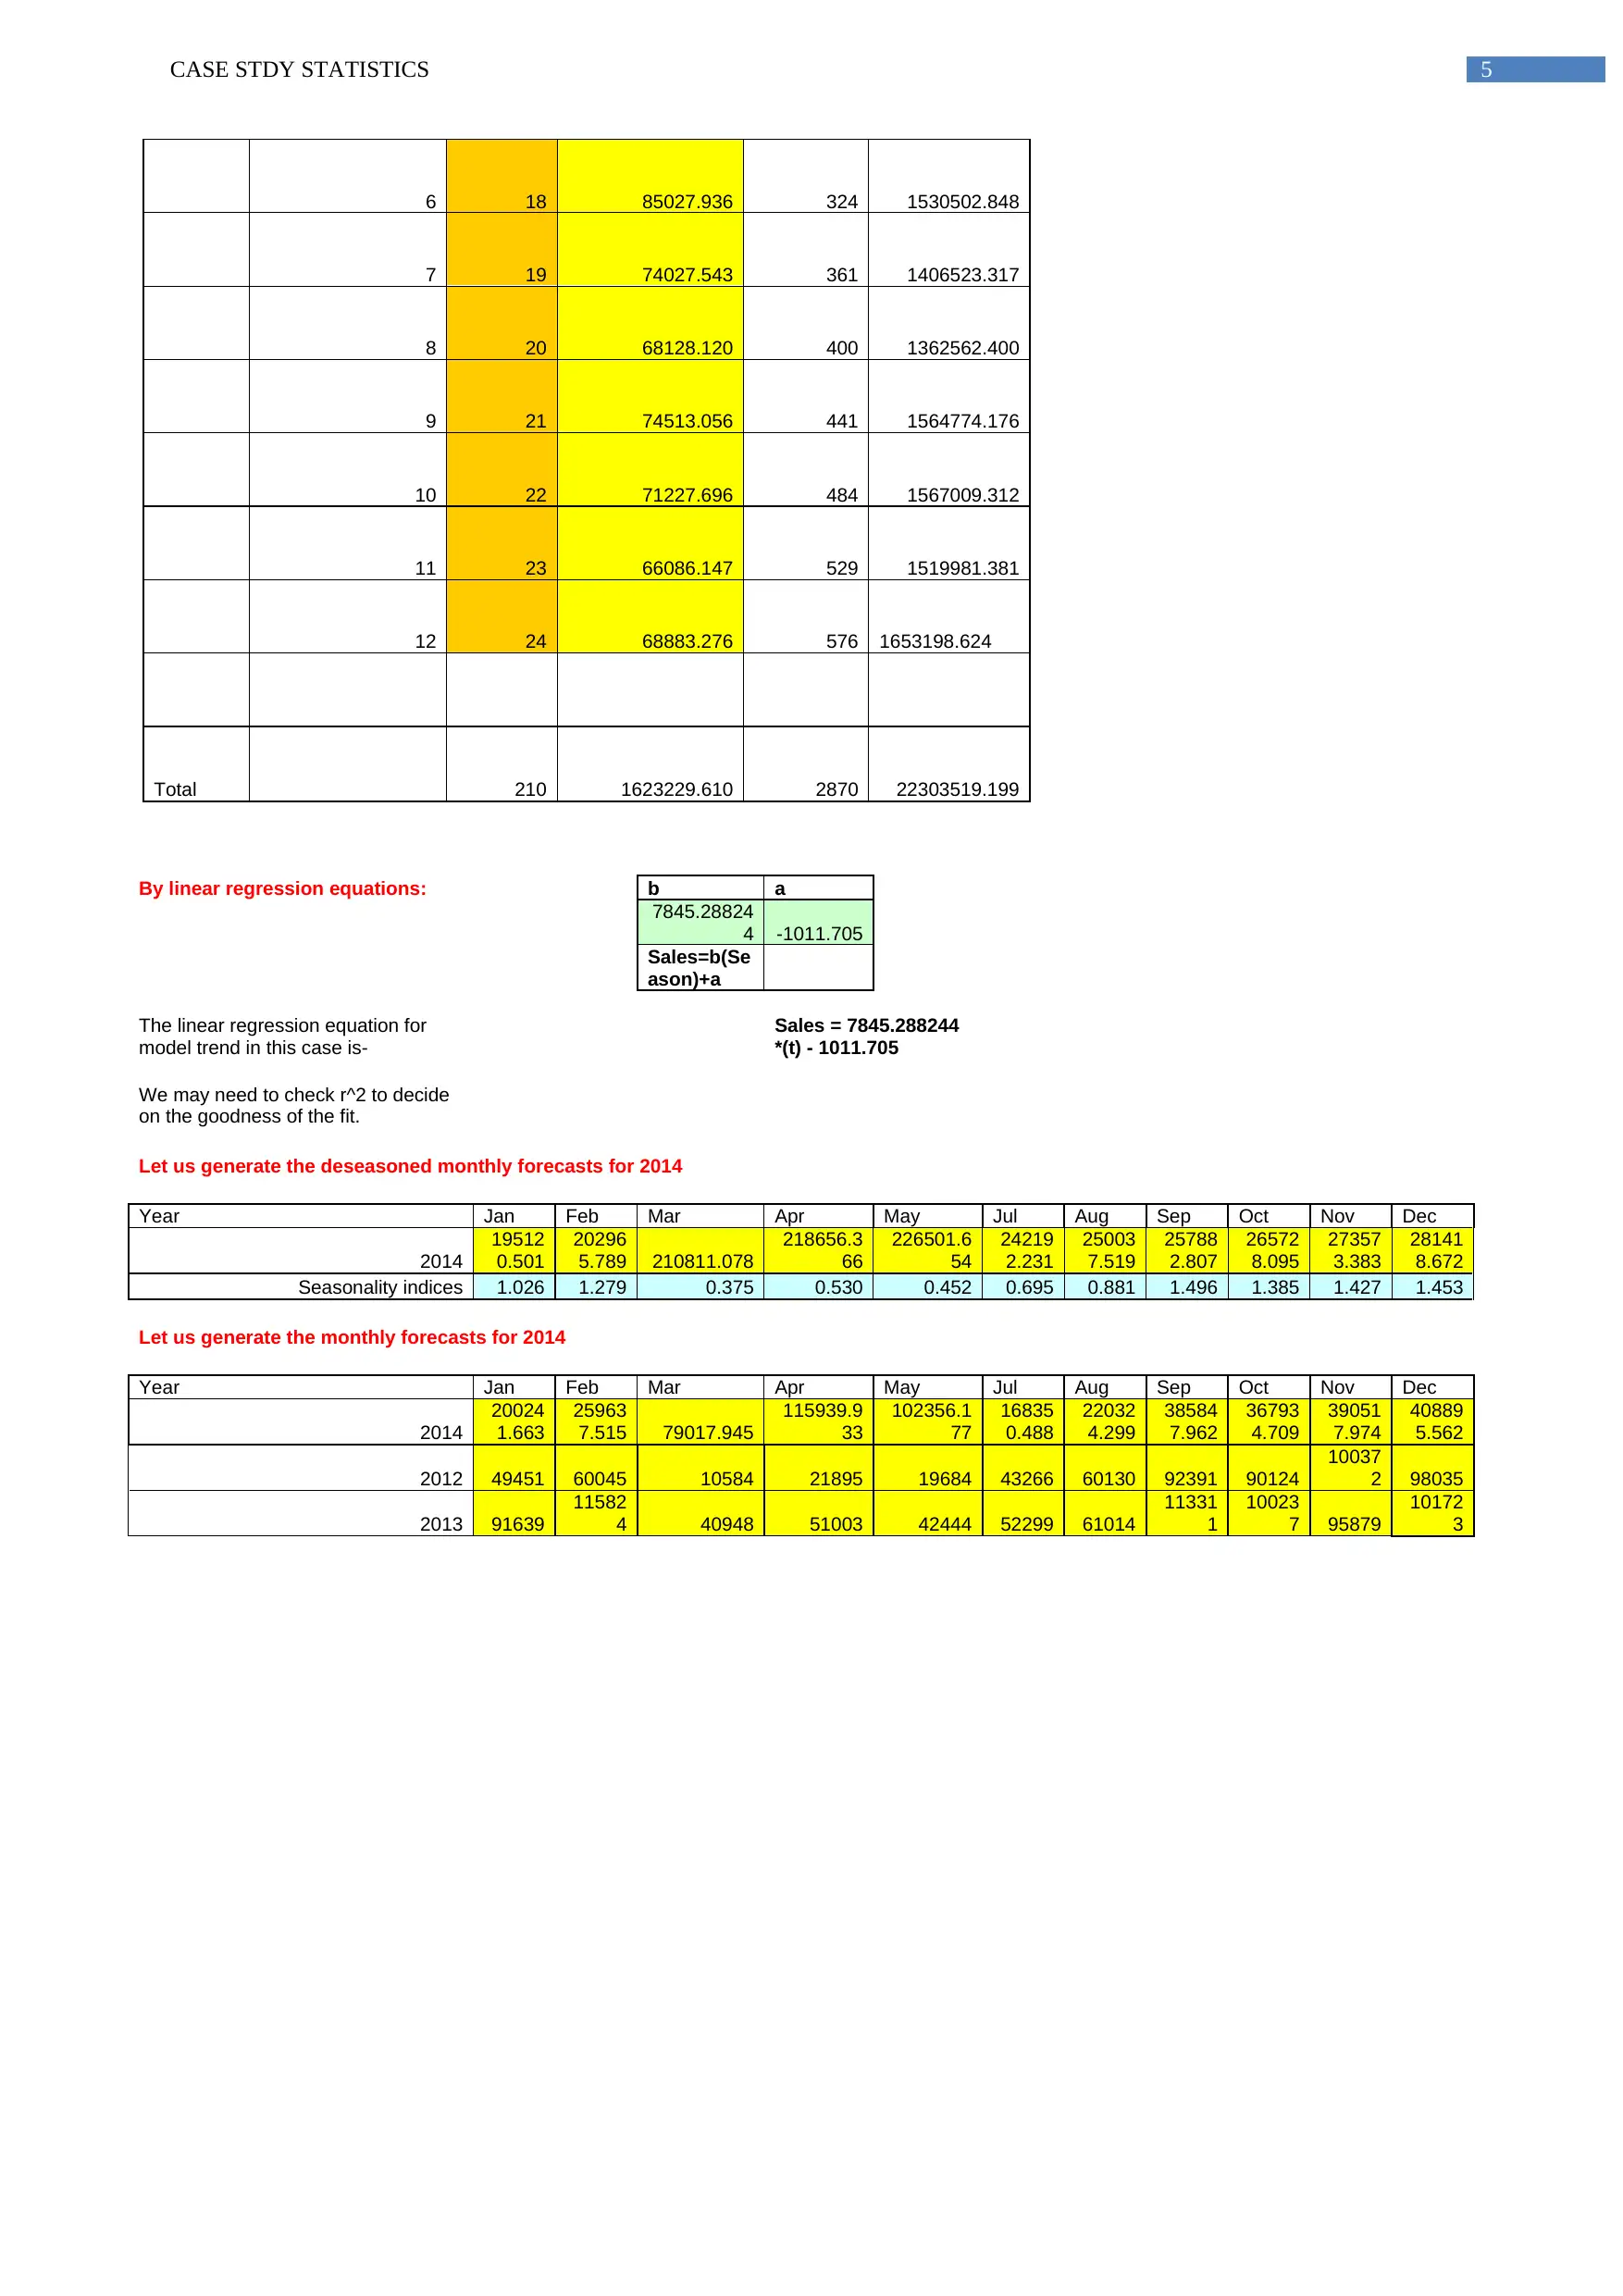
Total 210 1623229.610 2870 22303519.199
By linear regression equations: b a
7845.28824
4 -1011.705
Sales=b(Se
ason)+a
The linear regression equation for
model trend in this case is-
Sales = 7845.288244
*(t) - 1011.705
We may need to check r^2 to decide
on the goodness of the fit.
Let us generate the deseasoned monthly forecasts for 2014
Year Jan Feb Mar Apr May Jul Aug Sep Oct Nov Dec
2014
19512
0.501
20296
5.789 210811.078
218656.3
66
226501.6
54
24219
2.231
25003
7.519
25788
2.807
26572
8.095
27357
3.383
28141
8.672
Seasonality indices 1.026 1.279 0.375 0.530 0.452 0.695 0.881 1.496 1.385 1.427 1.453
Let us generate the monthly forecasts for 2014
Year Jan Feb Mar Apr May Jul Aug Sep Oct Nov Dec
2014
20024
1.663
25963
7.515 79017.945
115939.9
33
102356.1
77
16835
0.488
22032
4.299
38584
7.962
36793
4.709
39051
7.974
40889
5.562
2012 49451 60045 10584 21895 19684 43266 60130 92391 90124
10037
2 98035
2013 91639
11582
4 40948 51003 42444 52299 61014
11331
1
10023
7 95879
10172
3
6 18 85027.936 324 1530502.848
7 19 74027.543 361 1406523.317
8 20 68128.120 400 1362562.400
9 21 74513.056 441 1564774.176
10 22 71227.696 484 1567009.312
11 23 66086.147 529 1519981.381
12 24 68883.276 576 1653198.624
Total 210 1623229.610 2870 22303519.199
By linear regression equations: b a
7845.28824
4 -1011.705
Sales=b(Se
ason)+a
The linear regression equation for
model trend in this case is-
Sales = 7845.288244
*(t) - 1011.705
We may need to check r^2 to decide
on the goodness of the fit.
Let us generate the deseasoned monthly forecasts for 2014
Year Jan Feb Mar Apr May Jul Aug Sep Oct Nov Dec
2014
19512
0.501
20296
5.789 210811.078
218656.3
66
226501.6
54
24219
2.231
25003
7.519
25788
2.807
26572
8.095
27357
3.383
28141
8.672
Seasonality indices 1.026 1.279 0.375 0.530 0.452 0.695 0.881 1.496 1.385 1.427 1.453
Let us generate the monthly forecasts for 2014
Year Jan Feb Mar Apr May Jul Aug Sep Oct Nov Dec
2014
20024
1.663
25963
7.515 79017.945
115939.9
33
102356.1
77
16835
0.488
22032
4.299
38584
7.962
36793
4.709
39051
7.974
40889
5.562
2012 49451 60045 10584 21895 19684 43266 60130 92391 90124
10037
2 98035
2013 91639
11582
4 40948 51003 42444 52299 61014
11331
1
10023
7 95879
10172
3
⊘ This is a preview!⊘
Do you want full access?
Subscribe today to unlock all pages.
Trusted by 1+ million students worldwide
6CASE STDY STATISTICS
Jan Feb Mar Apr May Jul Aug Sep Oct Nov Dec
0.000
50000.000
100000.000
150000.000
200000.000
250000.000
300000.000
350000.000
400000.000
450000.000
200241.663
259637.515
79017.945
115939.933 102356.177
168350.488
220324.299
385847.962 367934.709
390517.974 408895.562
Month wise Estimated sales of 2014
Year 2014
Monthly predicted sales of 2014
Jan Feb Mar Apr May Jul Aug Sep Oct Nov Dec
0.000
50000.000
100000.000
150000.000
200000.000
250000.000
300000.000
350000.000
400000.000
450000.000
Scatterplot of Sales of three years
2014
2012
2013
Monthly Predicted Sales
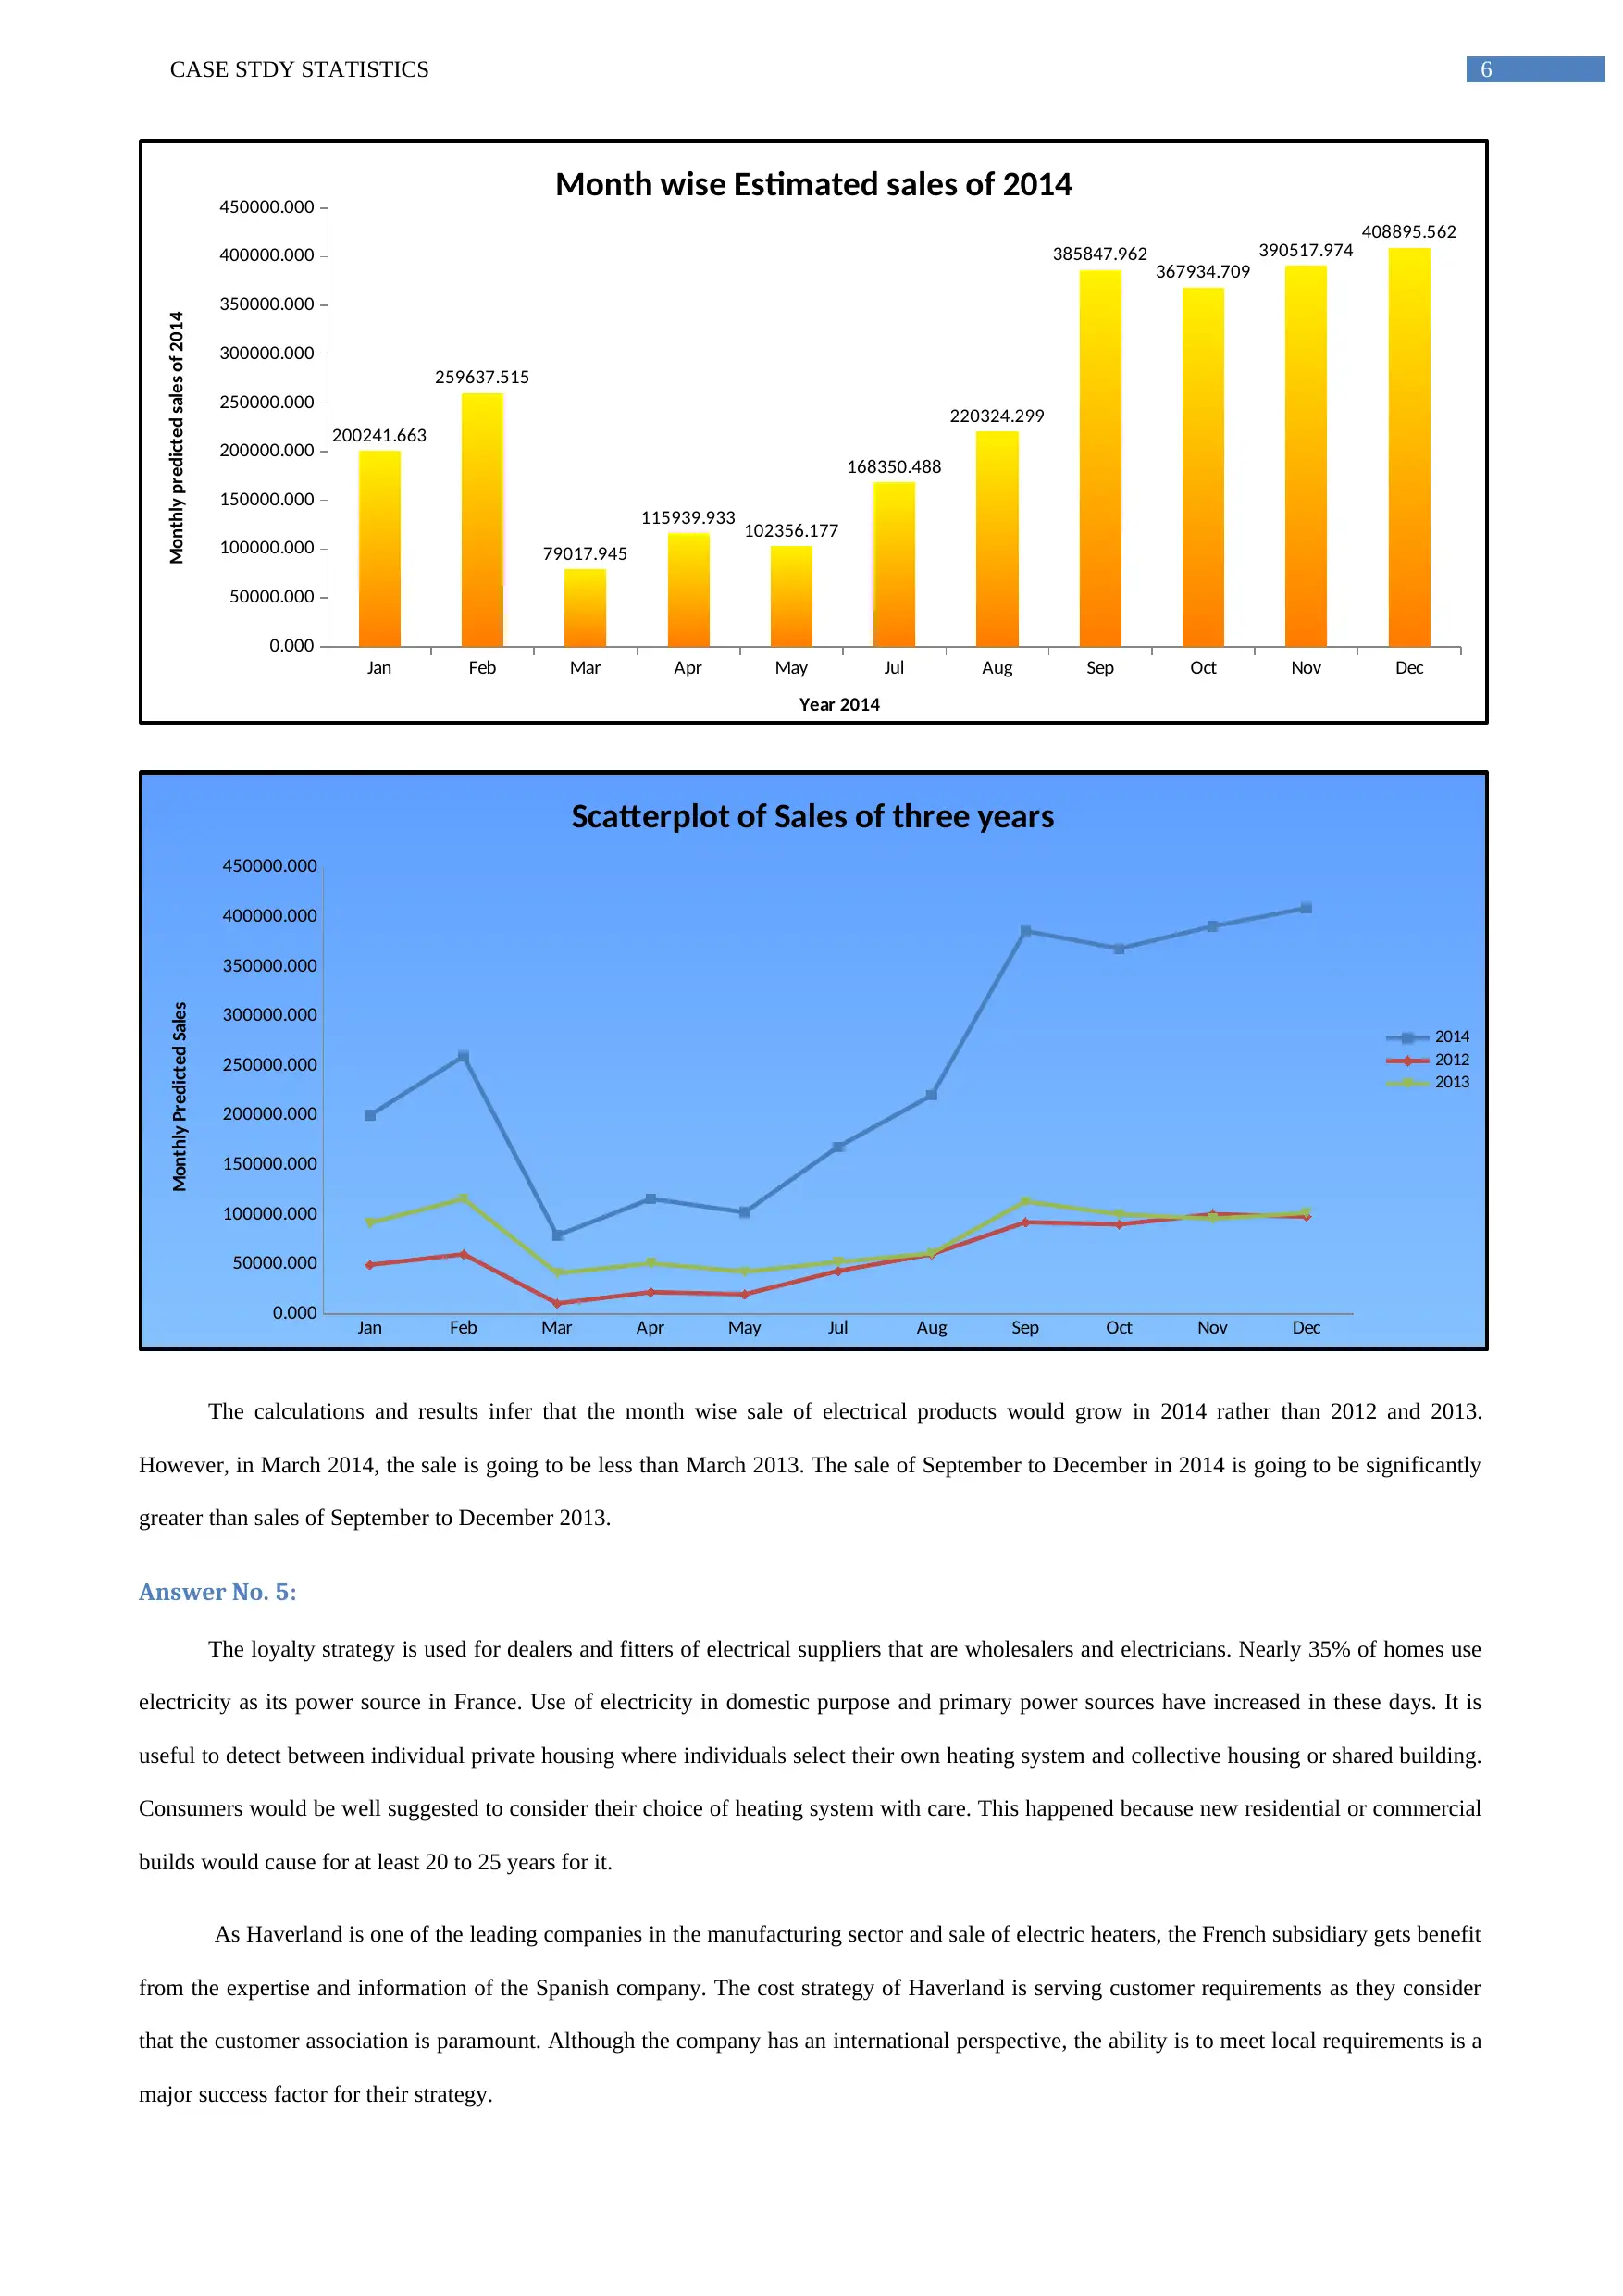
The calculations and results infer that the month wise sale of electrical products would grow in 2014 rather than 2012 and 2013.
However, in March 2014, the sale is going to be less than March 2013. The sale of September to December in 2014 is going to be significantly
greater than sales of September to December 2013.
Answer No. 5:
The loyalty strategy is used for dealers and fitters of electrical suppliers that are wholesalers and electricians. Nearly 35% of homes use
electricity as its power source in France. Use of electricity in domestic purpose and primary power sources have increased in these days. It is
useful to detect between individual private housing where individuals select their own heating system and collective housing or shared building.
Consumers would be well suggested to consider their choice of heating system with care. This happened because new residential or commercial
builds would cause for at least 20 to 25 years for it.
As Haverland is one of the leading companies in the manufacturing sector and sale of electric heaters, the French subsidiary gets benefit
from the expertise and information of the Spanish company. The cost strategy of Haverland is serving customer requirements as they consider
that the customer association is paramount. Although the company has an international perspective, the ability is to meet local requirements is a
major success factor for their strategy.
Jan Feb Mar Apr May Jul Aug Sep Oct Nov Dec
0.000
50000.000
100000.000
150000.000
200000.000
250000.000
300000.000
350000.000
400000.000
450000.000
200241.663
259637.515
79017.945
115939.933 102356.177
168350.488
220324.299
385847.962 367934.709
390517.974 408895.562
Month wise Estimated sales of 2014
Year 2014
Monthly predicted sales of 2014
Jan Feb Mar Apr May Jul Aug Sep Oct Nov Dec
0.000
50000.000
100000.000
150000.000
200000.000
250000.000
300000.000
350000.000
400000.000
450000.000
Scatterplot of Sales of three years
2014
2012
2013
Monthly Predicted Sales
The calculations and results infer that the month wise sale of electrical products would grow in 2014 rather than 2012 and 2013.
However, in March 2014, the sale is going to be less than March 2013. The sale of September to December in 2014 is going to be significantly
greater than sales of September to December 2013.
Answer No. 5:
The loyalty strategy is used for dealers and fitters of electrical suppliers that are wholesalers and electricians. Nearly 35% of homes use
electricity as its power source in France. Use of electricity in domestic purpose and primary power sources have increased in these days. It is
useful to detect between individual private housing where individuals select their own heating system and collective housing or shared building.
Consumers would be well suggested to consider their choice of heating system with care. This happened because new residential or commercial
builds would cause for at least 20 to 25 years for it.
As Haverland is one of the leading companies in the manufacturing sector and sale of electric heaters, the French subsidiary gets benefit
from the expertise and information of the Spanish company. The cost strategy of Haverland is serving customer requirements as they consider
that the customer association is paramount. Although the company has an international perspective, the ability is to meet local requirements is a
major success factor for their strategy.
Paraphrase This Document
Need a fresh take? Get an instant paraphrase of this document with our AI Paraphraser

7CASE STDY STATISTICS
Electric heating suppliers majorly communicate via internet and on television. Haverland like other companies have their own website
for providing constant and borderless communication to their customers. In today’s world, social networks are crucial communication tools for
carrying out business. Haverland consequently present on Facebook, Twitter and Youtube. The use of social networks permits brands to enhance
their vision, promote loyalty and better understand their customers.
1 out of 8
Related Documents


Your All-in-One AI-Powered Toolkit for Academic Success.
+13062052269
info@desklib.com
Available 24*7 on WhatsApp / Email
![[object Object]](/_next/static/media/star-bottom.7253800d.svg)
Unlock your academic potential
Copyright © 2020–2026 A2Z Services. All Rights Reserved. Developed and managed by ZUCOL.