Comprehensive Financial Performance Report: Hays Plc (2017-2018)
VerifiedAdded on 2020/10/05
|13
|3215
|270
Report
AI Summary
This report presents a detailed financial analysis of Hays Plc for the years 2017 and 2018. It begins with an introduction to the company, its external auditors (Pricewaterhousecoopers LLP), and its business model, which centers on percentage fees from candidate placements. The analysis then delves into the company's financial performance, examining profitability, activity, liquidity, financial structure, and investment ratios. The report provides a comparative analysis of the financial statements, including profit and loss, balance sheet, and cash flow statements, highlighting key changes and trends. It also includes a segmental analysis of the company's operations across different geographic regions. The analysis reveals a mixed performance, with improvements in revenue, gross profit, and equity, but also declines in certain ratios such as return on capital employed. The report concludes with an assessment of Hays Plc's overall financial health and provides insights into potential areas for improvement. The report uses financial ratios such as gross profit ratio, return on capital employed, operating profit margin, asset turnover, trade receivables and payable turnover, current ratio and quick ratio to assess Hays' financial position.

CORPORATE REPORTING
Paraphrase This Document
Need a fresh take? Get an instant paraphrase of this document with our AI Paraphraser
TABLE OF CONTENTS
INTRODUCTION...........................................................................................................................1
1.1 Company name along with its external auditors....................................................................1
1.2 Business model......................................................................................................................1
ASSUMPTIONS..............................................................................................................................1
ANALYSIS AND INTERPRETATION ........................................................................................2
3.1 Stating overall performance...................................................................................................2
3.2 Profitability ratios..................................................................................................................4
3.3 Activity Ratio.........................................................................................................................5
3.4 Liquidity management...........................................................................................................5
3.5 Financial structure and gearing..............................................................................................6
3.6 Investment Ratios...................................................................................................................6
CONCLUSION................................................................................................................................7
REFERENCES................................................................................................................................8
APPENDIX......................................................................................................................................9
Ration Analysis............................................................................................................................9
INTRODUCTION
1.1 Company name along with its external auditors
The main objective of this report is to give information about various shareholder which
might be interested to invest in Hays Plc. This report would be providing appropriate analysis of
financial statements of Hays Plc for year 2017 and 2018 which is audited by
Pricewaterhousecoopers LLP.
In the similar aspect, it would be observing percentage change from year 2017 to 2018
along with proper ratio analysis such as profitability, liquidity, solvency, investment and
efficiency. Furthermore, it would be using various financial statements for analysing its financial
performance and position of Hays Plc of these two consecutive years. Simultaneously, there will
be discussion of improvements which must be formed for enhancing other opportunities of
investment.
1.2 Business model
The revenue model is very simple in this organization as they gain percentage fee on
contingent aspect if any candidate is placed in particular role with specific client. In the similar
aspect, its delivery model is with reference to deep industry expertise among contract, permanent
and temporary recruitment markets. The most important thing is that there consultants are long
termed, trusted to both candidates and clients as well. They have equipped various technology,
data analytics and tools in this industry as there focus is on net fees instead of turnover which is
simply contributed from temp salary. Their capability for converting its net fees into operating
profit is considered as key profit metric. The highest conversion rate is at 22% in this industry.
There main belief is to have balanced exposure in their markets which is referred as key
for driving superior and resilient financial performance along with better outcome for their
clients via economic cycle. During this exposure, there recruitment market would be having deep
scale and expertise in 20 specialist areas on basis of skilled employment. Its market capitalisation
is as 2.241 Billion (Hays plc (HAS.l), 2018).
ASSUMPTIONS
In this report, it has shown % increase or decrease in specific financial variables of two
year 2017 and 2018 for articulating worse or better position of its performance. Further, the
performance would be measured through various financial ratios such as activity, profitability,
1
⊘ This is a preview!⊘
Do you want full access?
Subscribe today to unlock all pages.
Trusted by 1+ million students worldwide
investment and liquidity. There is consideration of annual report of both specified year and this
would be helping investors and potential shareholders.
ANALYSIS AND INTERPRETATION
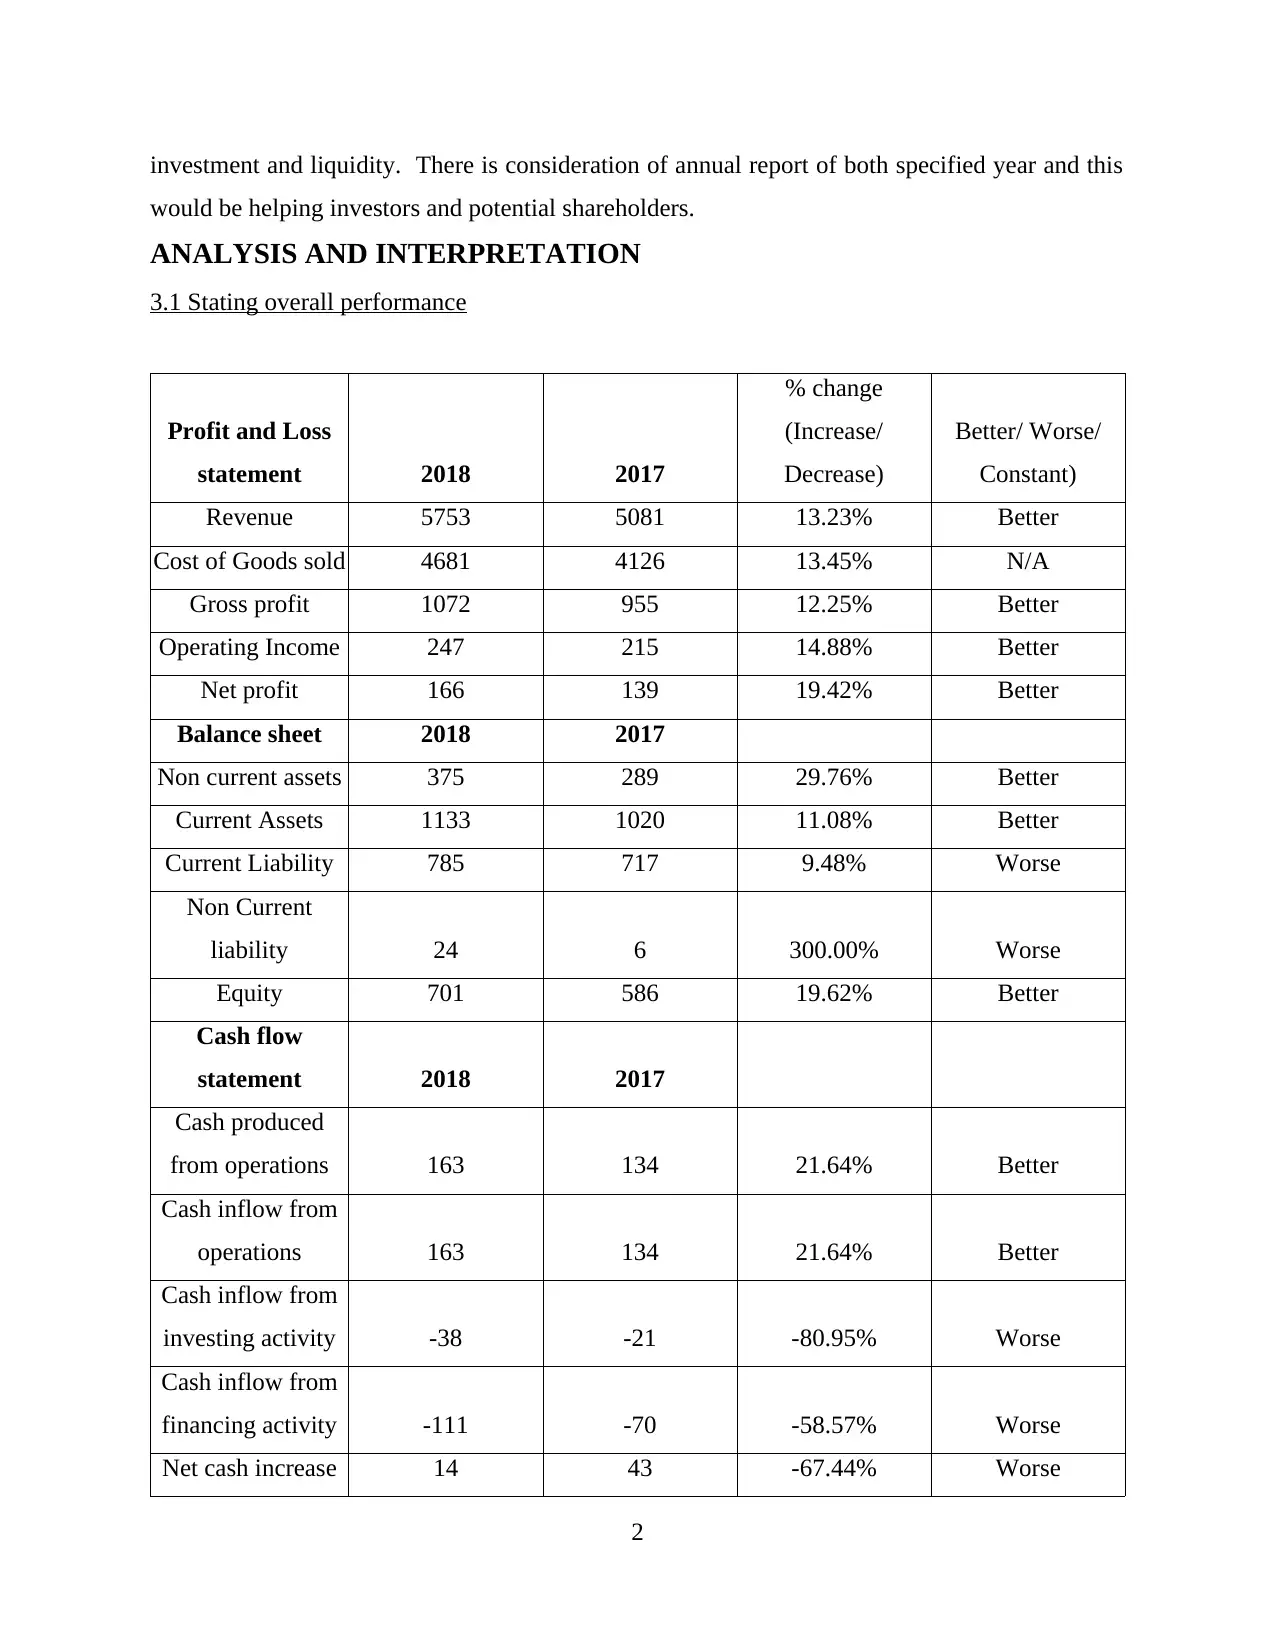
3.1 Stating overall performance
Profit and Loss
statement 2018 2017
% change
(Increase/
Decrease)
Better/ Worse/
Constant)
Revenue 5753 5081 13.23% Better
Cost of Goods sold 4681 4126 13.45% N/A
Gross profit 1072 955 12.25% Better
Operating Income 247 215 14.88% Better
Net profit 166 139 19.42% Better
Balance sheet 2018 2017
Non current assets 375 289 29.76% Better
Current Assets 1133 1020 11.08% Better
Current Liability 785 717 9.48% Worse
Non Current
liability 24 6 300.00% Worse
Equity 701 586 19.62% Better
Cash flow
statement 2018 2017
Cash produced
from operations 163 134 21.64% Better
Cash inflow from
operations 163 134 21.64% Better
Cash inflow from
investing activity -38 -21 -80.95% Worse
Cash inflow from
financing activity -111 -70 -58.57% Worse
Net cash increase 14 43 -67.44% Worse
2
would be helping investors and potential shareholders.
ANALYSIS AND INTERPRETATION
3.1 Stating overall performance
Profit and Loss
statement 2018 2017
% change
(Increase/
Decrease)
Better/ Worse/
Constant)
Revenue 5753 5081 13.23% Better
Cost of Goods sold 4681 4126 13.45% N/A
Gross profit 1072 955 12.25% Better
Operating Income 247 215 14.88% Better
Net profit 166 139 19.42% Better
Balance sheet 2018 2017
Non current assets 375 289 29.76% Better
Current Assets 1133 1020 11.08% Better
Current Liability 785 717 9.48% Worse
Non Current
liability 24 6 300.00% Worse
Equity 701 586 19.62% Better
Cash flow
statement 2018 2017
Cash produced
from operations 163 134 21.64% Better
Cash inflow from
operations 163 134 21.64% Better
Cash inflow from
investing activity -38 -21 -80.95% Worse
Cash inflow from
financing activity -111 -70 -58.57% Worse
Net cash increase 14 43 -67.44% Worse
2
Paraphrase This Document
Need a fresh take? Get an instant paraphrase of this document with our AI Paraphraser
in cash
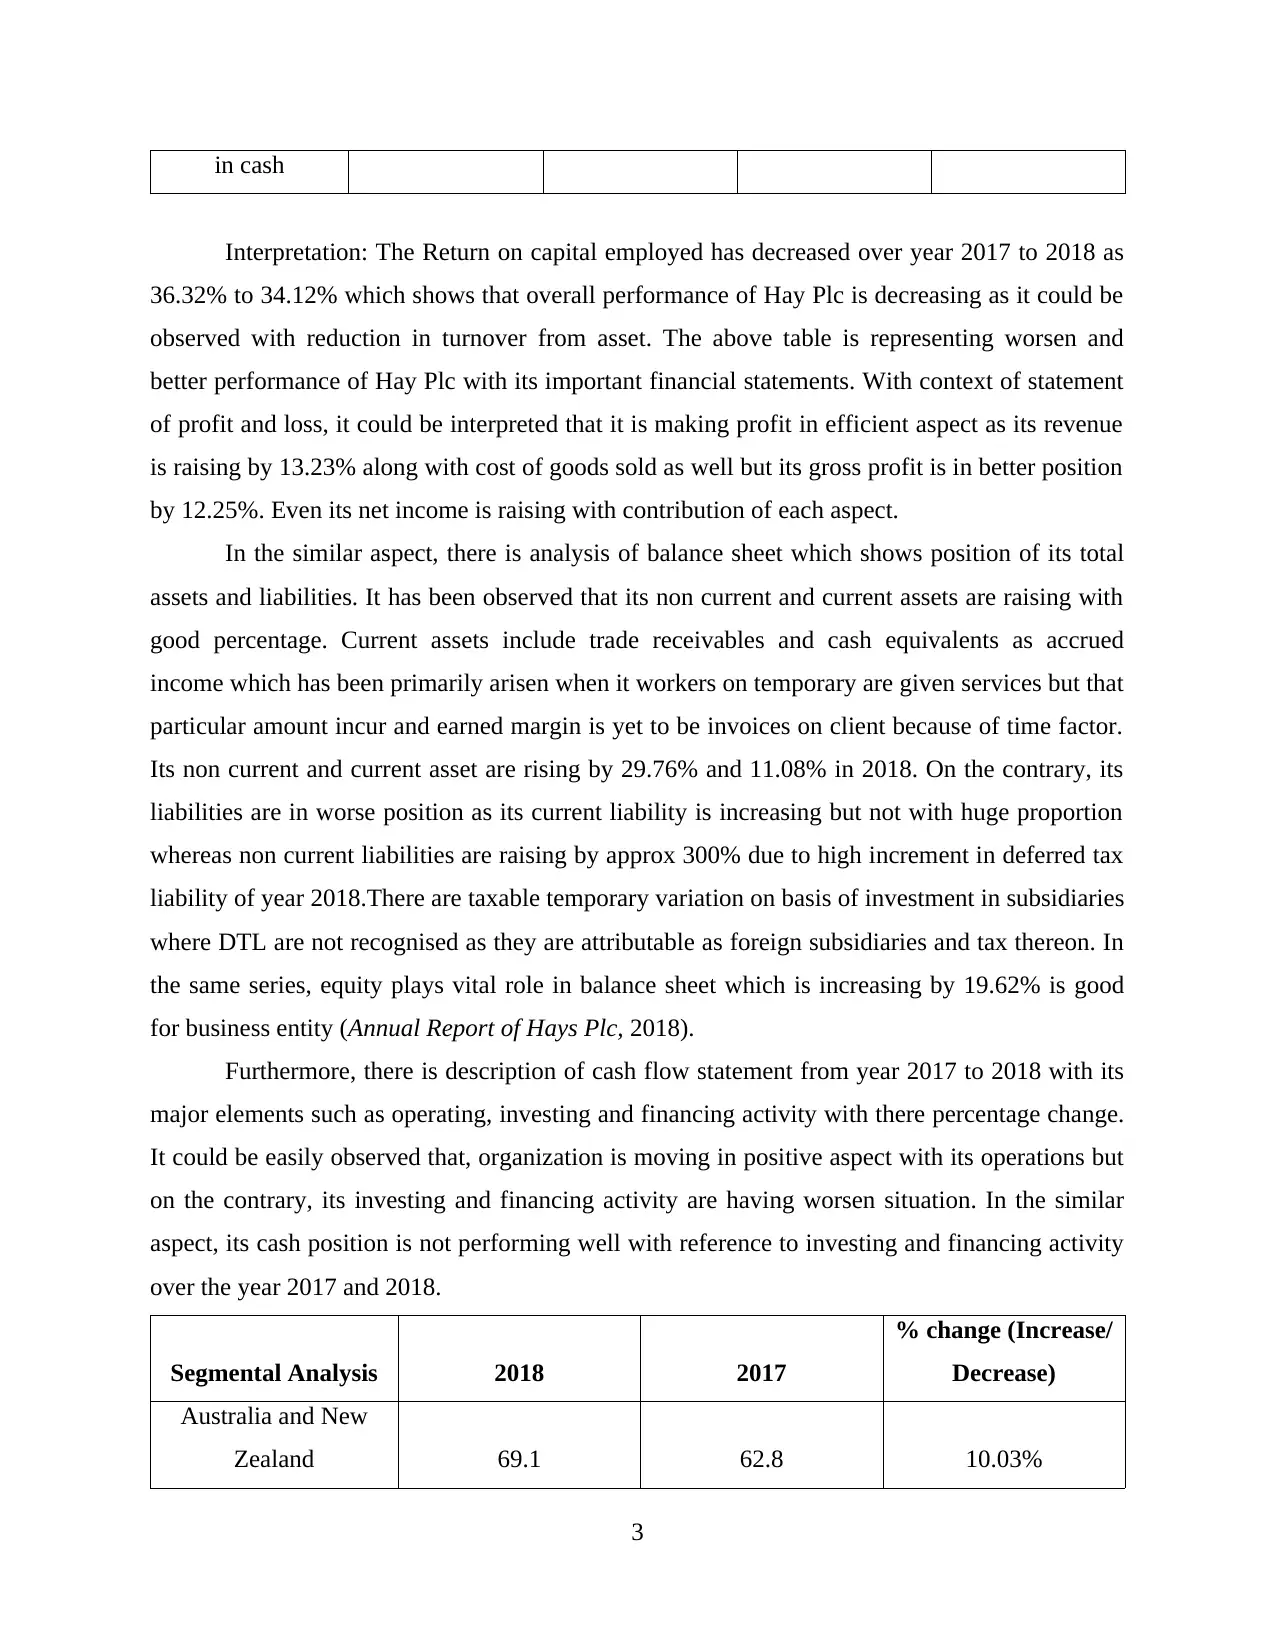
Interpretation: The Return on capital employed has decreased over year 2017 to 2018 as
36.32% to 34.12% which shows that overall performance of Hay Plc is decreasing as it could be
observed with reduction in turnover from asset. The above table is representing worsen and
better performance of Hay Plc with its important financial statements. With context of statement
of profit and loss, it could be interpreted that it is making profit in efficient aspect as its revenue
is raising by 13.23% along with cost of goods sold as well but its gross profit is in better position
by 12.25%. Even its net income is raising with contribution of each aspect.
In the similar aspect, there is analysis of balance sheet which shows position of its total
assets and liabilities. It has been observed that its non current and current assets are raising with
good percentage. Current assets include trade receivables and cash equivalents as accrued
income which has been primarily arisen when it workers on temporary are given services but that
particular amount incur and earned margin is yet to be invoices on client because of time factor.
Its non current and current asset are rising by 29.76% and 11.08% in 2018. On the contrary, its
liabilities are in worse position as its current liability is increasing but not with huge proportion
whereas non current liabilities are raising by approx 300% due to high increment in deferred tax
liability of year 2018.There are taxable temporary variation on basis of investment in subsidiaries
where DTL are not recognised as they are attributable as foreign subsidiaries and tax thereon. In
the same series, equity plays vital role in balance sheet which is increasing by 19.62% is good
for business entity (Annual Report of Hays Plc, 2018).
Furthermore, there is description of cash flow statement from year 2017 to 2018 with its
major elements such as operating, investing and financing activity with there percentage change.
It could be easily observed that, organization is moving in positive aspect with its operations but
on the contrary, its investing and financing activity are having worsen situation. In the similar
aspect, its cash position is not performing well with reference to investing and financing activity
over the year 2017 and 2018.
Segmental Analysis 2018 2017
% change (Increase/
Decrease)
Australia and New
Zealand 69.1 62.8 10.03%
3
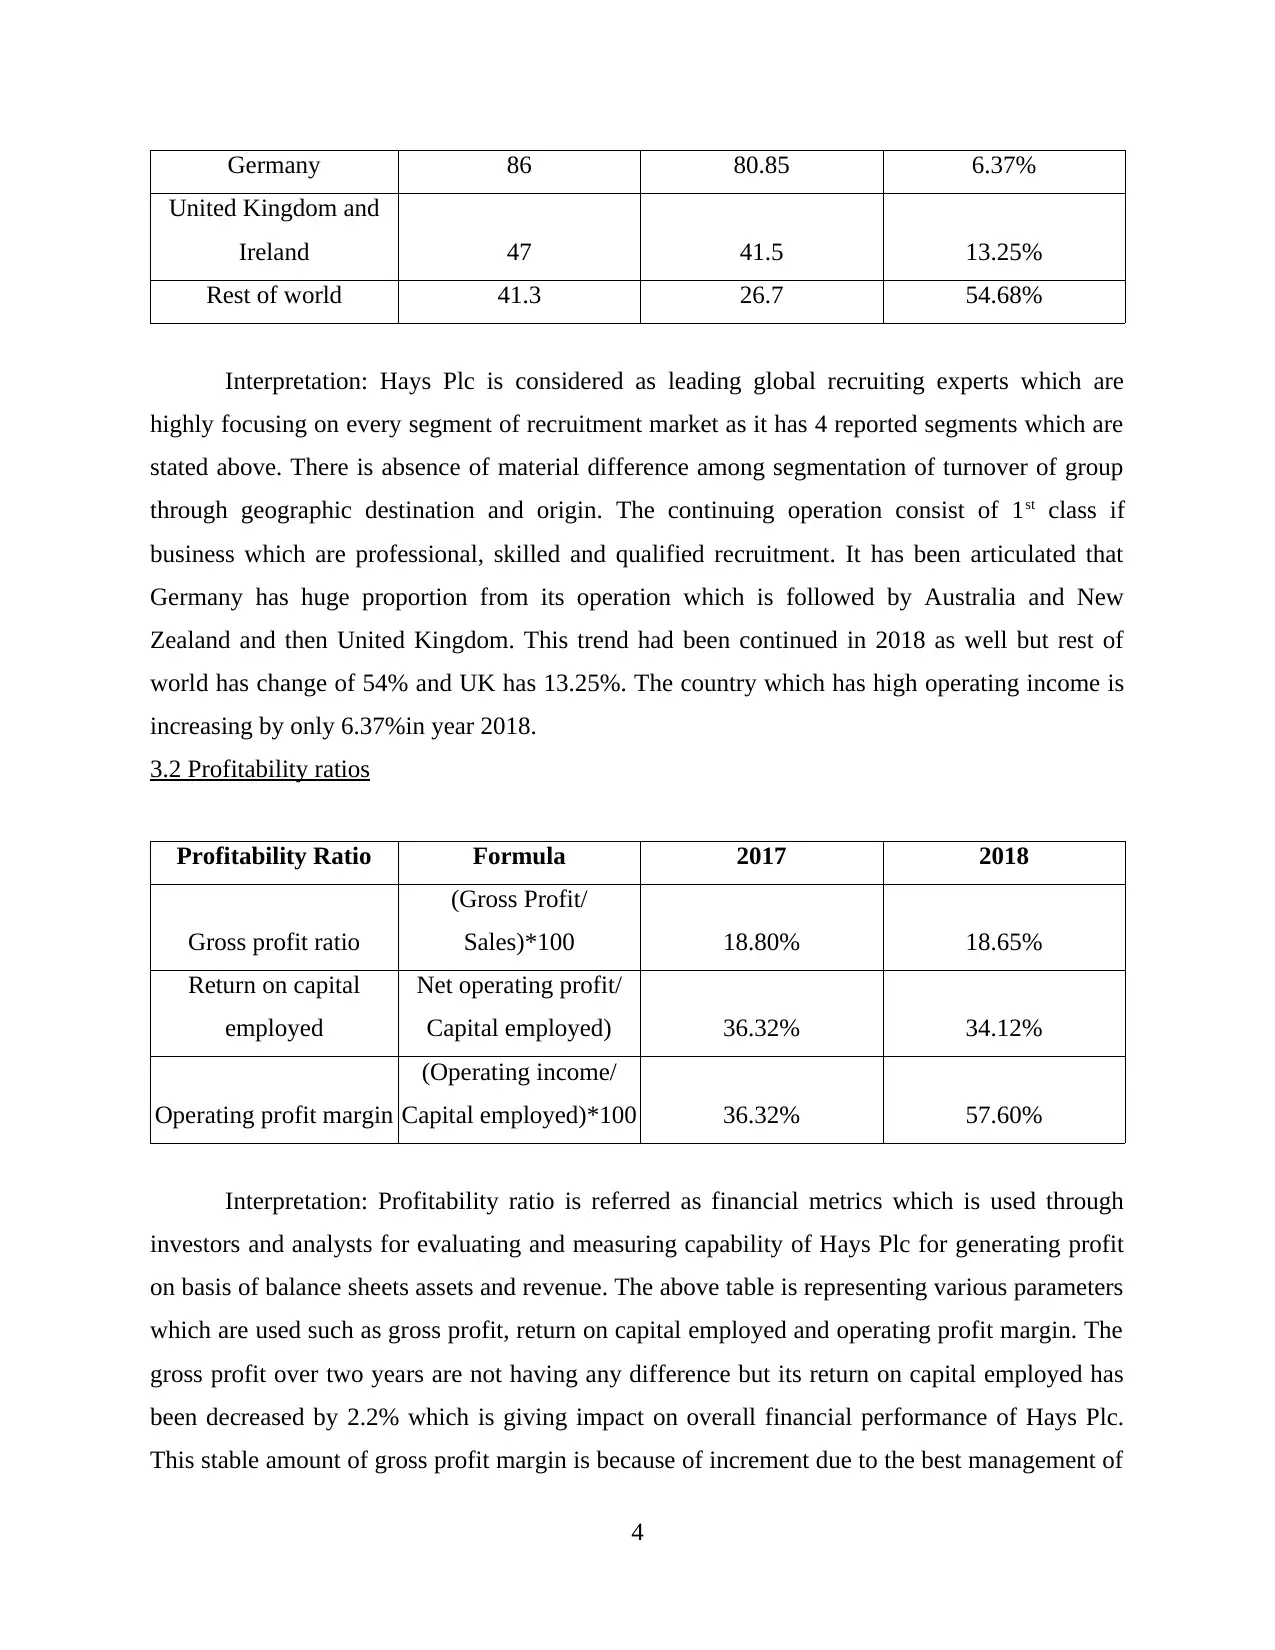
Germany 86 80.85 6.37%
United Kingdom and
Ireland 47 41.5 13.25%
Rest of world 41.3 26.7 54.68%
Interpretation: Hays Plc is considered as leading global recruiting experts which are
highly focusing on every segment of recruitment market as it has 4 reported segments which are
stated above. There is absence of material difference among segmentation of turnover of group
through geographic destination and origin. The continuing operation consist of 1st class if
business which are professional, skilled and qualified recruitment. It has been articulated that
Germany has huge proportion from its operation which is followed by Australia and New
Zealand and then United Kingdom. This trend had been continued in 2018 as well but rest of
world has change of 54% and UK has 13.25%. The country which has high operating income is
increasing by only 6.37%in year 2018.
3.2 Profitability ratios
Profitability Ratio Formula 2017 2018
Gross profit ratio
(Gross Profit/
Sales)*100 18.80% 18.65%
Return on capital
employed
Net operating profit/
Capital employed) 36.32% 34.12%
Operating profit margin
(Operating income/
Capital employed)*100 36.32% 57.60%
Interpretation: Profitability ratio is referred as financial metrics which is used through
investors and analysts for evaluating and measuring capability of Hays Plc for generating profit
on basis of balance sheets assets and revenue. The above table is representing various parameters
which are used such as gross profit, return on capital employed and operating profit margin. The
gross profit over two years are not having any difference but its return on capital employed has
been decreased by 2.2% which is giving impact on overall financial performance of Hays Plc.
This stable amount of gross profit margin is because of increment due to the best management of
4
⊘ This is a preview!⊘
Do you want full access?
Subscribe today to unlock all pages.
Trusted by 1+ million students worldwide
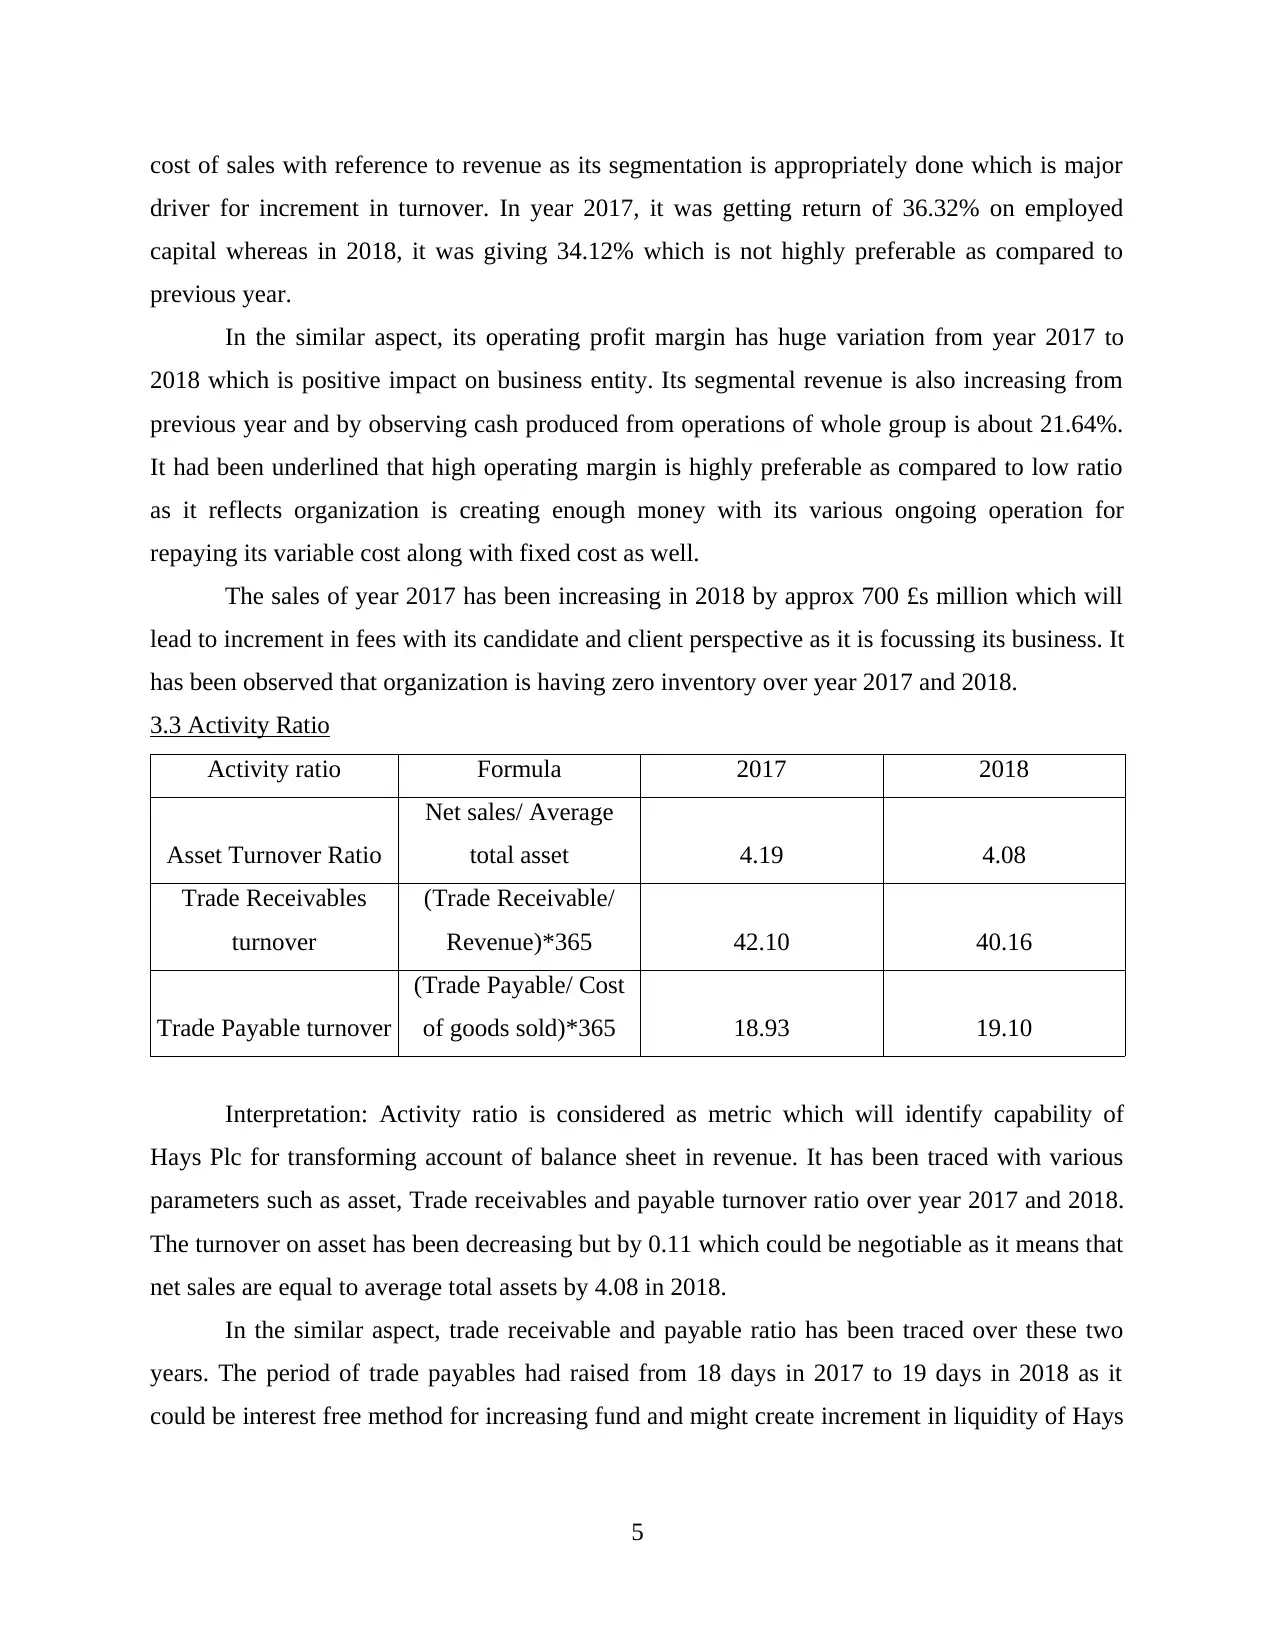
cost of sales with reference to revenue as its segmentation is appropriately done which is major
driver for increment in turnover. In year 2017, it was getting return of 36.32% on employed
capital whereas in 2018, it was giving 34.12% which is not highly preferable as compared to
previous year.
In the similar aspect, its operating profit margin has huge variation from year 2017 to
2018 which is positive impact on business entity. Its segmental revenue is also increasing from
previous year and by observing cash produced from operations of whole group is about 21.64%.
It had been underlined that high operating margin is highly preferable as compared to low ratio
as it reflects organization is creating enough money with its various ongoing operation for
repaying its variable cost along with fixed cost as well.
The sales of year 2017 has been increasing in 2018 by approx 700 £s million which will
lead to increment in fees with its candidate and client perspective as it is focussing its business. It
has been observed that organization is having zero inventory over year 2017 and 2018.
3.3 Activity Ratio
Activity ratio Formula 2017 2018
Asset Turnover Ratio
Net sales/ Average
total asset 4.19 4.08
Trade Receivables
turnover
(Trade Receivable/
Revenue)*365 42.10 40.16
Trade Payable turnover
(Trade Payable/ Cost
of goods sold)*365 18.93 19.10
Interpretation: Activity ratio is considered as metric which will identify capability of
Hays Plc for transforming account of balance sheet in revenue. It has been traced with various
parameters such as asset, Trade receivables and payable turnover ratio over year 2017 and 2018.
The turnover on asset has been decreasing but by 0.11 which could be negotiable as it means that
net sales are equal to average total assets by 4.08 in 2018.
In the similar aspect, trade receivable and payable ratio has been traced over these two
years. The period of trade payables had raised from 18 days in 2017 to 19 days in 2018 as it
could be interest free method for increasing fund and might create increment in liquidity of Hays
5
Paraphrase This Document
Need a fresh take? Get an instant paraphrase of this document with our AI Paraphraser
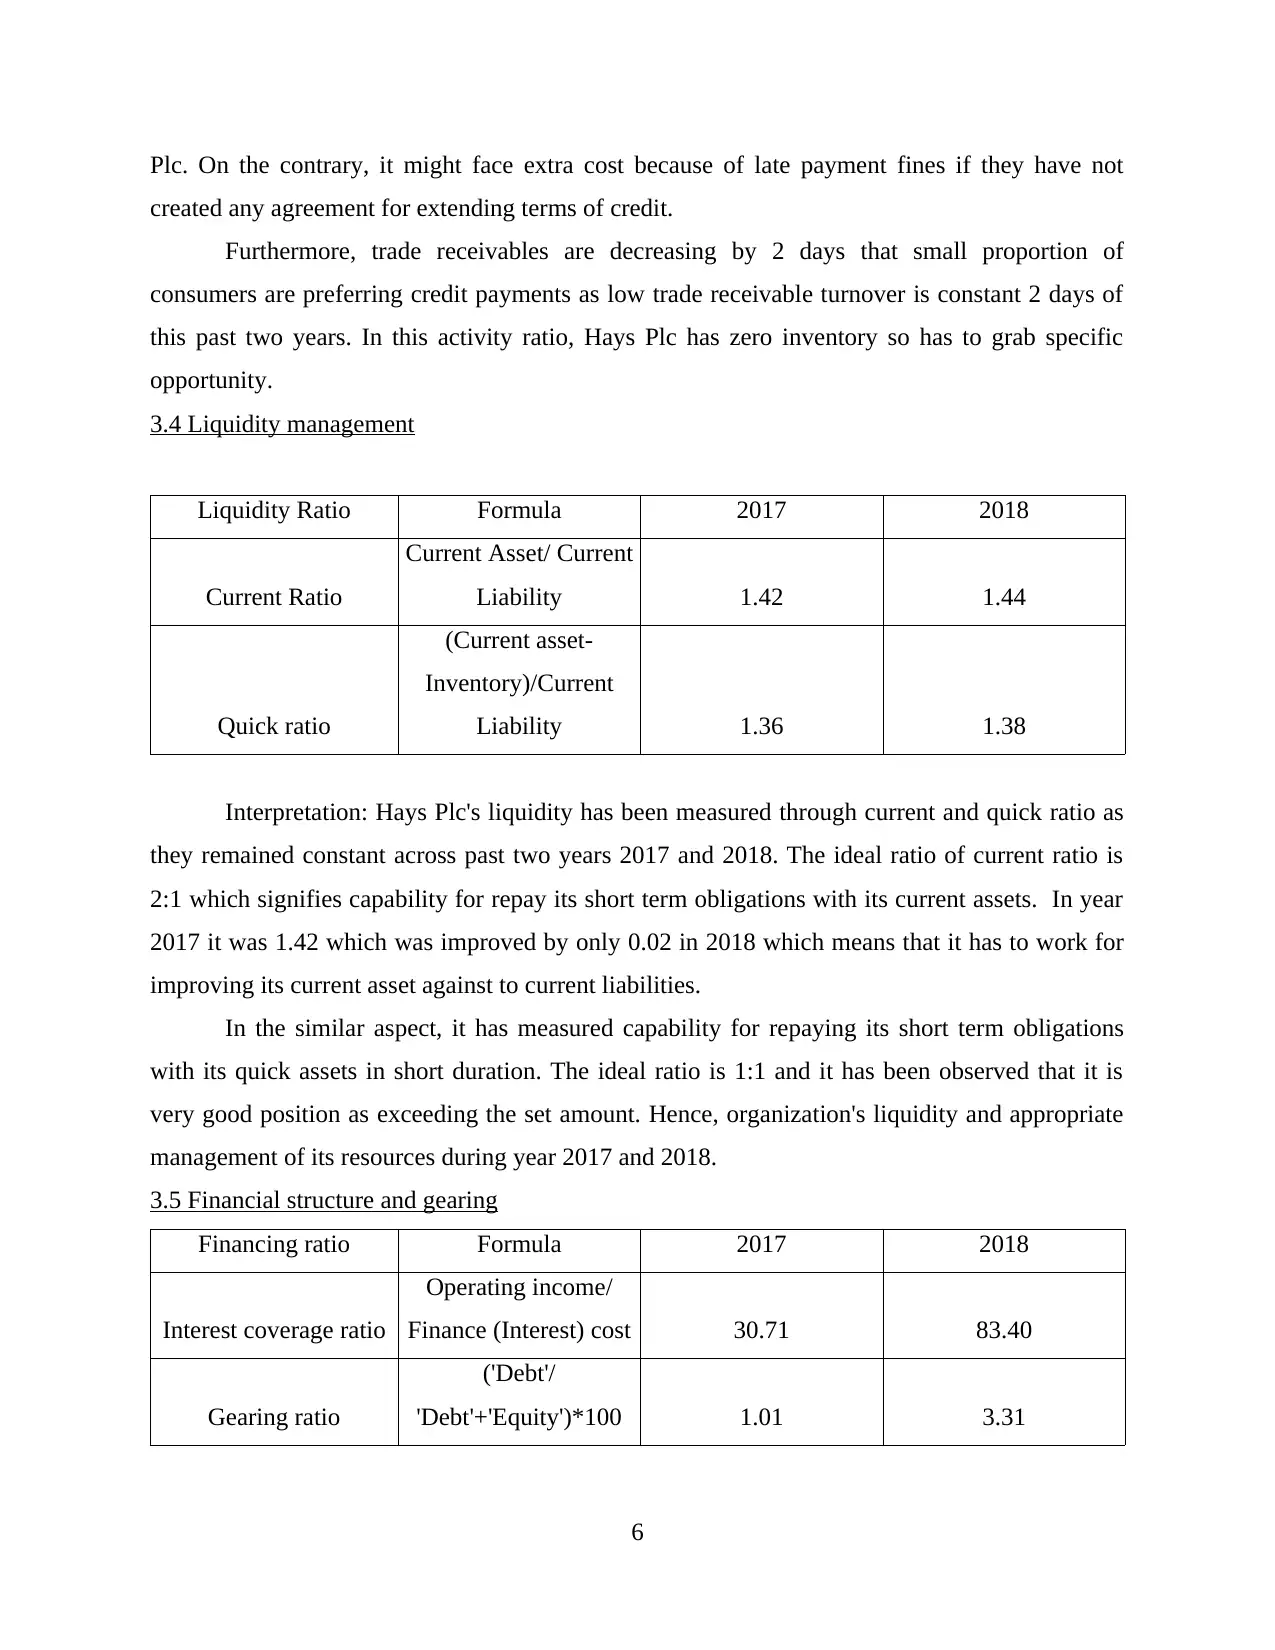
Plc. On the contrary, it might face extra cost because of late payment fines if they have not
created any agreement for extending terms of credit.
Furthermore, trade receivables are decreasing by 2 days that small proportion of
consumers are preferring credit payments as low trade receivable turnover is constant 2 days of
this past two years. In this activity ratio, Hays Plc has zero inventory so has to grab specific
opportunity.
3.4 Liquidity management
Liquidity Ratio Formula 2017 2018
Current Ratio
Current Asset/ Current
Liability 1.42 1.44
Quick ratio
(Current asset-
Inventory)/Current
Liability 1.36 1.38
Interpretation: Hays Plc's liquidity has been measured through current and quick ratio as
they remained constant across past two years 2017 and 2018. The ideal ratio of current ratio is
2:1 which signifies capability for repay its short term obligations with its current assets. In year
2017 it was 1.42 which was improved by only 0.02 in 2018 which means that it has to work for
improving its current asset against to current liabilities.
In the similar aspect, it has measured capability for repaying its short term obligations
with its quick assets in short duration. The ideal ratio is 1:1 and it has been observed that it is
very good position as exceeding the set amount. Hence, organization's liquidity and appropriate
management of its resources during year 2017 and 2018.
3.5 Financial structure and gearing
Financing ratio Formula 2017 2018
Interest coverage ratio
Operating income/
Finance (Interest) cost 30.71 83.40
Gearing ratio
('Debt'/
'Debt'+'Equity')*100 1.01 3.31
6
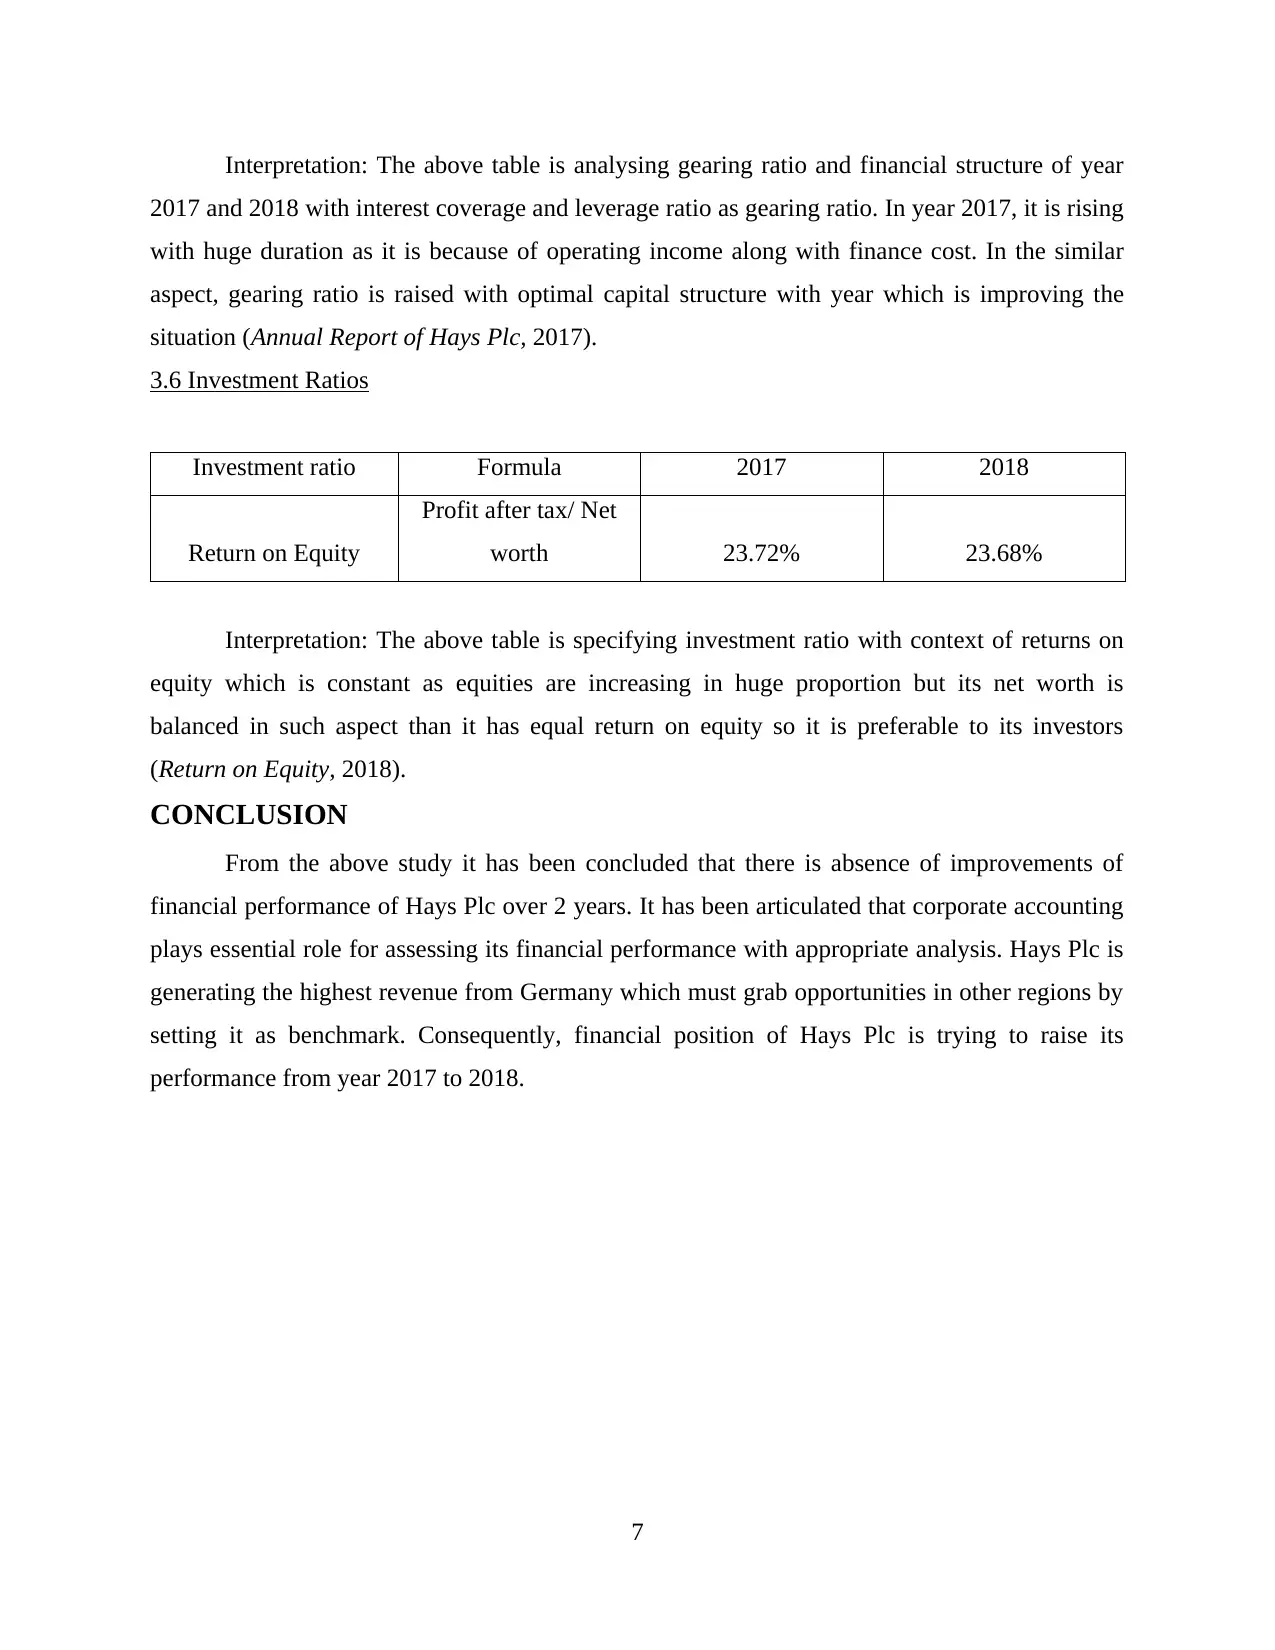
Interpretation: The above table is analysing gearing ratio and financial structure of year
2017 and 2018 with interest coverage and leverage ratio as gearing ratio. In year 2017, it is rising
with huge duration as it is because of operating income along with finance cost. In the similar
aspect, gearing ratio is raised with optimal capital structure with year which is improving the
situation (Annual Report of Hays Plc, 2017).
3.6 Investment Ratios
Investment ratio Formula 2017 2018
Return on Equity
Profit after tax/ Net
worth 23.72% 23.68%
Interpretation: The above table is specifying investment ratio with context of returns on
equity which is constant as equities are increasing in huge proportion but its net worth is
balanced in such aspect than it has equal return on equity so it is preferable to its investors
(Return on Equity, 2018).
CONCLUSION
From the above study it has been concluded that there is absence of improvements of
financial performance of Hays Plc over 2 years. It has been articulated that corporate accounting
plays essential role for assessing its financial performance with appropriate analysis. Hays Plc is
generating the highest revenue from Germany which must grab opportunities in other regions by
setting it as benchmark. Consequently, financial position of Hays Plc is trying to raise its
performance from year 2017 to 2018.
7
⊘ This is a preview!⊘
Do you want full access?
Subscribe today to unlock all pages.
Trusted by 1+ million students worldwide
REFERENCES
ONLINE
Annual Report of Hays Plc. 2017. [Online]. Available through
<https://www.haysplc.com/investors/annual-report-2017>.
Annual Report of Hays Plc. 2018. [Online]. Available through
<https://www.haysplc.com/~/media/Files/H/Hays/annual-reports/ar-2018/ar-2018.pdf>.
Hays plc (HAS.l). 2018. [Online]. Available through <https://finance.yahoo.com/quote/HAS.L/>.
Hays PLC. 2018. [Online]. Available through
<https://markets.ft.com/data/equities/tearsheet/summary?s=HAS:LSE>.
Return on Equity. 2018. [Online]. Available through
<https://www.myaccountingcourse.com/financial-ratios/return-on-equity-ratio>.
8
Paraphrase This Document
Need a fresh take? Get an instant paraphrase of this document with our AI Paraphraser
APPENDIX
Ration Analysis
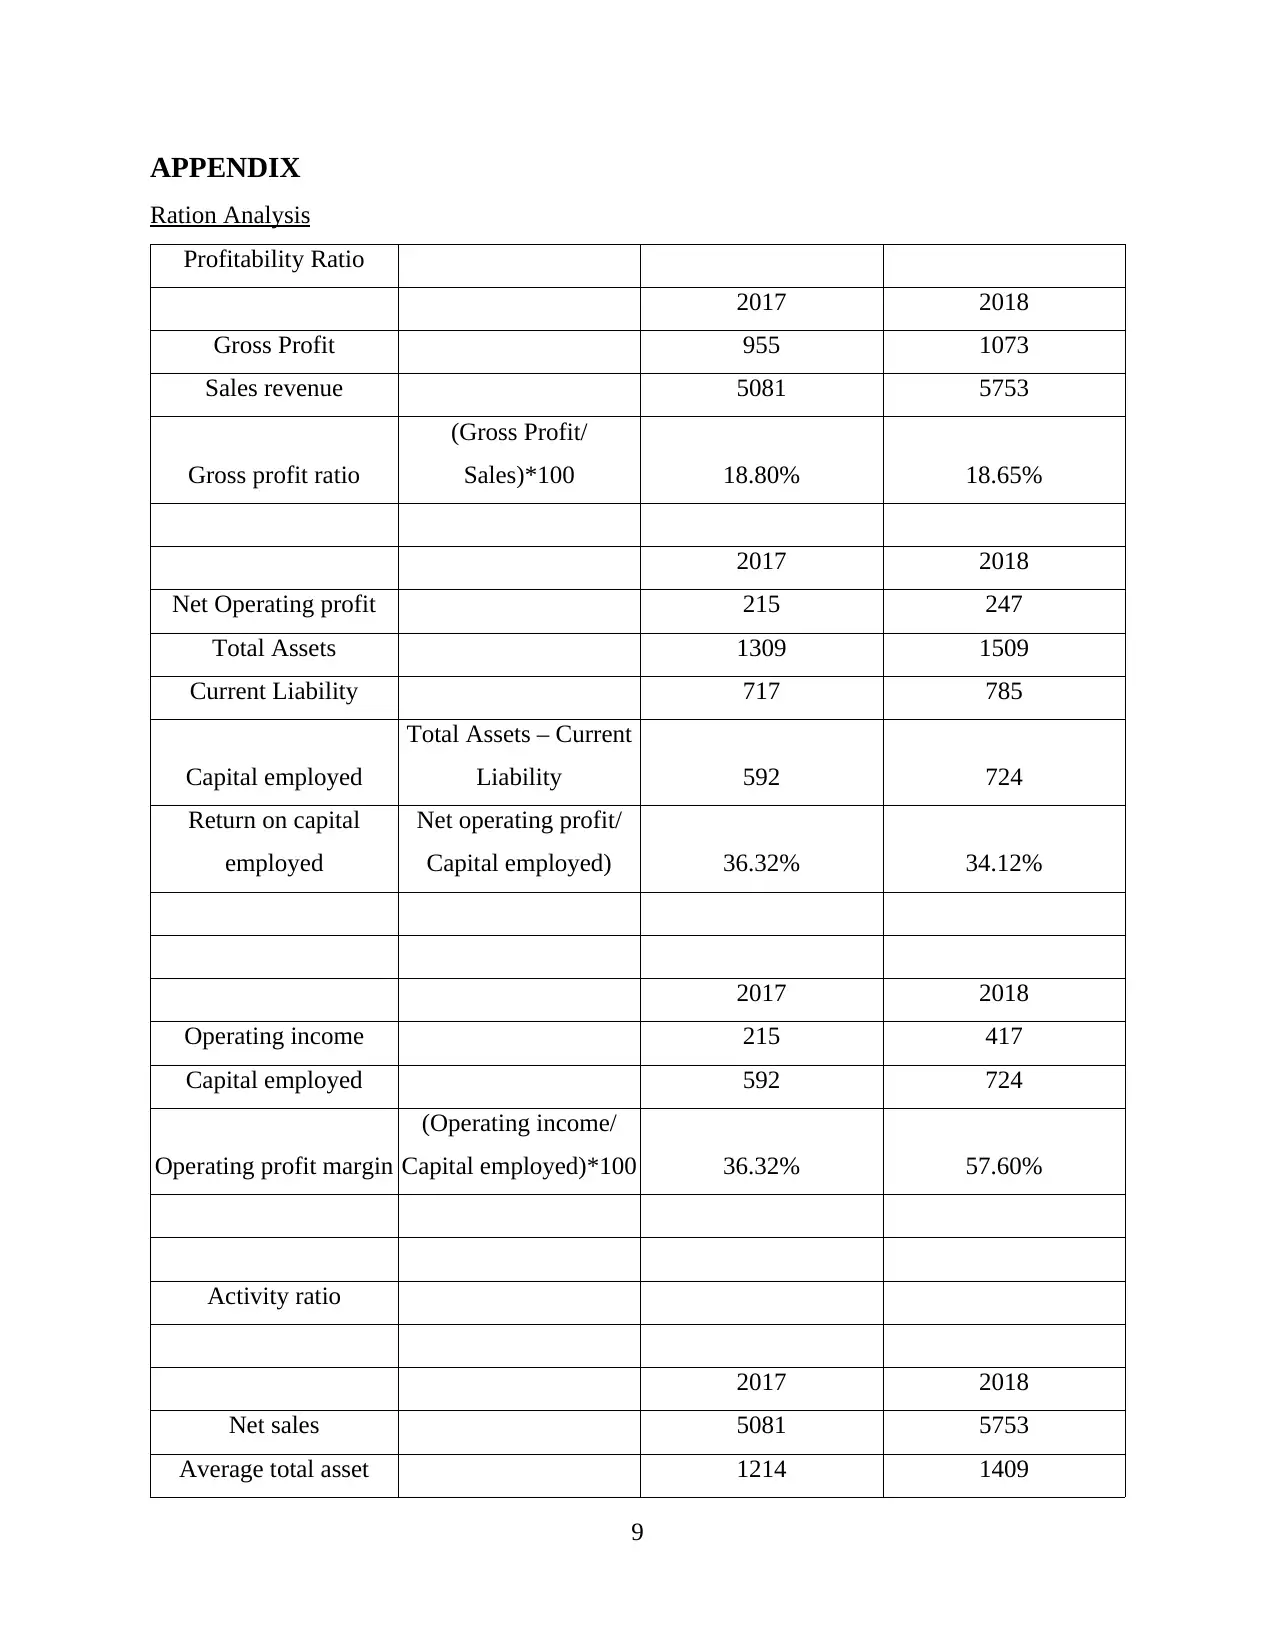
Profitability Ratio
2017 2018
Gross Profit 955 1073
Sales revenue 5081 5753
Gross profit ratio
(Gross Profit/
Sales)*100 18.80% 18.65%
2017 2018
Net Operating profit 215 247
Total Assets 1309 1509
Current Liability 717 785
Capital employed
Total Assets – Current
Liability 592 724
Return on capital
employed
Net operating profit/
Capital employed) 36.32% 34.12%
2017 2018
Operating income 215 417
Capital employed 592 724
Operating profit margin
(Operating income/
Capital employed)*100 36.32% 57.60%
Activity ratio
2017 2018
Net sales 5081 5753
Average total asset 1214 1409
9
Ration Analysis
Profitability Ratio
2017 2018
Gross Profit 955 1073
Sales revenue 5081 5753
Gross profit ratio
(Gross Profit/
Sales)*100 18.80% 18.65%
2017 2018
Net Operating profit 215 247
Total Assets 1309 1509
Current Liability 717 785
Capital employed
Total Assets – Current
Liability 592 724
Return on capital
employed
Net operating profit/
Capital employed) 36.32% 34.12%
2017 2018
Operating income 215 417
Capital employed 592 724
Operating profit margin
(Operating income/
Capital employed)*100 36.32% 57.60%
Activity ratio
2017 2018
Net sales 5081 5753
Average total asset 1214 1409
9
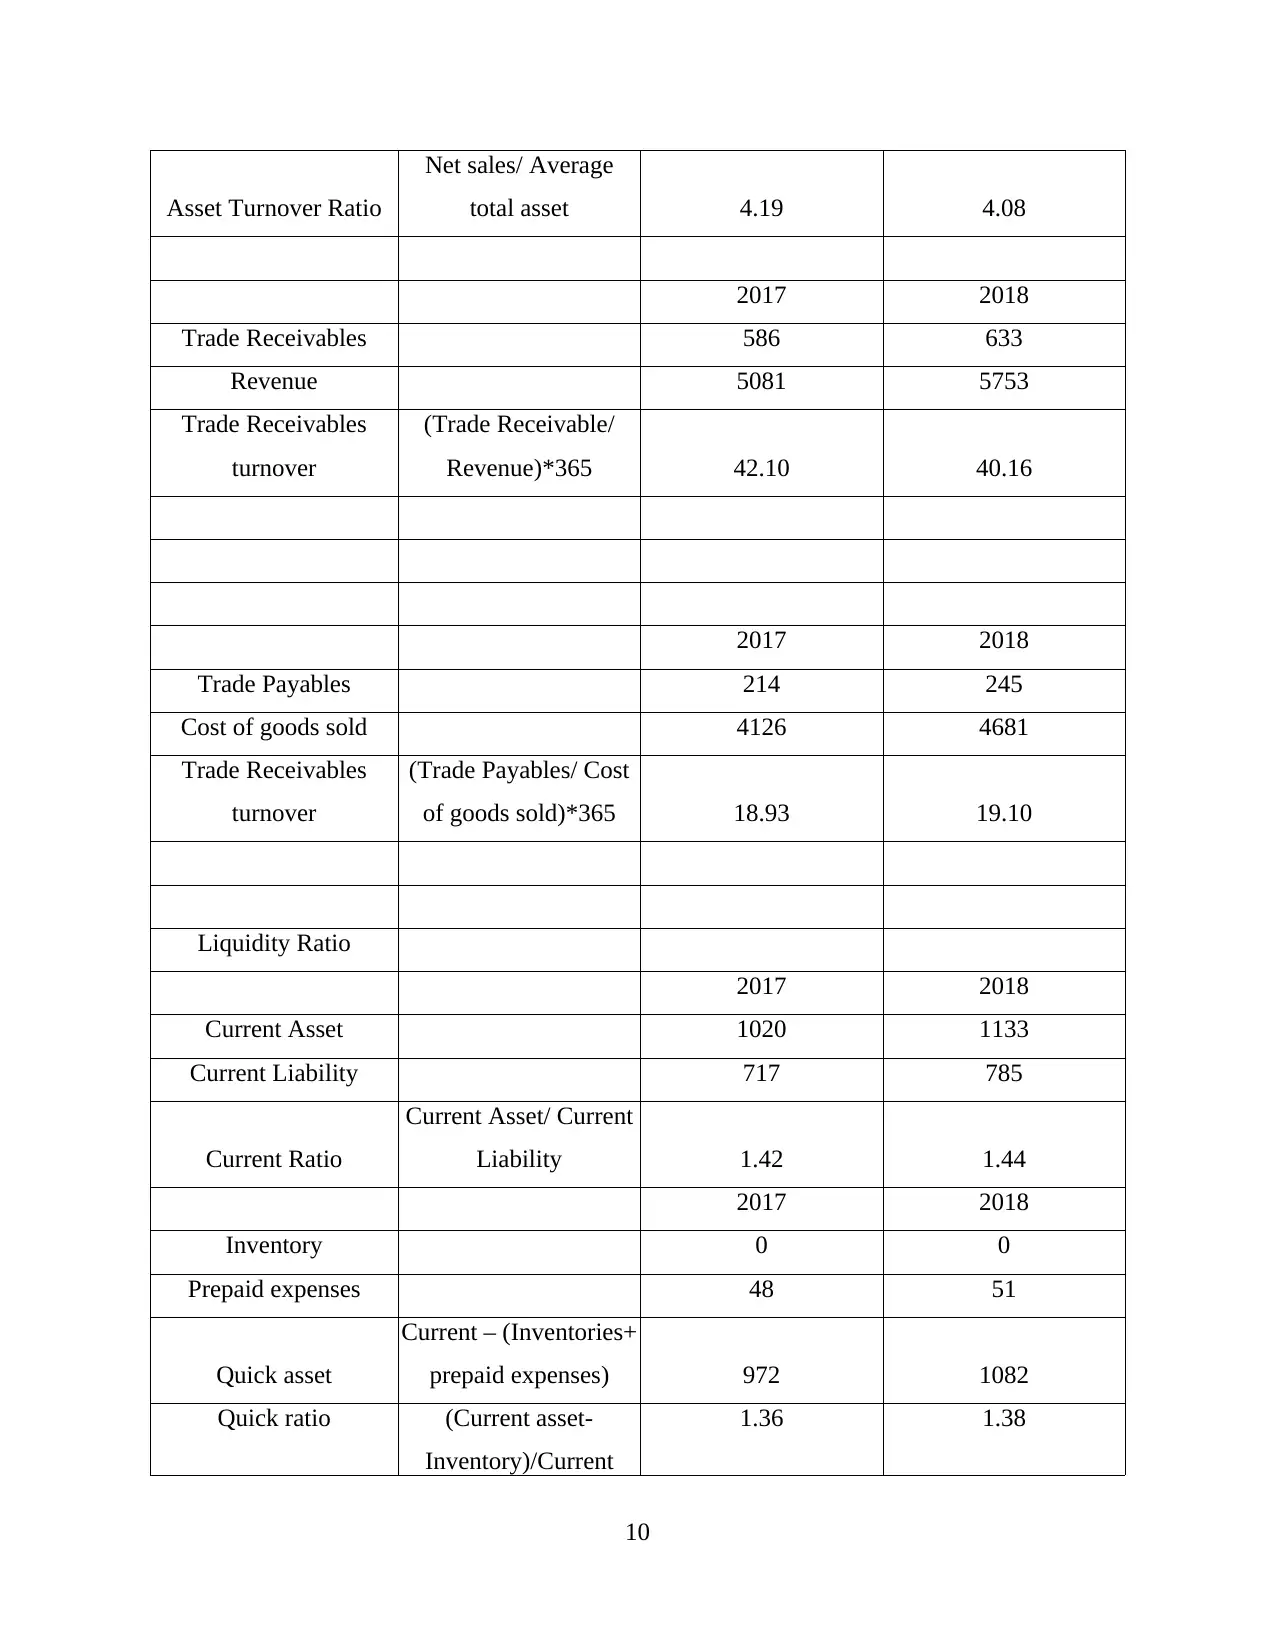
Asset Turnover Ratio
Net sales/ Average
total asset 4.19 4.08
2017 2018
Trade Receivables 586 633
Revenue 5081 5753
Trade Receivables
turnover
(Trade Receivable/
Revenue)*365 42.10 40.16
2017 2018
Trade Payables 214 245
Cost of goods sold 4126 4681
Trade Receivables
turnover
(Trade Payables/ Cost
of goods sold)*365 18.93 19.10
Liquidity Ratio
2017 2018
Current Asset 1020 1133
Current Liability 717 785
Current Ratio
Current Asset/ Current
Liability 1.42 1.44
2017 2018
Inventory 0 0
Prepaid expenses 48 51
Quick asset
Current – (Inventories+
prepaid expenses) 972 1082
Quick ratio (Current asset-
Inventory)/Current
1.36 1.38
10
⊘ This is a preview!⊘
Do you want full access?
Subscribe today to unlock all pages.
Trusted by 1+ million students worldwide
1 out of 13
Related Documents


Your All-in-One AI-Powered Toolkit for Academic Success.
+13062052269
info@desklib.com
Available 24*7 on WhatsApp / Email
![[object Object]](/_next/static/media/star-bottom.7253800d.svg)
Unlock your academic potential
Copyright © 2020–2026 A2Z Services. All Rights Reserved. Developed and managed by ZUCOL.