HND Business Management: Business Decision Making Report Analysis
VerifiedAdded on 2020/10/22
|16
|3686
|298
Report
AI Summary
This report analyzes business decision-making for Hayward Home-style, a bespoke kitchen manufacturer. It begins with descriptive statistics, including a spreadsheet, histograms, and interquartile range analysis of customer data, assessing age, spending, and income. Task 2 outlines a plan for collecting primary and secondary data in a new target market, detailing survey methodology, sampling frames, and questionnaire design. Task 3 focuses on financial analysis, calculating the payback period (both standard and discounted) and net present value of a proposed investment. The report concludes with a Gantt chart to ensure timely project delivery. The analysis uses both primary and secondary data sources and includes a detailed financial assessment to inform strategic business decisions. The report helps in understanding the important aspects of business decision making.

BUSINESS
DECISION MAKING
DECISION MAKING
Paraphrase This Document
Need a fresh take? Get an instant paraphrase of this document with our AI Paraphraser
TABLE OF CONTENTS
INTRODUCTION...........................................................................................................................1
TASK 1............................................................................................................................................1
(a) Framing spreadsheet for descriptive statistics.......................................................................1
Presenting histograms of distribution of age and spend with median income interquartile
range............................................................................................................................................2
Interquartile range of annual income..........................................................................................3
(b) Preparing short presentation on basis of its findings.............................................................3
TASK 2............................................................................................................................................5
(a) Formal plan for conducting robust sample of various potential customers in new target
market..........................................................................................................................................5
(b) Secondary sources.................................................................................................................5
(c) Survey Methodology and sampling Frame............................................................................6
(d) Questionnaire.........................................................................................................................6
TASK 3............................................................................................................................................7
(a) Analysis of payback Period...................................................................................................8
(b) Analysis of net present value.................................................................................................9
(c) Decision based on financial criteria.....................................................................................11
(d) Presenting Gantt chart along with critical pathway for setting processes could be delivered
on time.......................................................................................................................................12
CONCLUSION..............................................................................................................................13
REFERENCES..............................................................................................................................15
INTRODUCTION
Decision making is an important concept of every business whether it is manufacturing,
service or any industry. The organization which is leading in this present era has effectively
taken decision in context of business. This report is based on Hayward Home style which makes
bespoke kitchen in USA for its customers. The present report is creating ability for using various
sources of gathering data from both primary and secondary sources as well. There is
representation of sampling frame and survey methodology which has been adopted along with
questionnaire. Further, various range of techniques for analysing and interpreting data in an
effective manner for purpose of business will be understood. In the same series, data has been
summarised by using descriptive statistics. There is presentation of information which has been
generated in a proper format for organizational context in decision making as well.
TASK 1
(a) Framing spreadsheet for descriptive statistics
Customer ID Age Spend ($)
Annual Income
($) Gender
A 17 1602 12500 F
B 22 2691 15900 M
C 29 1456 37000 M
D 19 2530 27500 F
E 25 897 31000 M
F 16 98 12000 F
G 29 1753 41000 M
H 20 2365 16250 M
I 33 2118 32000 M
J 21 825 17500 F
K 29 1817 34000 F
L 35 1538 48000 F
M 18 1435 15000 M
N 16 37 600 F
O 26 1892 28500 M
1
⊘ This is a preview!⊘
Do you want full access?
Subscribe today to unlock all pages.
Trusted by 1+ million students worldwide
P 41 1539 56000 F
Q 28 1582 37500 F
R 31 1258 37550 M
S 25 2846 31000 F
T 27 1983 33500 M
U 22 1073 27000 M
V 28 1594 38550 F
W 24 682 23000 M
X 22 1005 21500 M
Y 35 1396 46500 F
Z 27 2173 33525 F
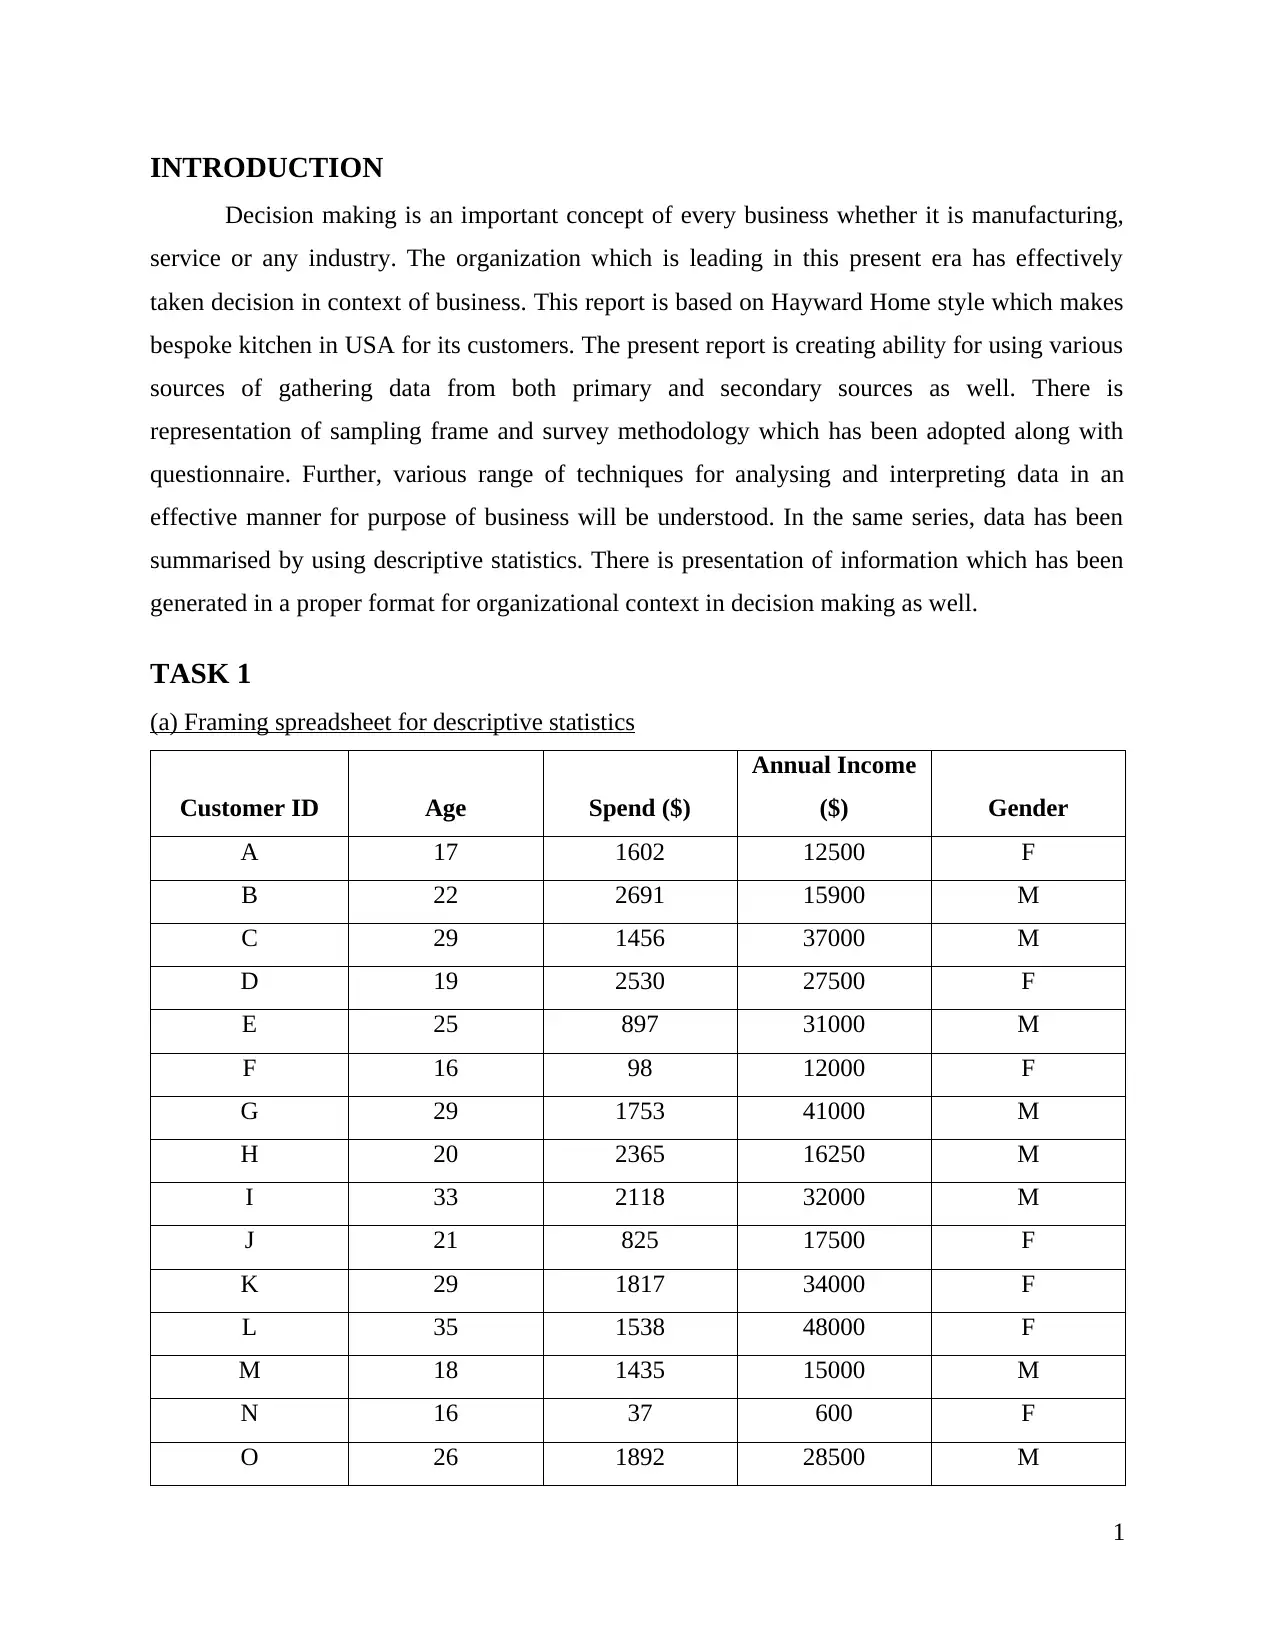
Customer ID Age Spend ($) Annual Income ($)
Mean 25.57 1545.57
standard deviation 6.33 707.04
Median 31000
Correlation coefficient
of income and spending 0.29
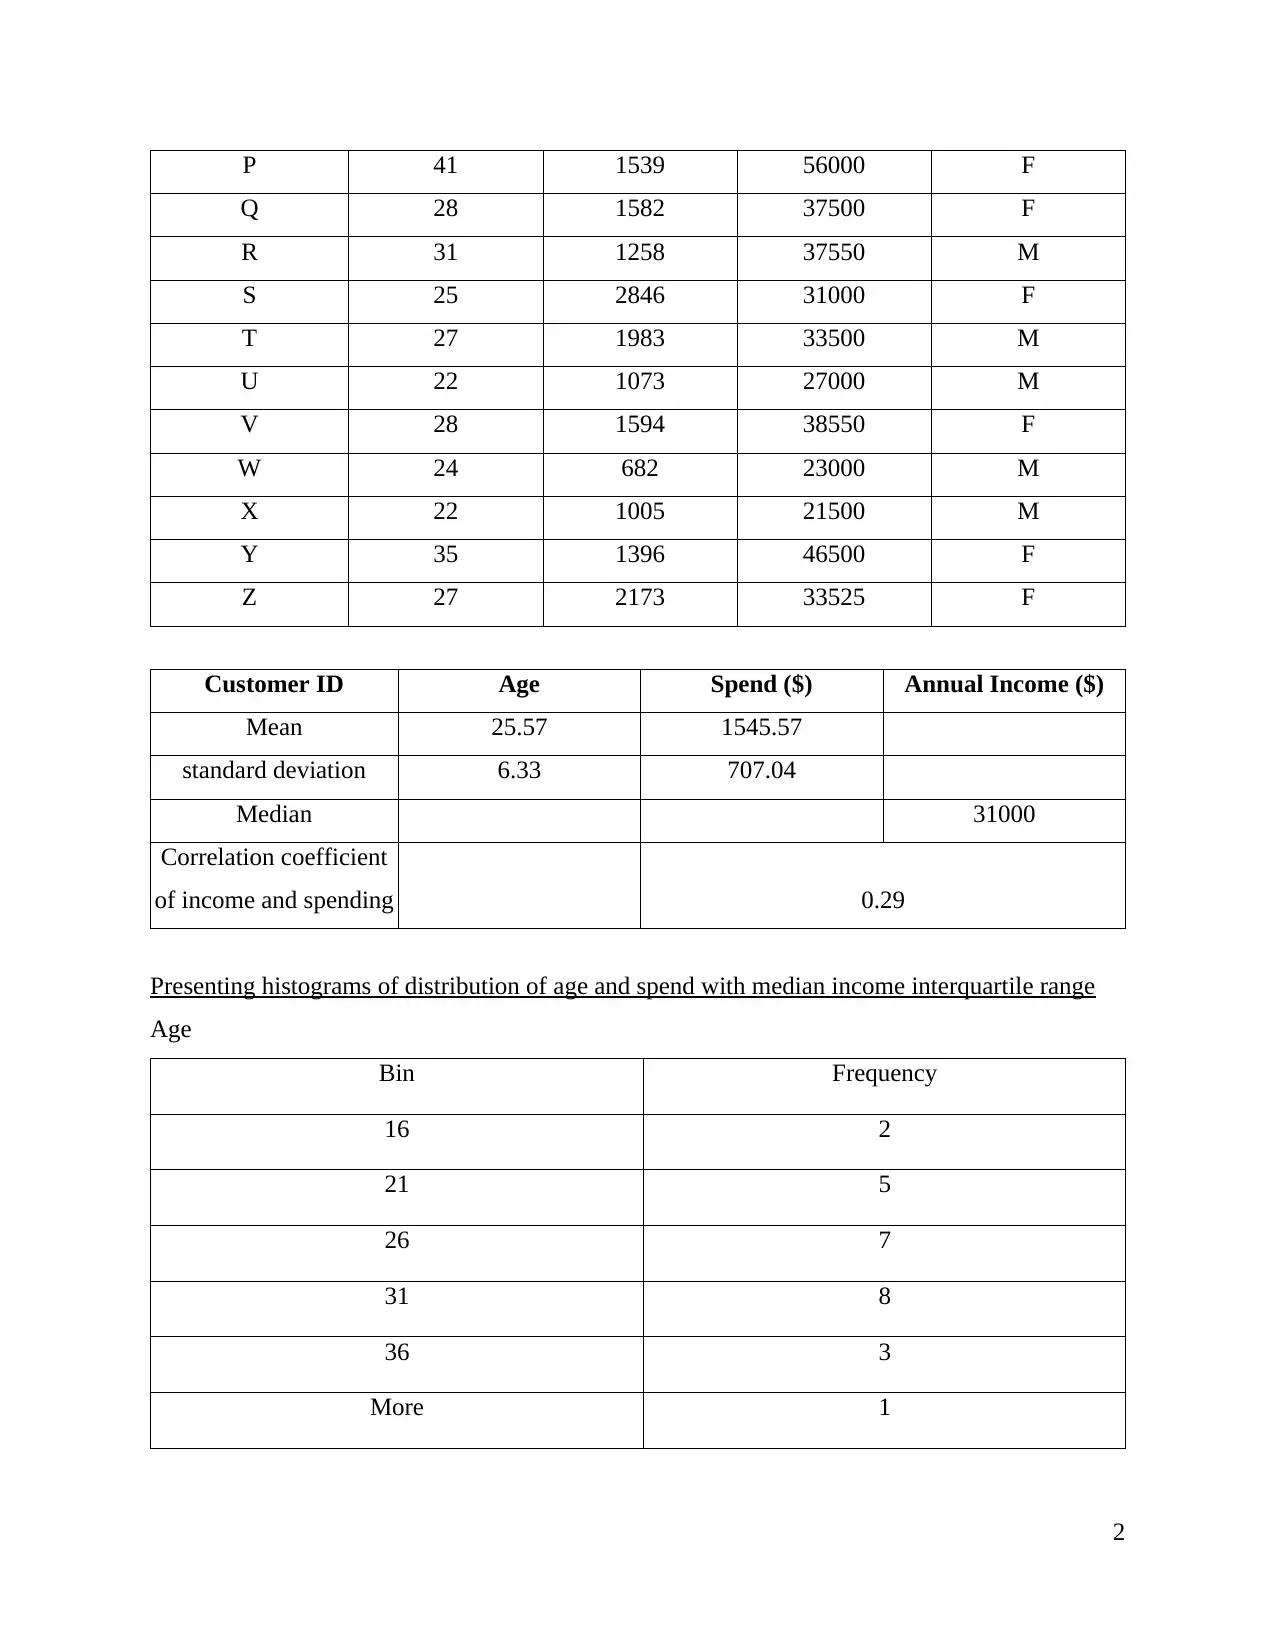
Presenting histograms of distribution of age and spend with median income interquartile range
Age
Bin Frequency
16 2
21 5
26 7
31 8
36 3
More 1
2
Q 28 1582 37500 F
R 31 1258 37550 M
S 25 2846 31000 F
T 27 1983 33500 M
U 22 1073 27000 M
V 28 1594 38550 F
W 24 682 23000 M
X 22 1005 21500 M
Y 35 1396 46500 F
Z 27 2173 33525 F
Customer ID Age Spend ($) Annual Income ($)
Mean 25.57 1545.57
standard deviation 6.33 707.04
Median 31000
Correlation coefficient
of income and spending 0.29
Presenting histograms of distribution of age and spend with median income interquartile range
Age
Bin Frequency
16 2
21 5
26 7
31 8
36 3
More 1
2
Paraphrase This Document
Need a fresh take? Get an instant paraphrase of this document with our AI Paraphraser
15/01/1900
20/01/1900
25/01/1900
30/01/1900
04/02/1900
More
0
4
8
Histogram
Column J
Bin
Frequency
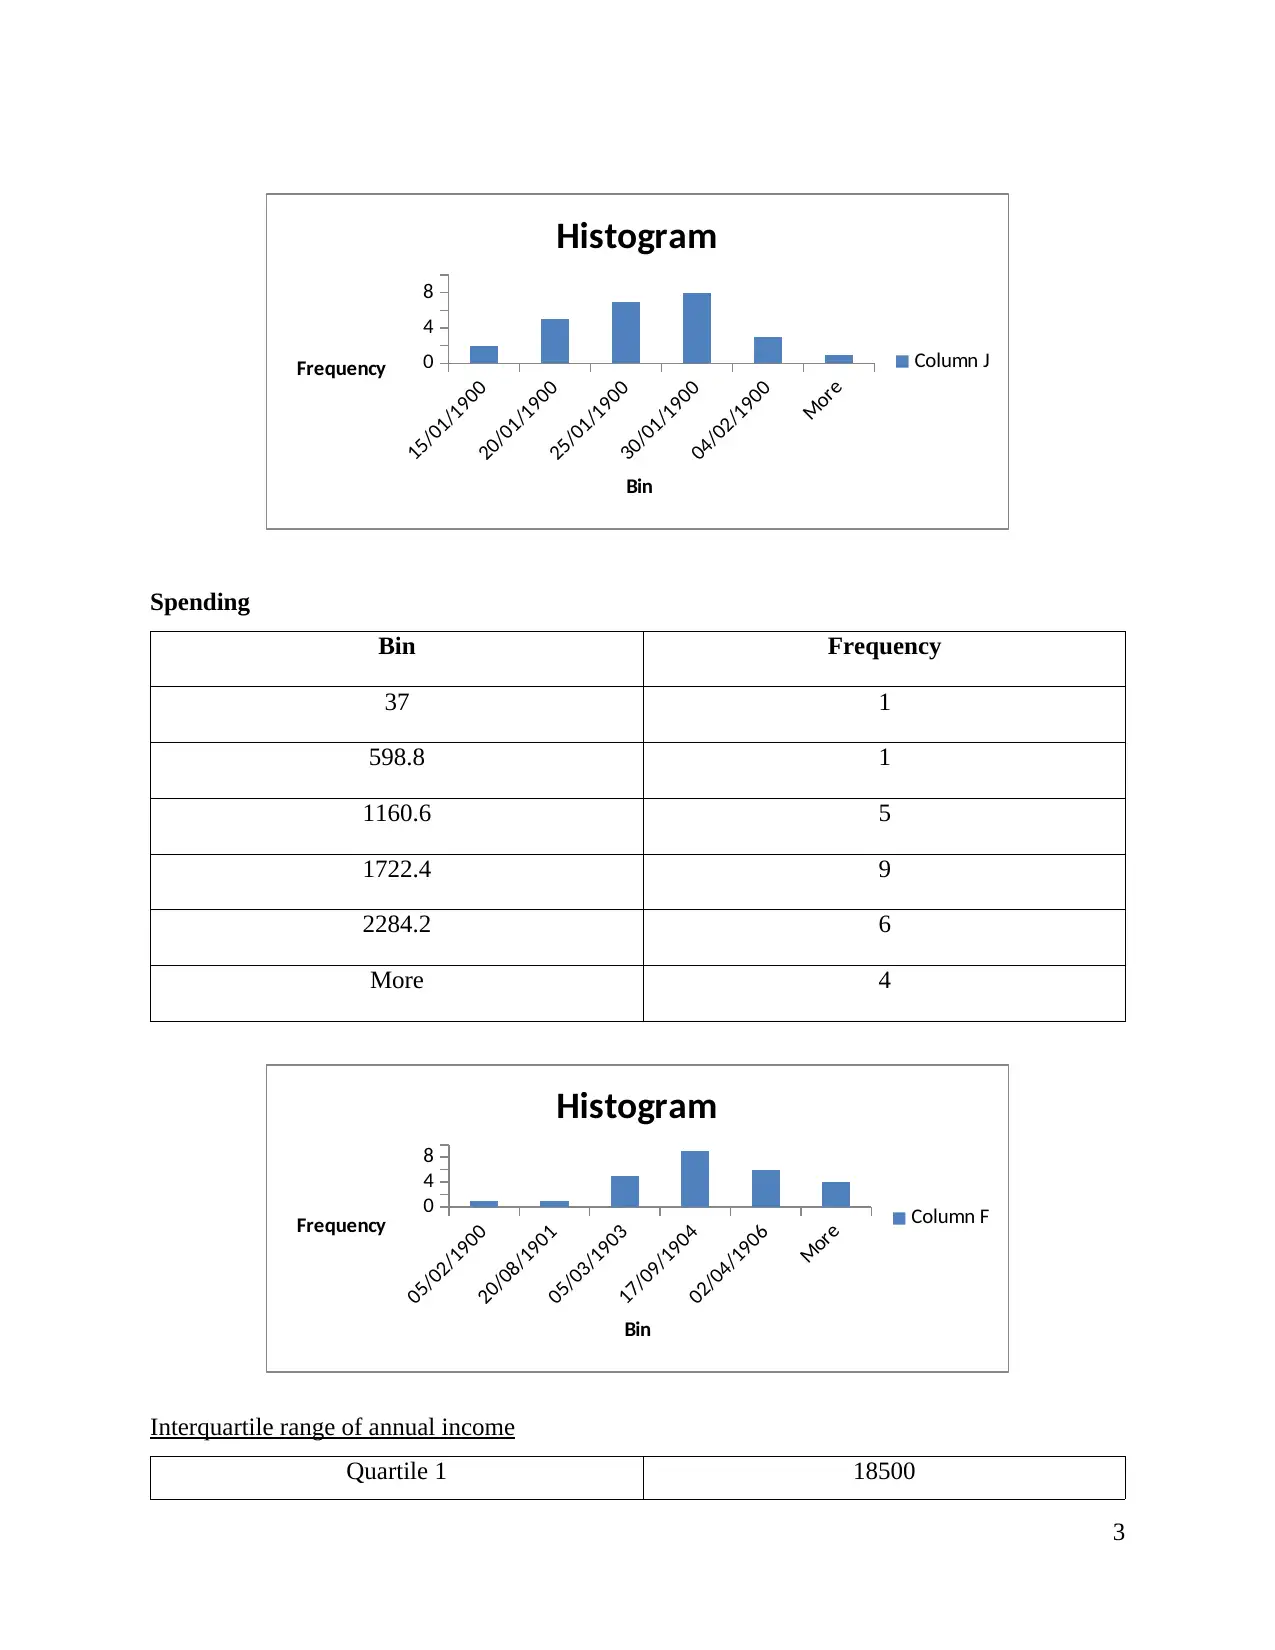
Spending
Bin Frequency
37 1
598.8 1
1160.6 5
1722.4 9
2284.2 6
More 4
05/02/1900
20/08/1901
05/03/1903
17/09/1904
02/04/1906
More
0
4
8
Histogram
Column F
Bin
Frequency
Interquartile range of annual income
Quartile 1 18500
3
20/01/1900
25/01/1900
30/01/1900
04/02/1900
More
0
4
8
Histogram
Column J
Bin
Frequency
Spending
Bin Frequency
37 1
598.8 1
1160.6 5
1722.4 9
2284.2 6
More 4
05/02/1900
20/08/1901
05/03/1903
17/09/1904
02/04/1906
More
0
4
8
Histogram
Column F
Bin
Frequency
Interquartile range of annual income
Quartile 1 18500
3
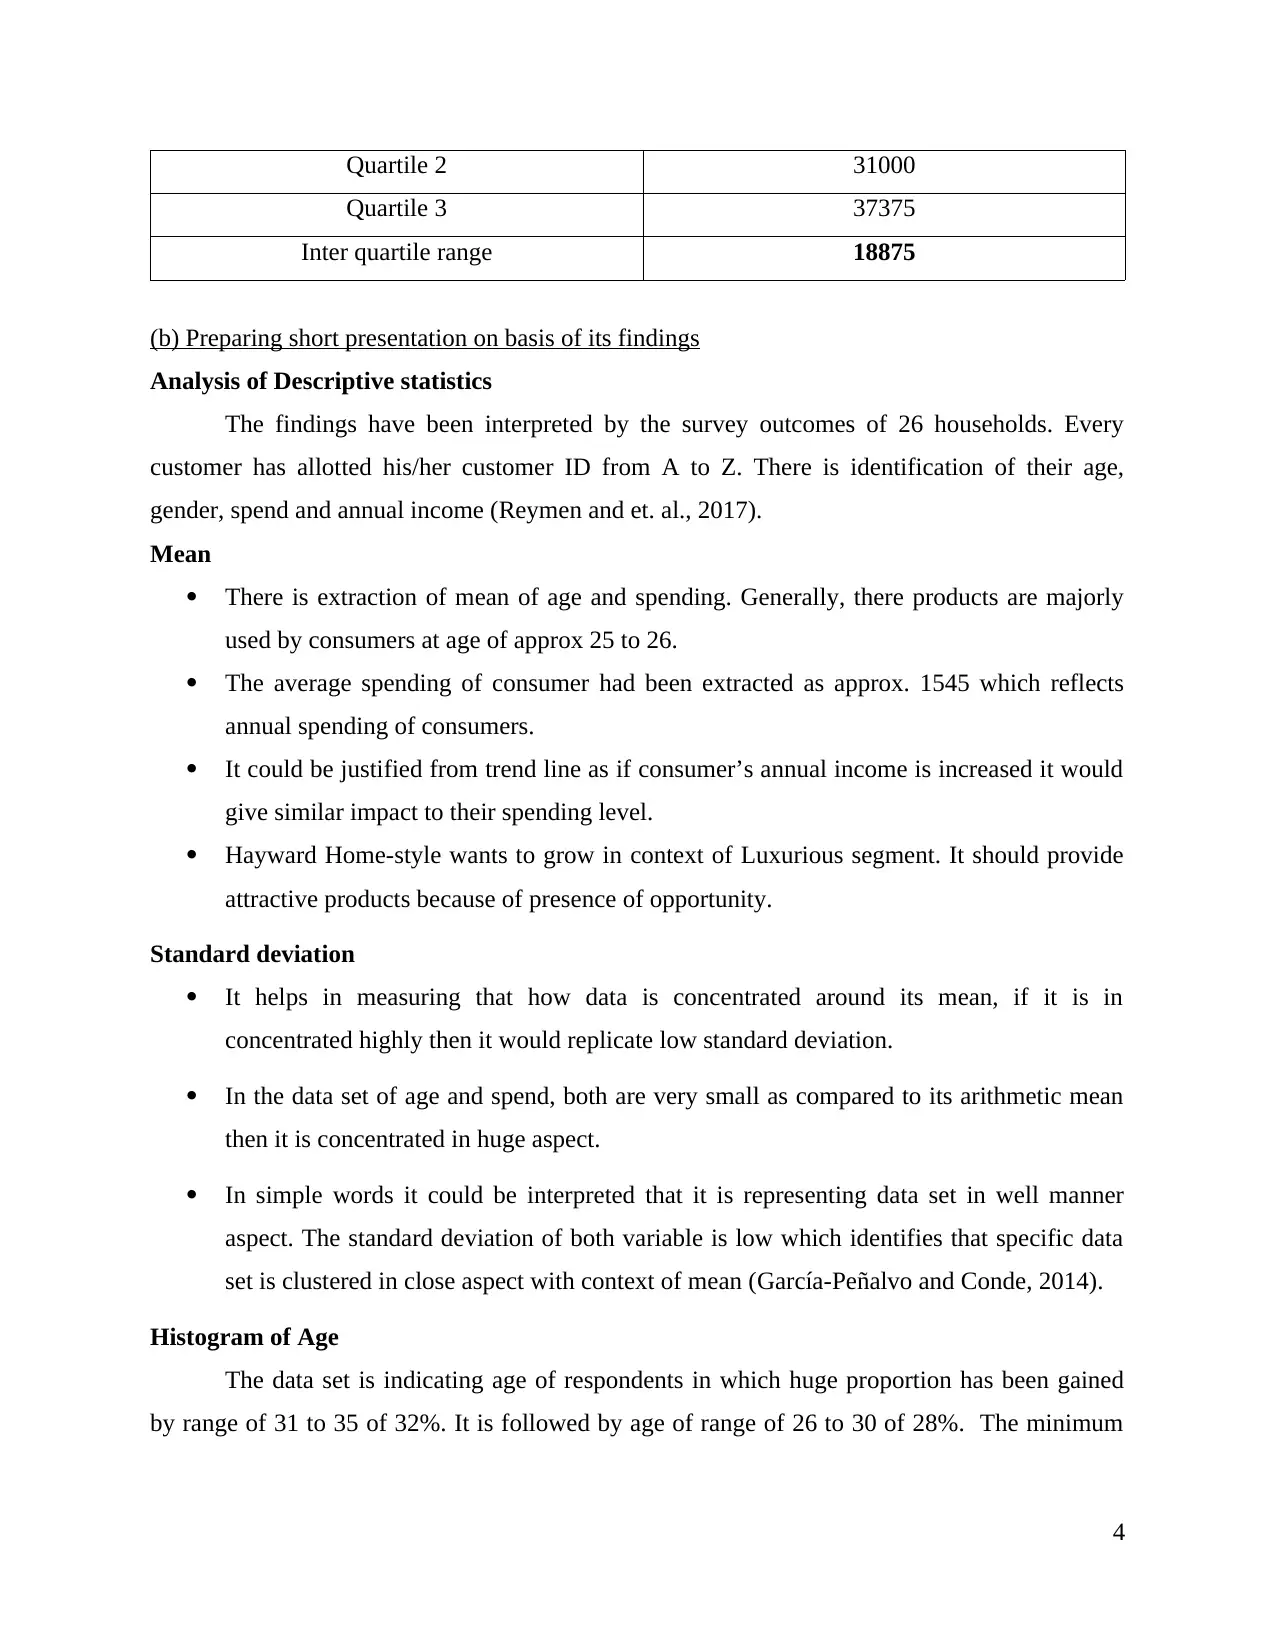
Quartile 2 31000
Quartile 3 37375
Inter quartile range 18875
(b) Preparing short presentation on basis of its findings
Analysis of Descriptive statistics
The findings have been interpreted by the survey outcomes of 26 households. Every
customer has allotted his/her customer ID from A to Z. There is identification of their age,
gender, spend and annual income (Reymen and et. al., 2017).
Mean
There is extraction of mean of age and spending. Generally, there products are majorly
used by consumers at age of approx 25 to 26.
The average spending of consumer had been extracted as approx. 1545 which reflects
annual spending of consumers.
It could be justified from trend line as if consumer’s annual income is increased it would
give similar impact to their spending level.
Hayward Home-style wants to grow in context of Luxurious segment. It should provide
attractive products because of presence of opportunity.
Standard deviation
It helps in measuring that how data is concentrated around its mean, if it is in
concentrated highly then it would replicate low standard deviation.
In the data set of age and spend, both are very small as compared to its arithmetic mean
then it is concentrated in huge aspect.
In simple words it could be interpreted that it is representing data set in well manner
aspect. The standard deviation of both variable is low which identifies that specific data
set is clustered in close aspect with context of mean (García-Peñalvo and Conde, 2014).
Histogram of Age
The data set is indicating age of respondents in which huge proportion has been gained
by range of 31 to 35 of 32%. It is followed by age of range of 26 to 30 of 28%. The minimum
4
⊘ This is a preview!⊘
Do you want full access?
Subscribe today to unlock all pages.
Trusted by 1+ million students worldwide
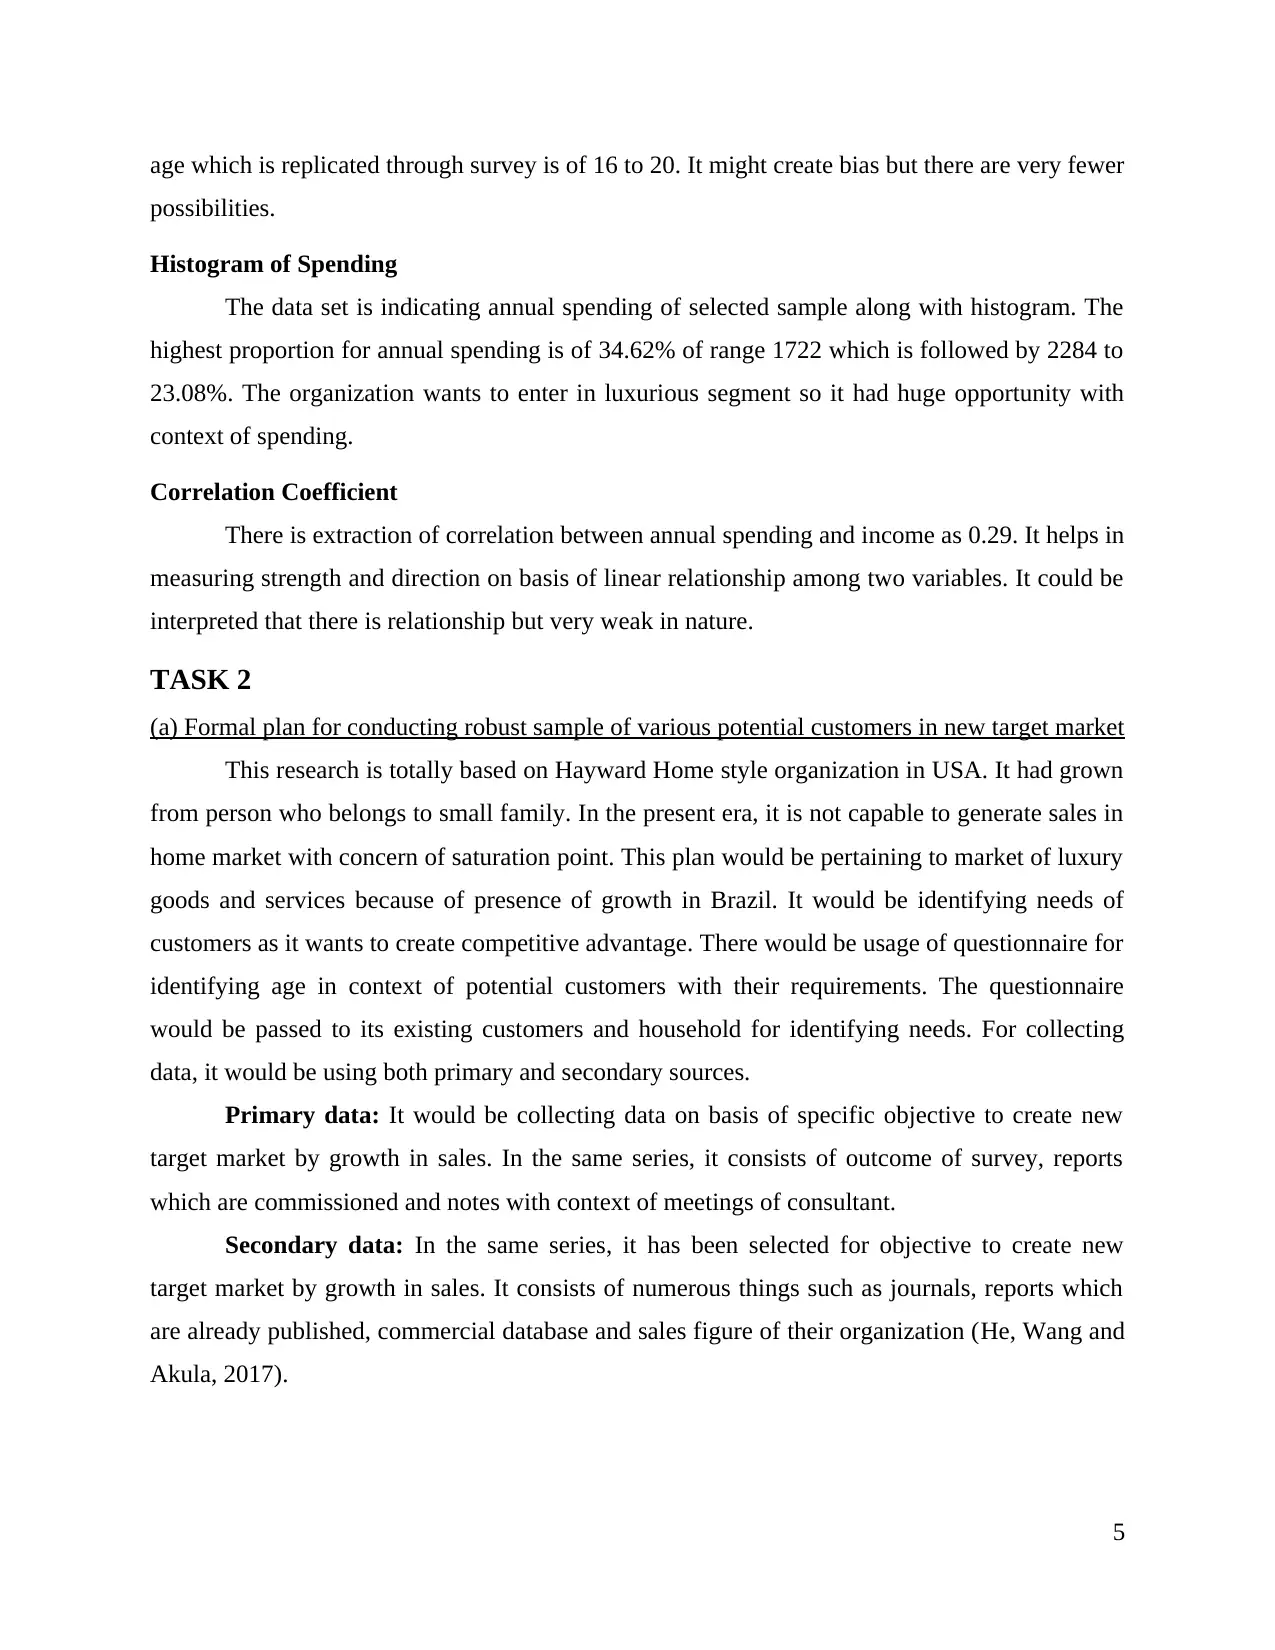
age which is replicated through survey is of 16 to 20. It might create bias but there are very fewer
possibilities.
Histogram of Spending
The data set is indicating annual spending of selected sample along with histogram. The
highest proportion for annual spending is of 34.62% of range 1722 which is followed by 2284 to
23.08%. The organization wants to enter in luxurious segment so it had huge opportunity with
context of spending.
Correlation Coefficient
There is extraction of correlation between annual spending and income as 0.29. It helps in
measuring strength and direction on basis of linear relationship among two variables. It could be
interpreted that there is relationship but very weak in nature.
TASK 2
(a) Formal plan for conducting robust sample of various potential customers in new target market
This research is totally based on Hayward Home style organization in USA. It had grown
from person who belongs to small family. In the present era, it is not capable to generate sales in
home market with concern of saturation point. This plan would be pertaining to market of luxury
goods and services because of presence of growth in Brazil. It would be identifying needs of
customers as it wants to create competitive advantage. There would be usage of questionnaire for
identifying age in context of potential customers with their requirements. The questionnaire
would be passed to its existing customers and household for identifying needs. For collecting
data, it would be using both primary and secondary sources.
Primary data: It would be collecting data on basis of specific objective to create new
target market by growth in sales. In the same series, it consists of outcome of survey, reports
which are commissioned and notes with context of meetings of consultant.
Secondary data: In the same series, it has been selected for objective to create new
target market by growth in sales. It consists of numerous things such as journals, reports which
are already published, commercial database and sales figure of their organization (He, Wang and
Akula, 2017).
5
Paraphrase This Document
Need a fresh take? Get an instant paraphrase of this document with our AI Paraphraser
(b) Secondary sources
There would be collection of data which has been collected for their specific purpose. It
consists of various things such as published reports, commercial data base and internal figure for
sales. It would be considered as very quick for its applications because of its easy availability. It
is cheaper as compared to primary data because it is already available and time savvy. Company
would be applying various secondary sources like facts and figures which are gathered by other
departments in context of trend. It would be using reference books, journals, newspapers,
published reports, government statistics and database which are available through online
(Pollmann and et. al., 2016).
(c) Survey Methodology and sampling Frame
Survey methodology: The organization would be using online survey methodology to its
existing customers for entering in luxurious segment of kitchen appliances. It would be also
passing this specific questionnaire to h in potential format for composing new target market.
Sampling frame: It is considered as specific source material or device on which there
would be selection of sample. In the particular research it would be selecting households because
its products are largely used their only. There would be usage of random sampling method. The
households would be selected from urban area as it wants to enter in luxurious segment. Its
universe would be of one locality which is dispersed with huge dispersed area.
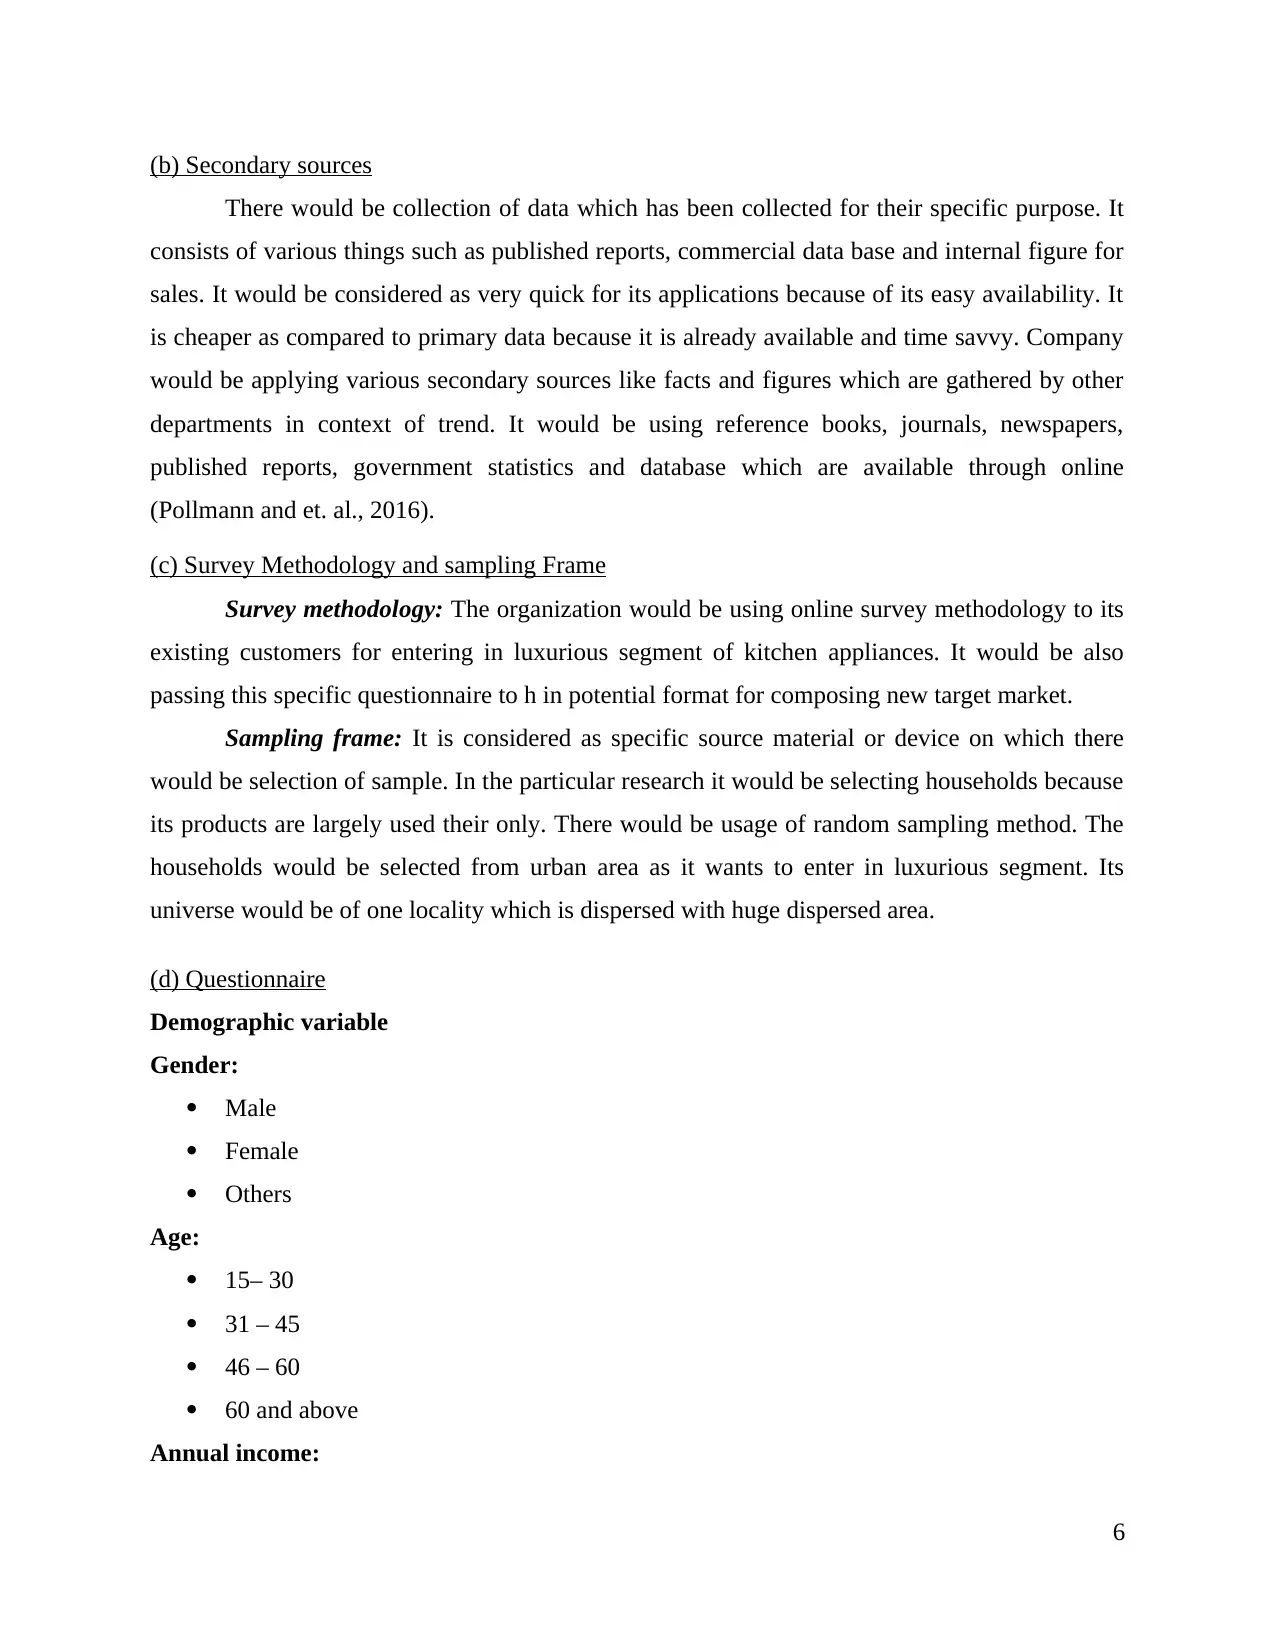
(d) Questionnaire
Demographic variable
Gender:
Male
Female
Others
Age:
15– 30
31 – 45
46 – 60
60 and above
Annual income:
6
There would be collection of data which has been collected for their specific purpose. It
consists of various things such as published reports, commercial data base and internal figure for
sales. It would be considered as very quick for its applications because of its easy availability. It
is cheaper as compared to primary data because it is already available and time savvy. Company
would be applying various secondary sources like facts and figures which are gathered by other
departments in context of trend. It would be using reference books, journals, newspapers,
published reports, government statistics and database which are available through online
(Pollmann and et. al., 2016).
(c) Survey Methodology and sampling Frame
Survey methodology: The organization would be using online survey methodology to its
existing customers for entering in luxurious segment of kitchen appliances. It would be also
passing this specific questionnaire to h in potential format for composing new target market.
Sampling frame: It is considered as specific source material or device on which there
would be selection of sample. In the particular research it would be selecting households because
its products are largely used their only. There would be usage of random sampling method. The
households would be selected from urban area as it wants to enter in luxurious segment. Its
universe would be of one locality which is dispersed with huge dispersed area.
(d) Questionnaire
Demographic variable
Gender:
Male
Female
Others
Age:
15– 30
31 – 45
46 – 60
60 and above
Annual income:
6
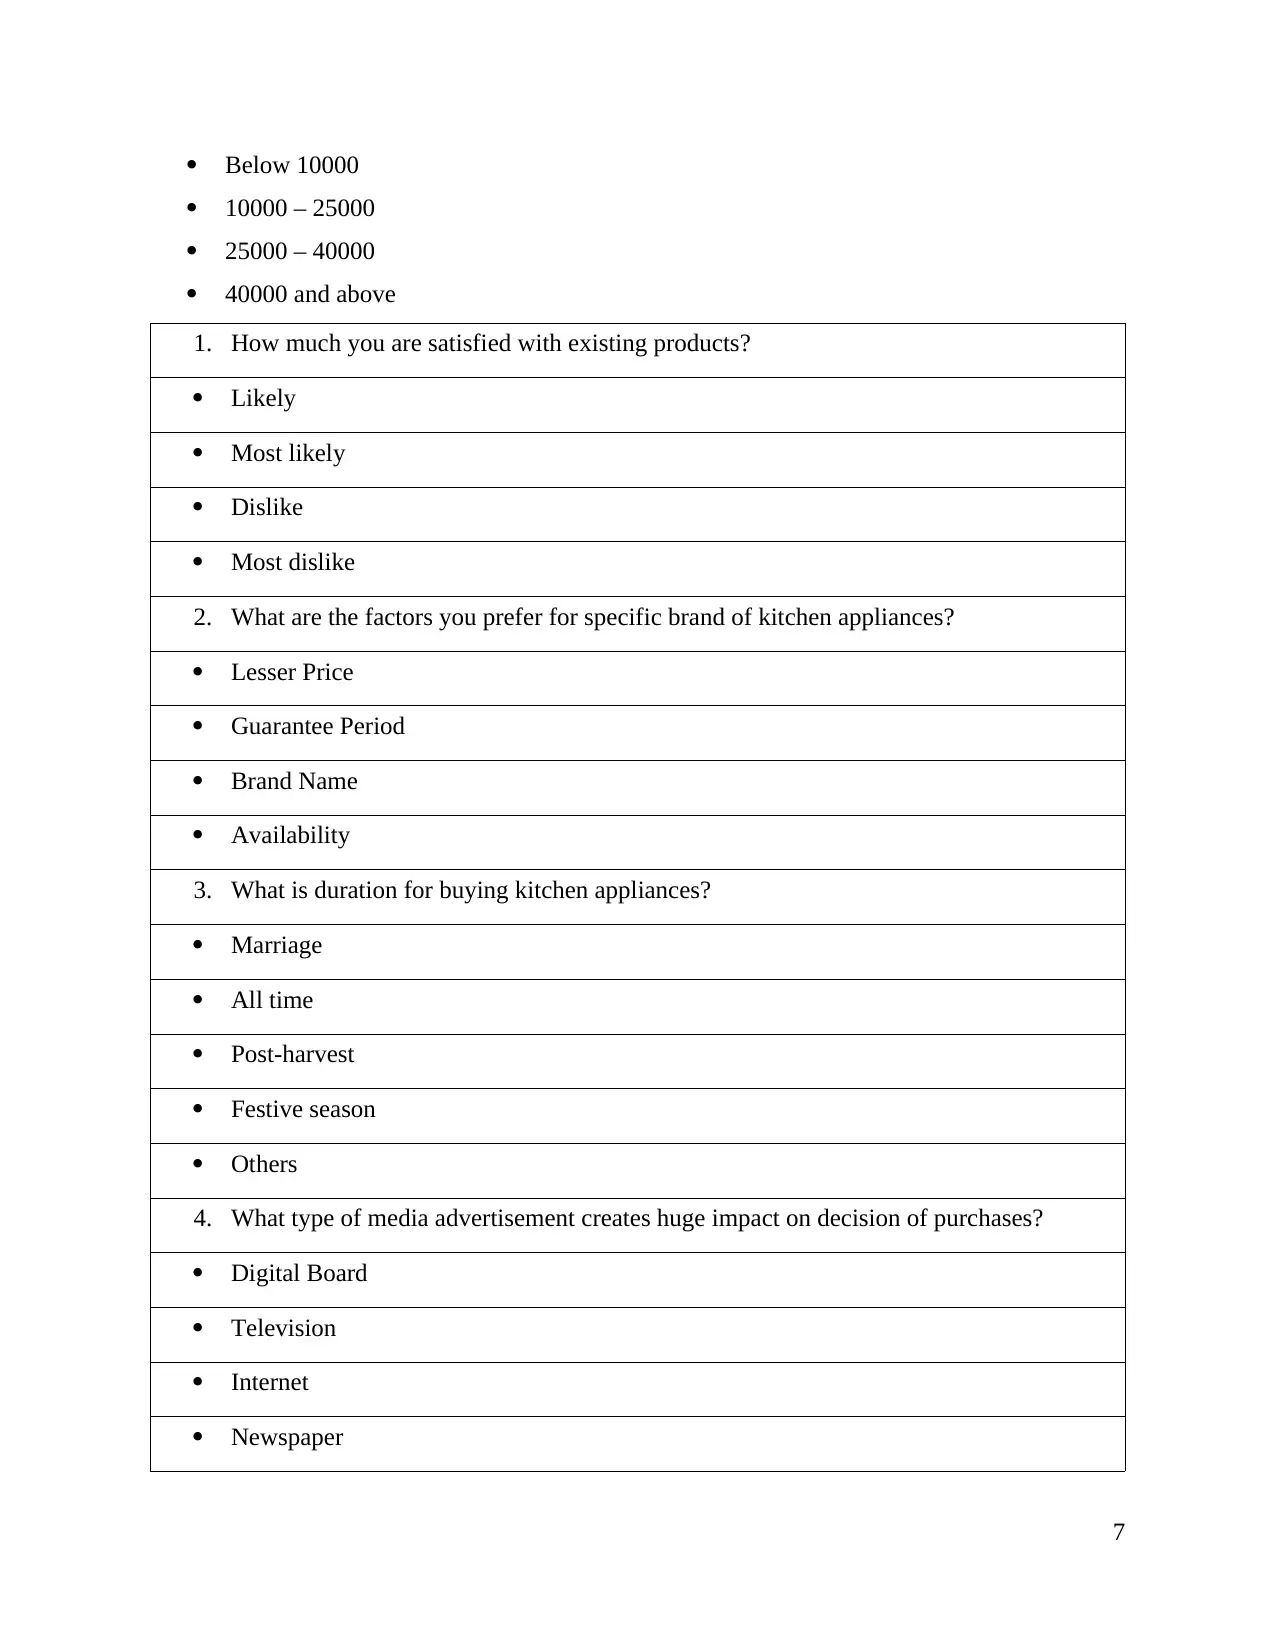
Below 10000
10000 – 25000
25000 – 40000
40000 and above
1. How much you are satisfied with existing products?
Likely
Most likely
Dislike
Most dislike
2. What are the factors you prefer for specific brand of kitchen appliances?
Lesser Price
Guarantee Period
Brand Name
Availability
3. What is duration for buying kitchen appliances?
Marriage
All time
Post-harvest
Festive season
Others
4. What type of media advertisement creates huge impact on decision of purchases?
Digital Board
Television
Internet
Newspaper
7
⊘ This is a preview!⊘
Do you want full access?
Subscribe today to unlock all pages.
Trusted by 1+ million students worldwide
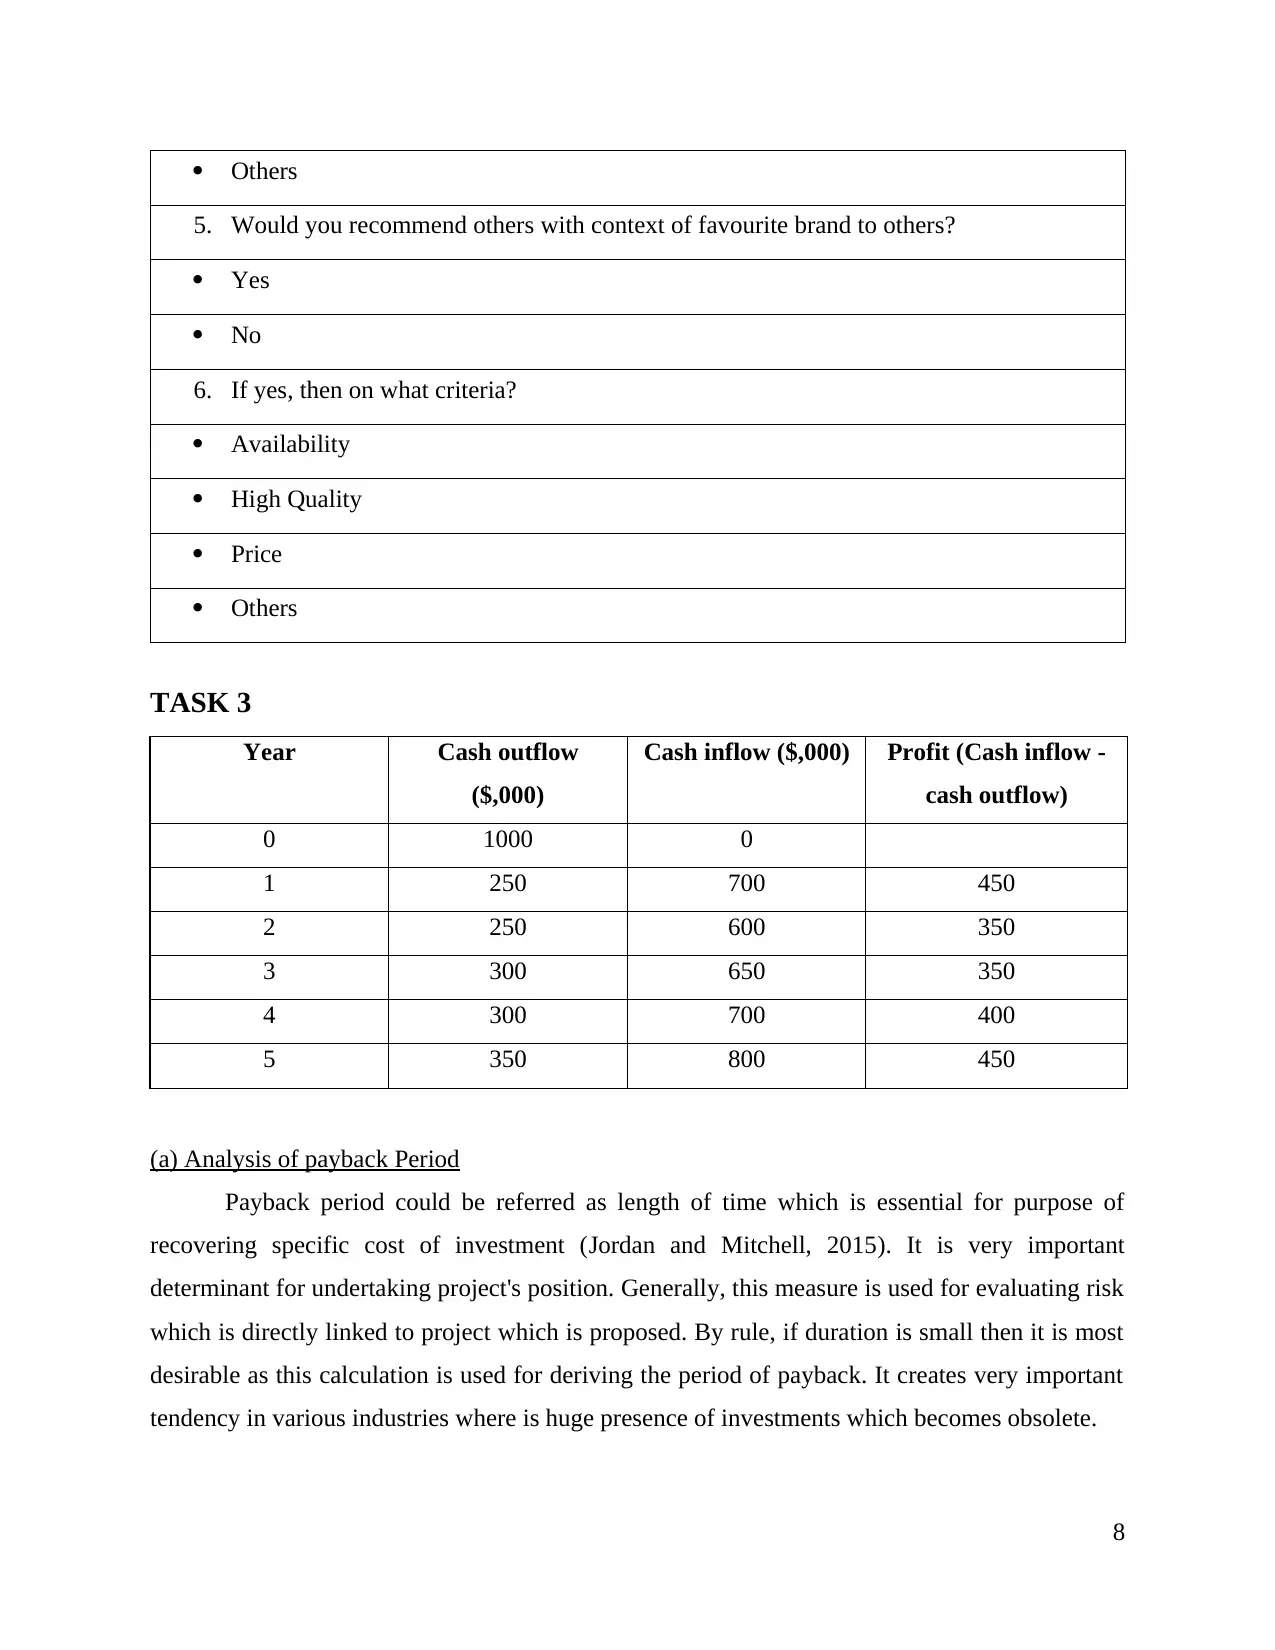
Others
5. Would you recommend others with context of favourite brand to others?
Yes
No
6. If yes, then on what criteria?
Availability
High Quality
Price
Others
TASK 3
Year Cash outflow
($,000)
Cash inflow ($,000) Profit (Cash inflow -
cash outflow)
0 1000 0
1 250 700 450
2 250 600 350
3 300 650 350
4 300 700 400
5 350 800 450
(a) Analysis of payback Period
Payback period could be referred as length of time which is essential for purpose of
recovering specific cost of investment (Jordan and Mitchell, 2015). It is very important
determinant for undertaking project's position. Generally, this measure is used for evaluating risk
which is directly linked to project which is proposed. By rule, if duration is small then it is most
desirable as this calculation is used for deriving the period of payback. It creates very important
tendency in various industries where is huge presence of investments which becomes obsolete.
8
Paraphrase This Document
Need a fresh take? Get an instant paraphrase of this document with our AI Paraphraser
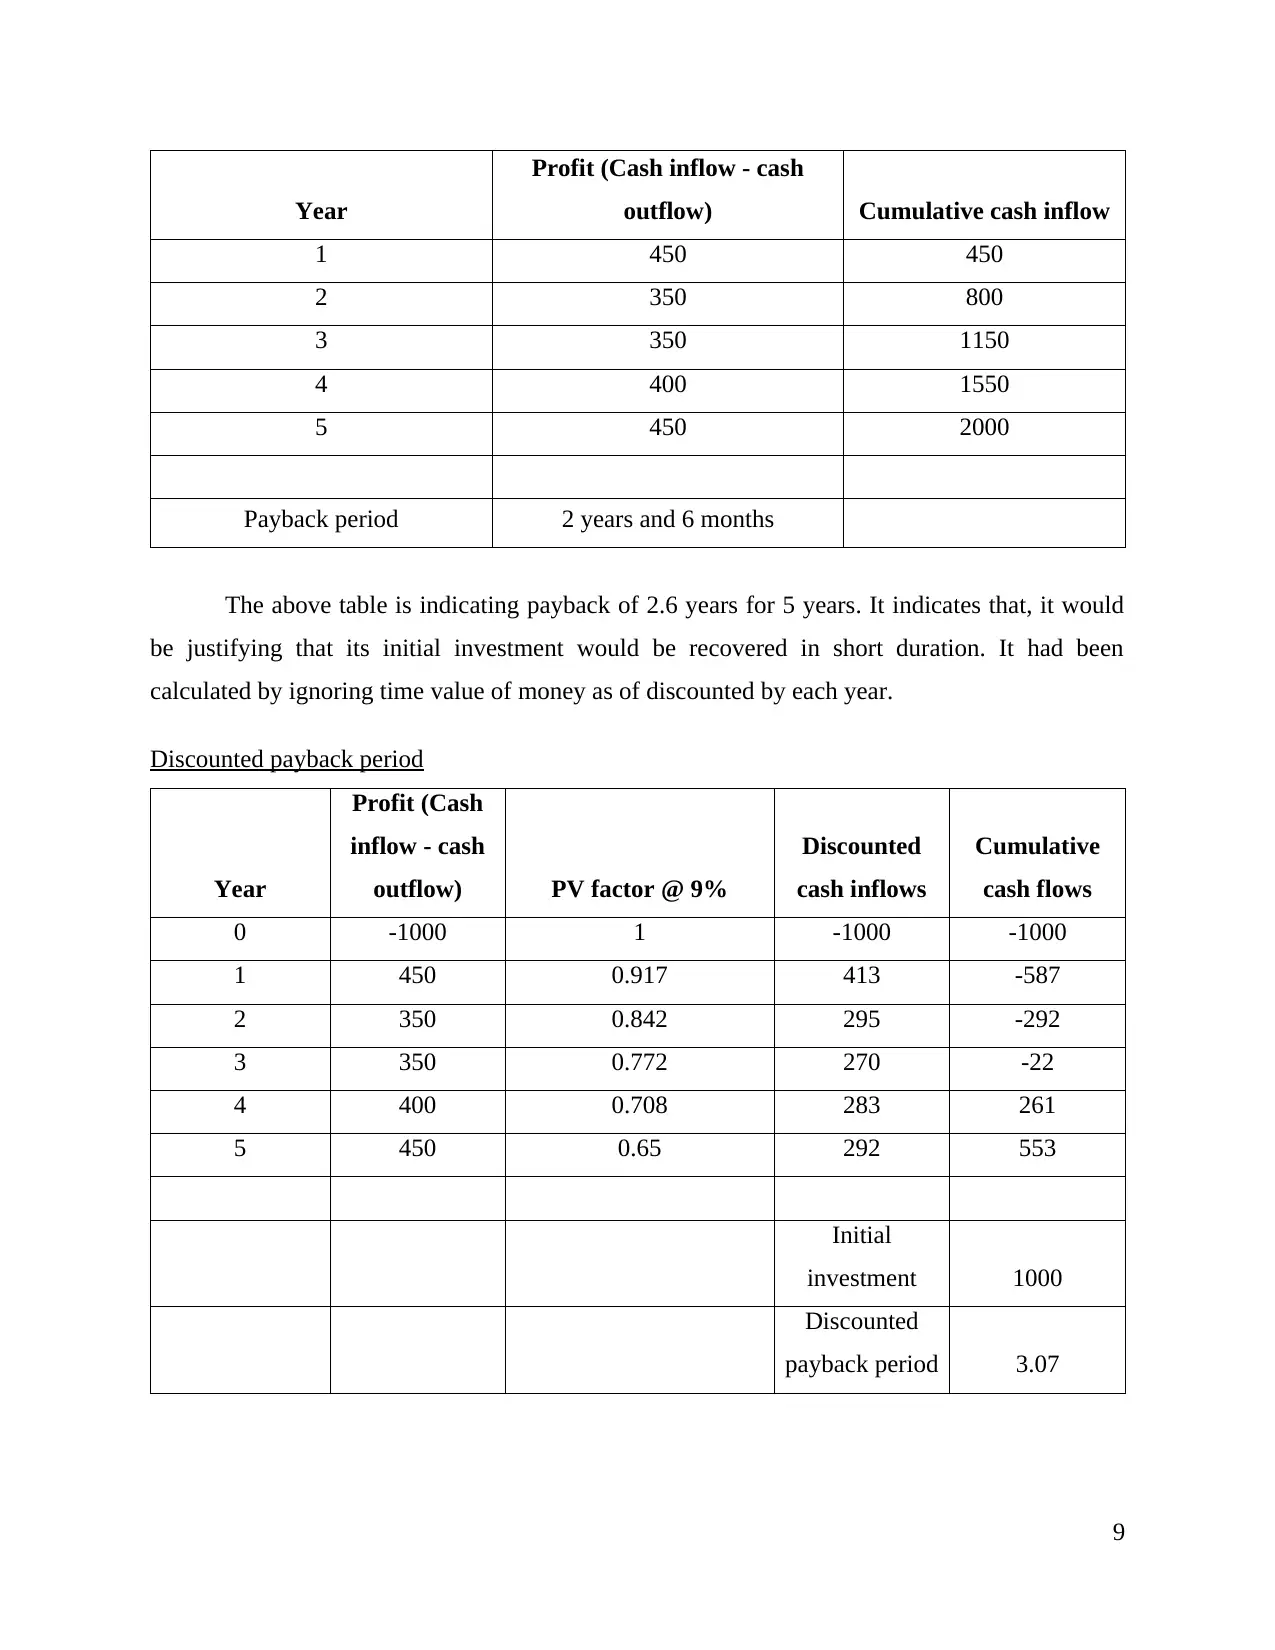
Year
Profit (Cash inflow - cash
outflow) Cumulative cash inflow
1 450 450
2 350 800
3 350 1150
4 400 1550
5 450 2000
Payback period 2 years and 6 months
The above table is indicating payback of 2.6 years for 5 years. It indicates that, it would
be justifying that its initial investment would be recovered in short duration. It had been
calculated by ignoring time value of money as of discounted by each year.
Discounted payback period
Year
Profit (Cash
inflow - cash
outflow) PV factor @ 9%
Discounted
cash inflows
Cumulative
cash flows
0 -1000 1 -1000 -1000
1 450 0.917 413 -587
2 350 0.842 295 -292
3 350 0.772 270 -22
4 400 0.708 283 261
5 450 0.65 292 553
Initial
investment 1000
Discounted
payback period 3.07
9
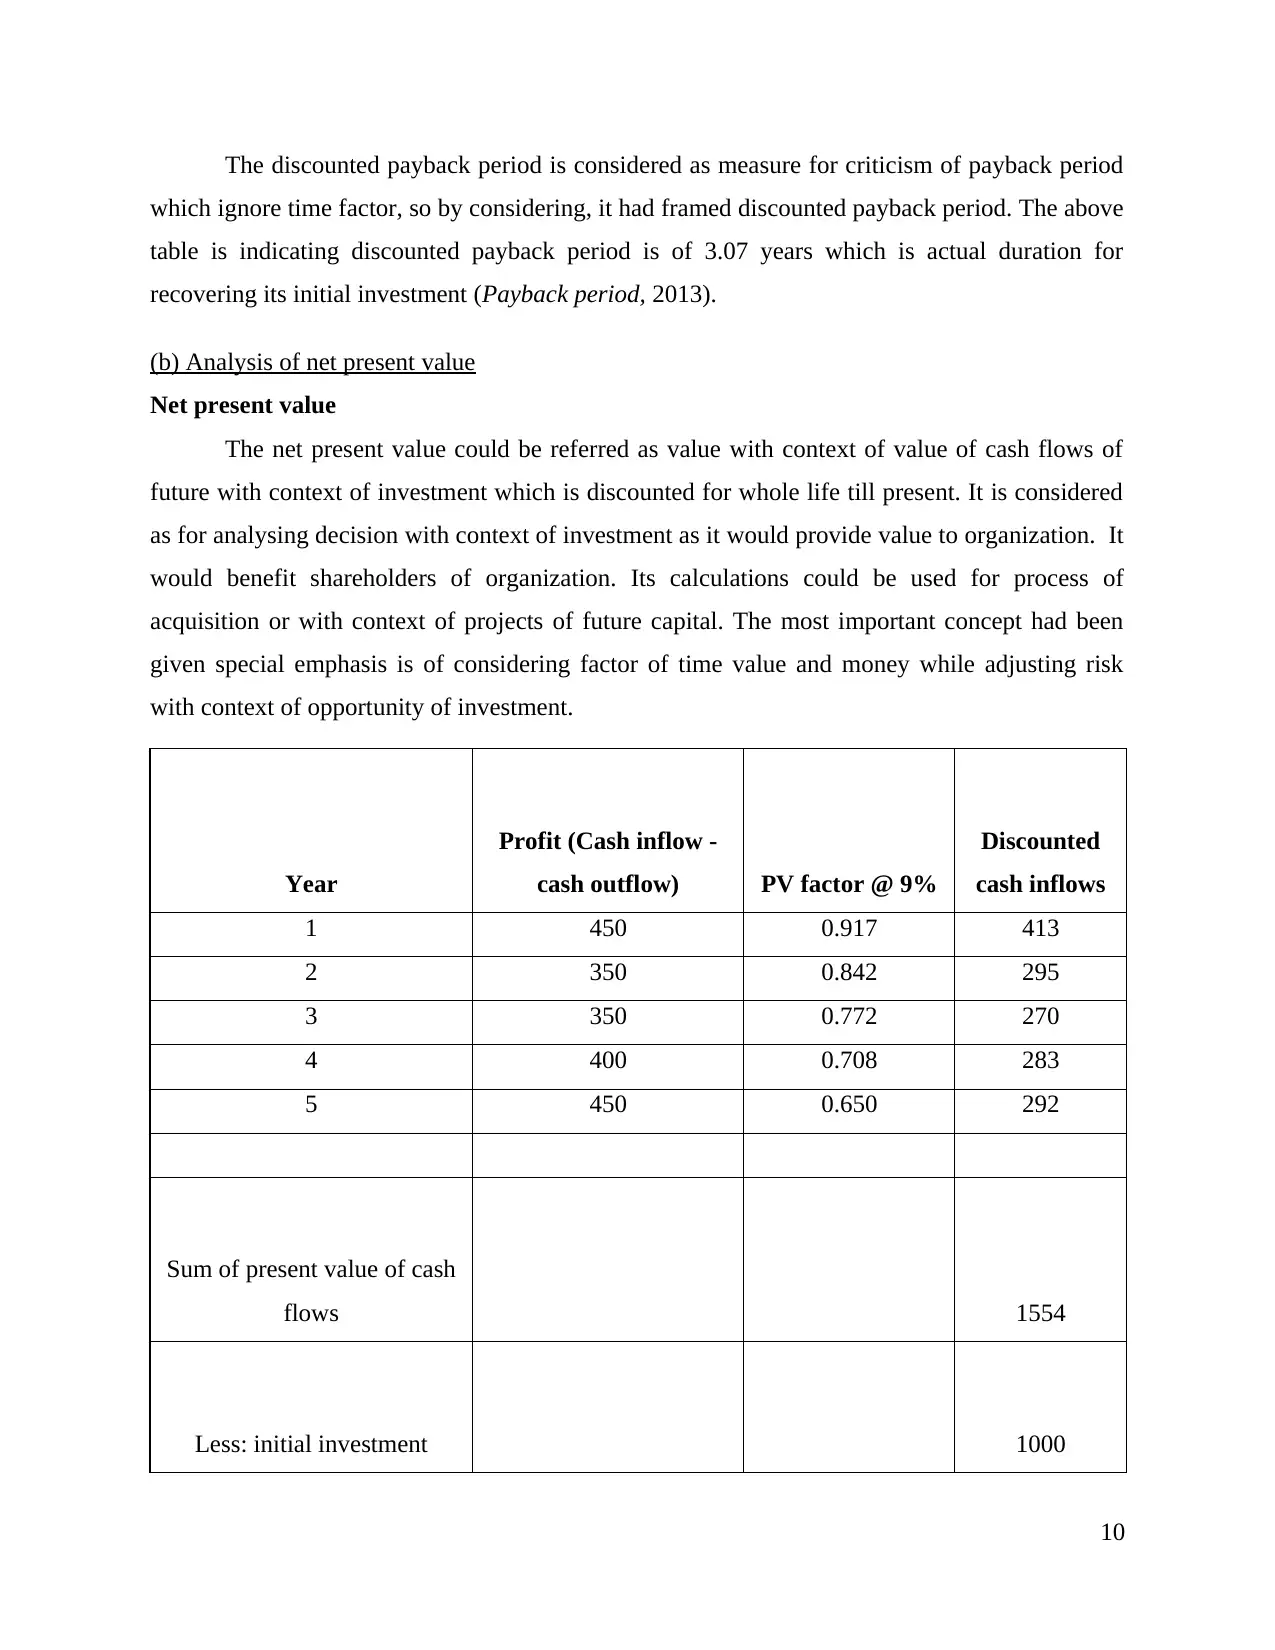
The discounted payback period is considered as measure for criticism of payback period
which ignore time factor, so by considering, it had framed discounted payback period. The above
table is indicating discounted payback period is of 3.07 years which is actual duration for
recovering its initial investment (Payback period, 2013).
(b) Analysis of net present value
Net present value
The net present value could be referred as value with context of value of cash flows of
future with context of investment which is discounted for whole life till present. It is considered
as for analysing decision with context of investment as it would provide value to organization. It
would benefit shareholders of organization. Its calculations could be used for process of
acquisition or with context of projects of future capital. The most important concept had been
given special emphasis is of considering factor of time value and money while adjusting risk
with context of opportunity of investment.
Year
Profit (Cash inflow -
cash outflow) PV factor @ 9%
Discounted
cash inflows
1 450 0.917 413
2 350 0.842 295
3 350 0.772 270
4 400 0.708 283
5 450 0.650 292
Sum of present value of cash
flows 1554
Less: initial investment 1000
10
⊘ This is a preview!⊘
Do you want full access?
Subscribe today to unlock all pages.
Trusted by 1+ million students worldwide
1 out of 16
Related Documents


Your All-in-One AI-Powered Toolkit for Academic Success.
+13062052269
info@desklib.com
Available 24*7 on WhatsApp / Email
![[object Object]](/_next/static/media/star-bottom.7253800d.svg)
Unlock your academic potential
Copyright © 2020–2026 A2Z Services. All Rights Reserved. Developed and managed by ZUCOL.