HC2022 Individual Market Research Report: Australia Analysis
VerifiedAdded on 2022/12/30
|9
|1952
|61
Report
AI Summary
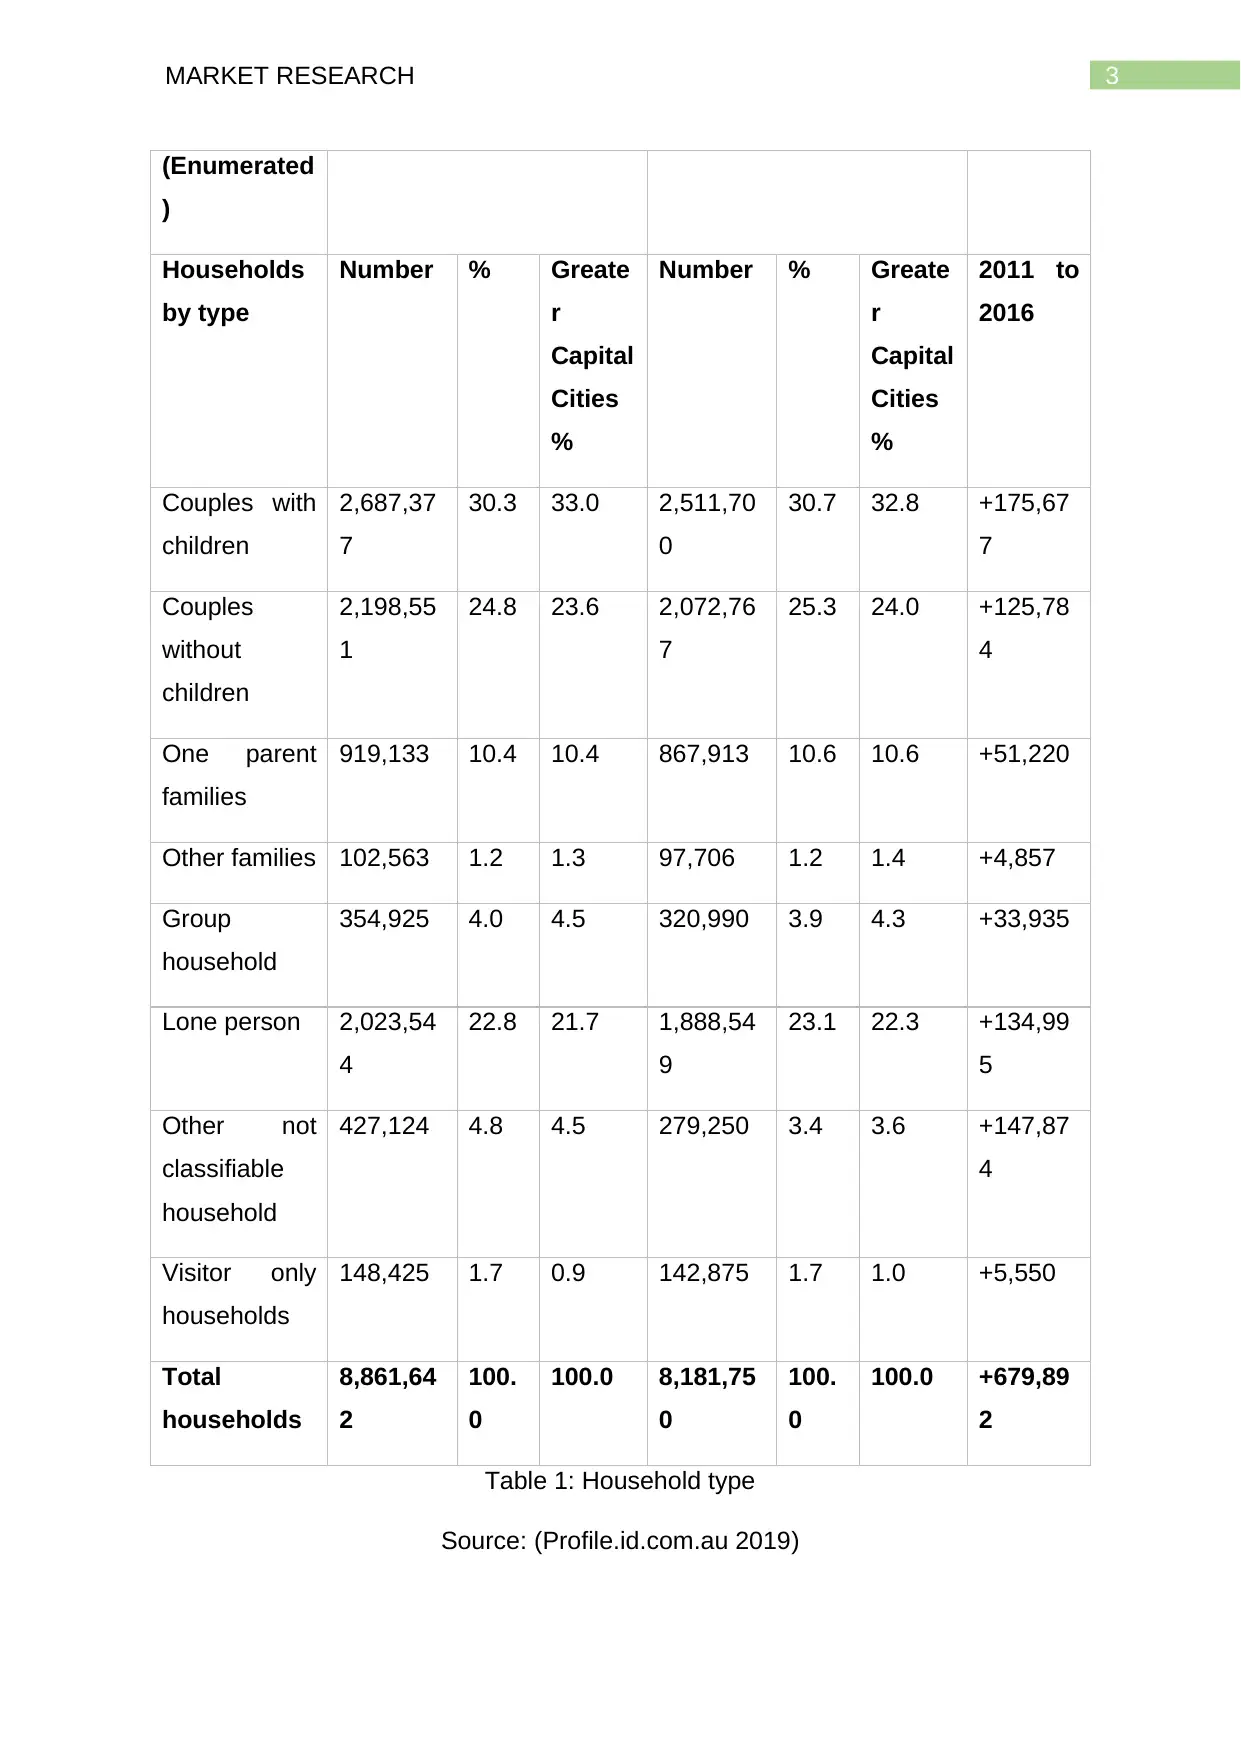
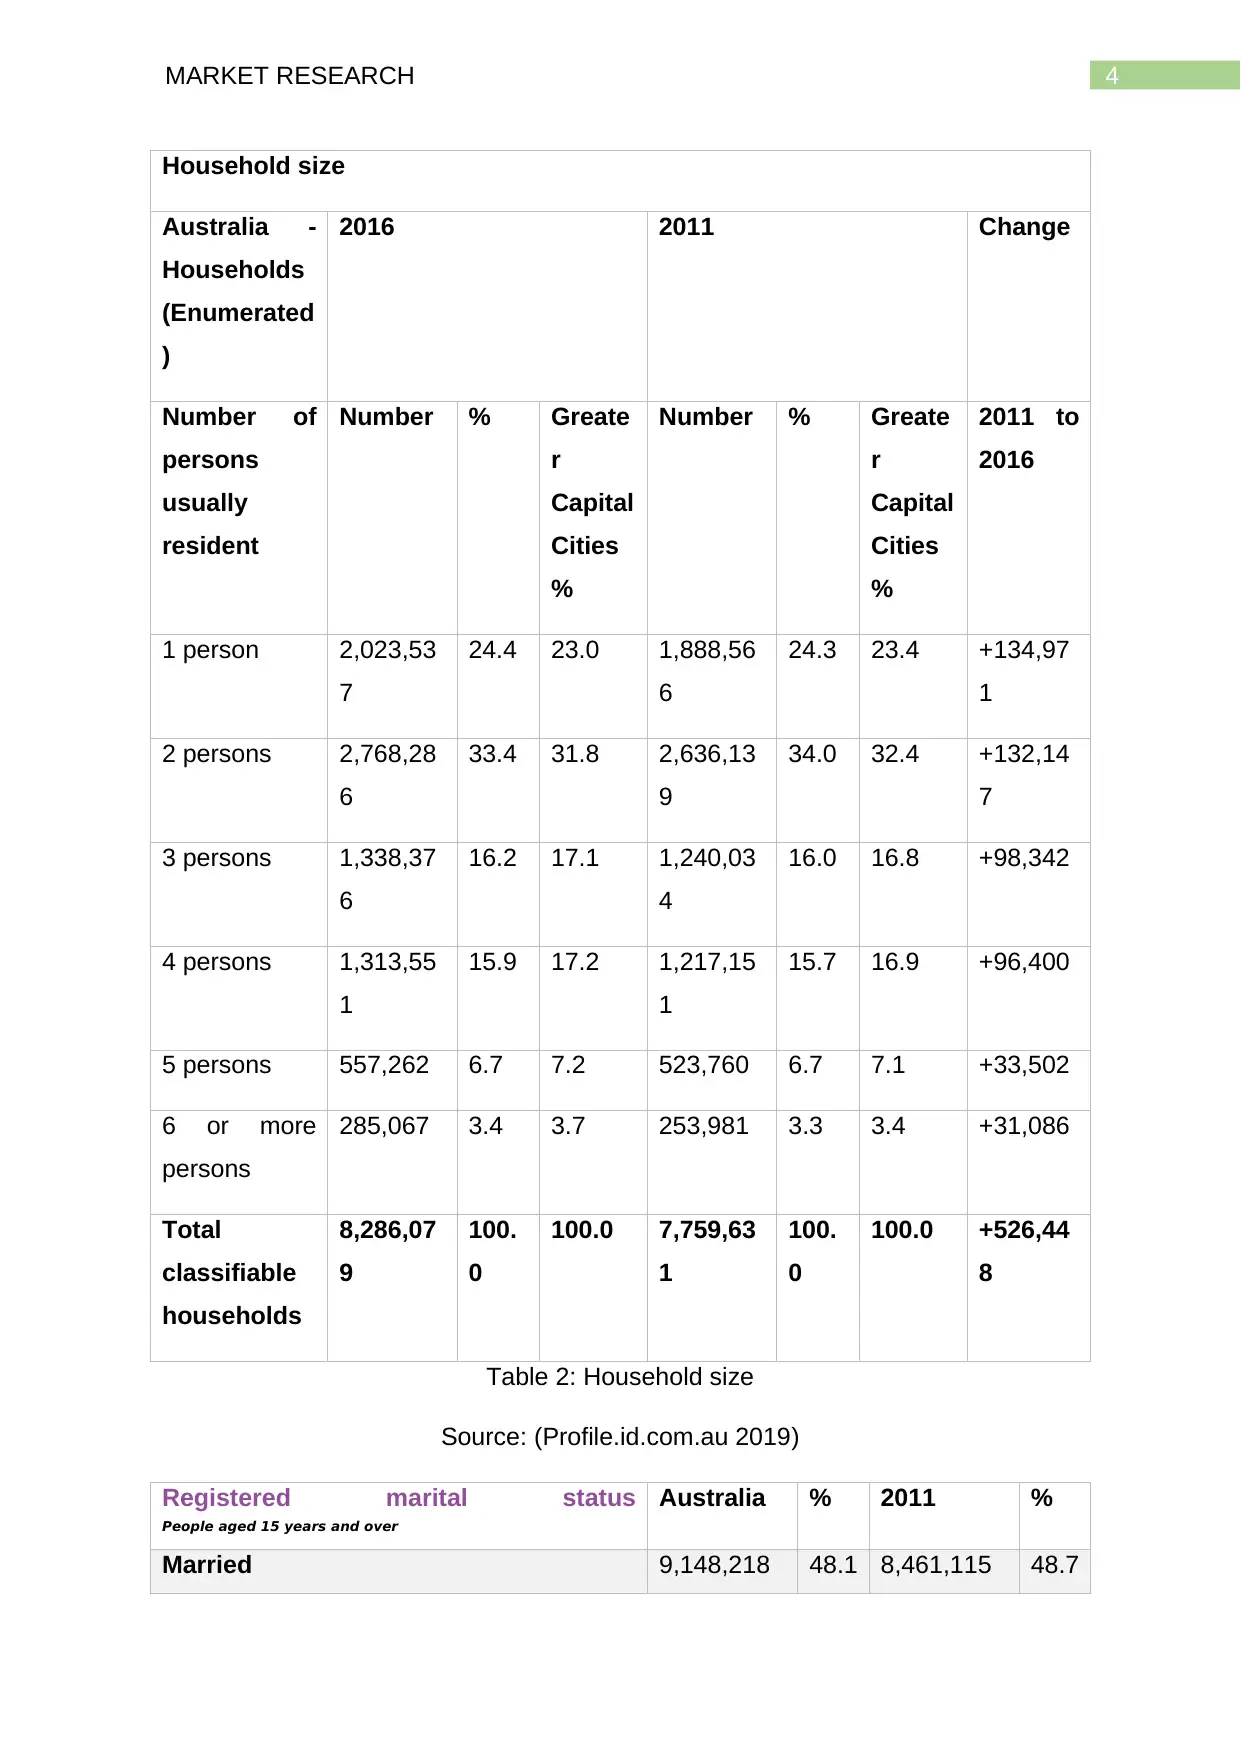
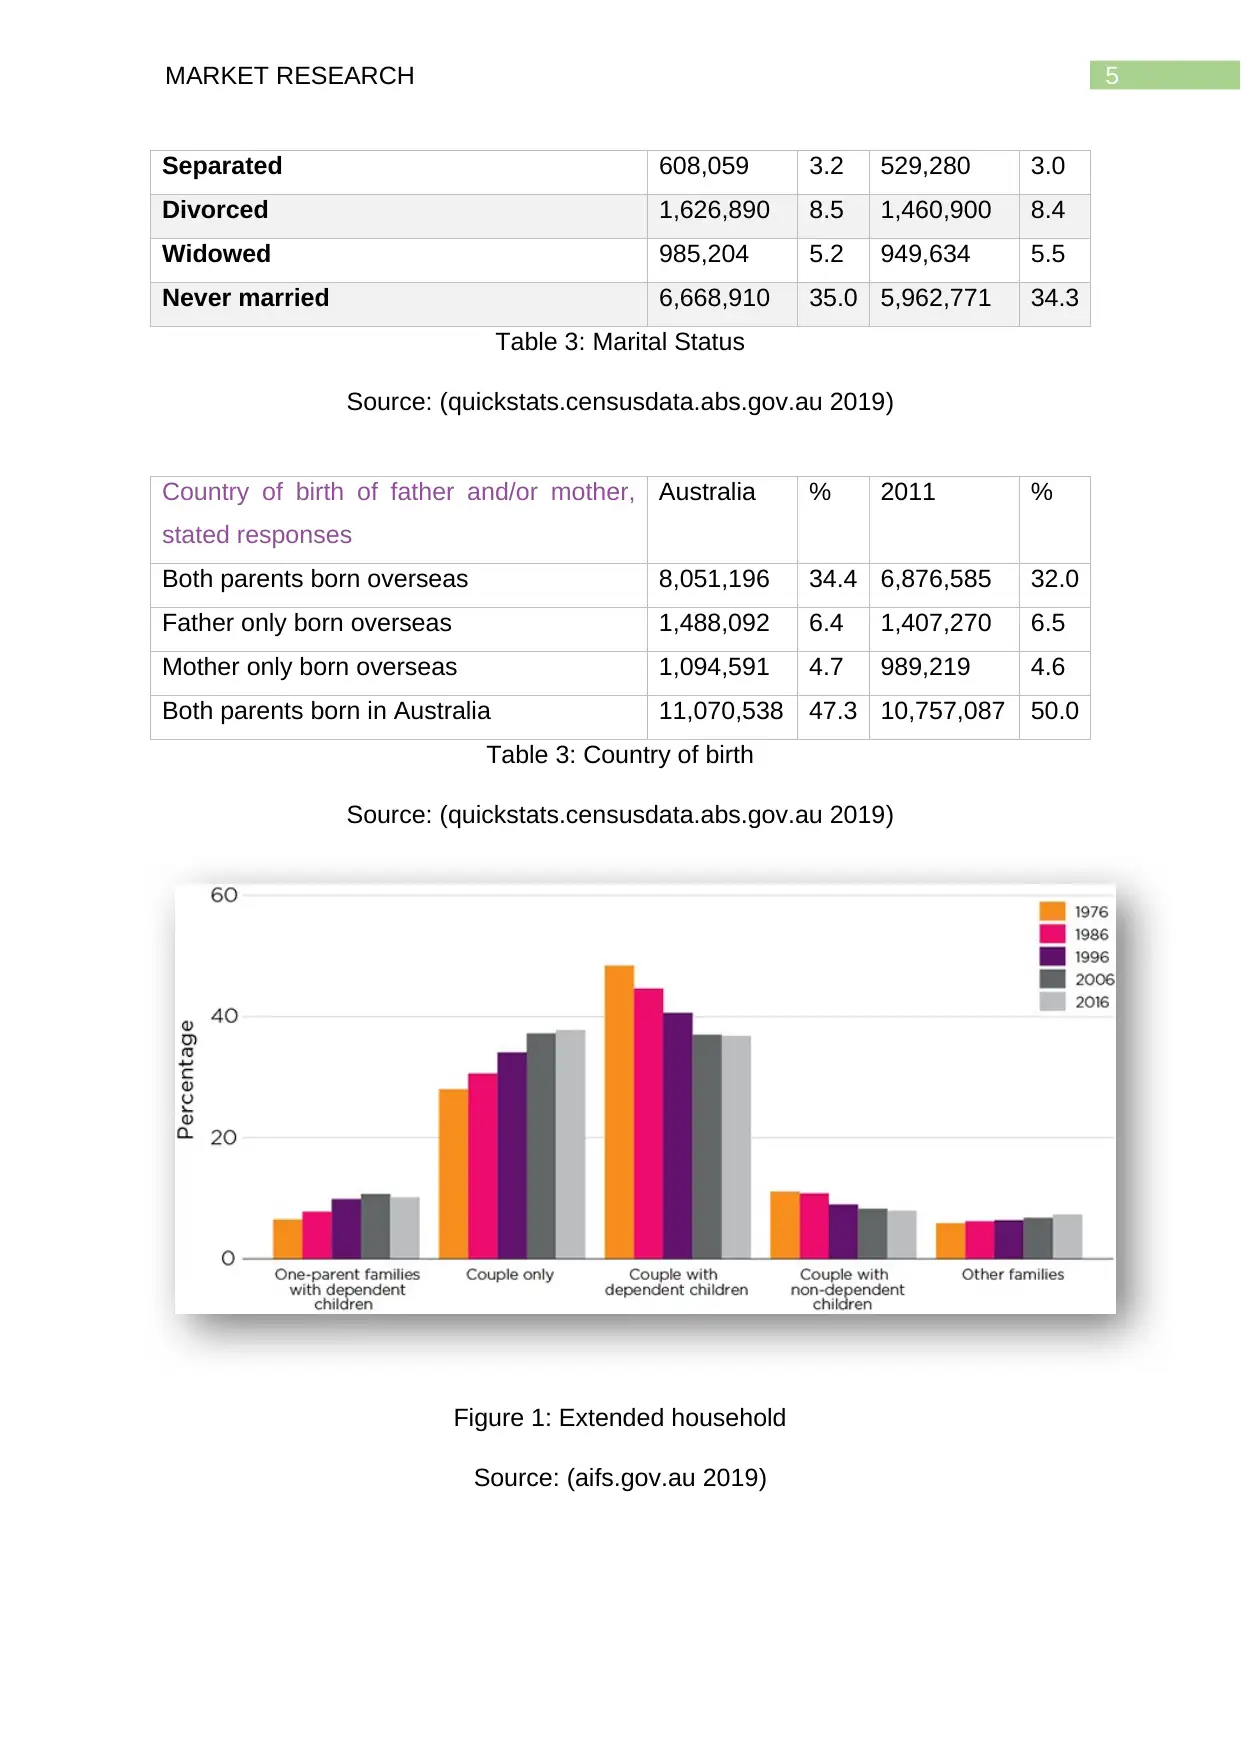
This report presents a market research analysis of the Australian housing market, commissioned by SKY HIGH Real Estate Developers to understand current consumer needs and future trends. The research employs a longitudinal study design, utilizing secondary data from government sources such as the Australian Bureau of Statistics and the Australian Institute of Family Studies. The report defines the problem as a real estate crisis stemming from falling property prices and the need to adapt to changing consumer preferences influenced by globalization and technological advancements. The analysis focuses on household structures, including household size, marital status, and country of birth, revealing trends such as increasing numbers of single-person households and extended families. The findings highlight the impact of housing affordability on family formation and suggest recommendations like build-to-rent apartments and developing larger houses. The report concludes by emphasizing the importance of addressing the issue of affordability in the Australian real estate market to meet the evolving needs of the population.

Running head: MARKET RESEARCH
Market Research
Name of the student
Name of the university
Author note
Market Research
Name of the student
Name of the university
Author note
Paraphrase This Document
Need a fresh take? Get an instant paraphrase of this document with our AI Paraphraser

1MARKET RESEARCH
1. Introduction
This research aims to perform a market survey to understand the present
family and household structure in Australia. SKY HIGH Real Estate Developers
wants to understand the needs of the consumers in the current market and the
changes that are expected in the next 20 years. Globalisation has led to the
significant change in the demographics of the country due to the change in lifestyle
and diversity in the population. In order to succeed in the market, it is essential for
the real estate developers to take into consideration the future needs of the
consumers for developing projects and strategies. The market survey defines the
problem effectively and performs analysis to provide suitable recommendations
based on the collected data. The data for the research has been collected from
government websites such as Australian Bureau of Statistics and Australian Institute
family. These government websites provides direct access to the past data over a
period of time and uses a longitudinal study to perform the analysis. The data
collection is completely based on secondary sources and no primary market survey
has been performed.
2. The research Process
2.1. Define the Problem
Real estate industry has been facing significant crisis due to the fall in the
property prices due to the shift in the economic drivers. However, the country is still
moving towards economic growth at a slower rate than usual. The increase in
pervasiveness of technology and the arrival of the concept of smart buildings the
majority of the real estate companies are looking into these options to understand
the changing needs of the consumers in the market. However, the prices of the
housing property were always off the charts and had put immense pressure on the
buyers. This has led to the decrease in apartment building construction by 36% in
the year of 2018 (www2.deloitte.com 2019). Australia’s housing affordability stress is
one of the major issues and SKY HIGH Real Estate Developers wants to understand
the needs of the consumers in the current market and the changes that are expected
in the next 20 years.

2MARKET RESEARCH
2.2. Planning the research design
This research has chosen a longitudinal research design for collecting and
analysing the data. The longitudinal study does not interferes with the subjects and
observations are made over a certain period of time (Ioannidis et al. 2014). This
helps in determining and examining the change in the characteristics of the
demographics of the target population at both individual and group level. This
method facilitates in establishing sequence in events and can be extended beyond a
single moment. Longitudinal studies can also be used to measure the cause and
effect, and determine the trend in the next few years. However, the research design
is chosen based on the objective and goal of the study. In this research, descriptive
research design has been chosen for data and analysing data. Descriptive research
design is used for shedding light on the problems and issues on the research
context. It is a scientific technique where observations are made to describe a
phenomenon. This will help in understanding the areas which needs to be focused
on and develop strategies based on it.
2.3. Planning the sample
Sampling is the method of choosing sample elements from the total
population in the research. Sampling is performed to select a sub set of data which
represents the overall population. In this study, the research has used non
probabilistic sampling method to collect data from two websites that met the criteria
(Etikan, Alkassim and Abubakar 2016). The research has used purposive sampling
to choose data from Australian Bureau of Statistics and Australian Institute of Family
Studies. These websites consisted of longitudinal data which has been able to
provide a detail analysis of the demographics of the participants.
2.4 Collecting the data
This section describes the data collected from community websites and data
collected from the government websites.
Census and Population in Housing
Household type
Australia -
Total
households
2016 2011 Change
⊘ This is a preview!⊘
Do you want full access?
Subscribe today to unlock all pages.

Trusted by 1+ million students worldwide

3MARKET RESEARCH
(Enumerated
)
Households
by type
Number % Greate
r
Capital
Cities
%
Number % Greate
r
Capital
Cities
%
2011 to
2016
Couples with
children
2,687,37
7
30.3 33.0 2,511,70
0
30.7 32.8 +175,67
7
Couples
without
children
2,198,55
1
24.8 23.6 2,072,76
7
25.3 24.0 +125,78
4
One parent
families
919,133 10.4 10.4 867,913 10.6 10.6 +51,220
Other families 102,563 1.2 1.3 97,706 1.2 1.4 +4,857
Group
household
354,925 4.0 4.5 320,990 3.9 4.3 +33,935
Lone person 2,023,54
4
22.8 21.7 1,888,54
9
23.1 22.3 +134,99
5
Other not
classifiable
household
427,124 4.8 4.5 279,250 3.4 3.6 +147,87
4
Visitor only
households
148,425 1.7 0.9 142,875 1.7 1.0 +5,550
Total
households
8,861,64
2
100.
0
100.0 8,181,75
0
100.
0
100.0 +679,89
2
Table 1: Household type
Source: (Profile.id.com.au 2019)
Paraphrase This Document
Need a fresh take? Get an instant paraphrase of this document with our AI Paraphraser

4MARKET RESEARCH
Household size
Australia -
Households
(Enumerated
)
2016 2011 Change
Number of
persons
usually
resident
Number % Greate
r
Capital
Cities
%
Number % Greate
r
Capital
Cities
%
2011 to
2016
1 person 2,023,53
7
24.4 23.0 1,888,56
6
24.3 23.4 +134,97
1
2 persons 2,768,28
6
33.4 31.8 2,636,13
9
34.0 32.4 +132,14
7
3 persons 1,338,37
6
16.2 17.1 1,240,03
4
16.0 16.8 +98,342
4 persons 1,313,55
1
15.9 17.2 1,217,15
1
15.7 16.9 +96,400
5 persons 557,262 6.7 7.2 523,760 6.7 7.1 +33,502
6 or more
persons
285,067 3.4 3.7 253,981 3.3 3.4 +31,086
Total
classifiable
households
8,286,07
9
100.
0
100.0 7,759,63
1
100.
0
100.0 +526,44
8
Table 2: Household size
Source: (Profile.id.com.au 2019)
Registered marital status
People aged 15 years and over
Australia % 2011 %
Married 9,148,218 48.1 8,461,115 48.7

5MARKET RESEARCH
Separated 608,059 3.2 529,280 3.0
Divorced 1,626,890 8.5 1,460,900 8.4
Widowed 985,204 5.2 949,634 5.5
Never married 6,668,910 35.0 5,962,771 34.3
Table 3: Marital Status
Source: (quickstats.censusdata.abs.gov.au 2019)
Country of birth of father and/or mother,
stated responses
Australia % 2011 %
Both parents born overseas 8,051,196 34.4 6,876,585 32.0
Father only born overseas 1,488,092 6.4 1,407,270 6.5
Mother only born overseas 1,094,591 4.7 989,219 4.6
Both parents born in Australia 11,070,538 47.3 10,757,087 50.0
Table 3: Country of birth
Source: (quickstats.censusdata.abs.gov.au 2019)
Figure 1: Extended household
Source: (aifs.gov.au 2019)
⊘ This is a preview!⊘
Do you want full access?
Subscribe today to unlock all pages.

Trusted by 1+ million students worldwide

6MARKET RESEARCH
2.5 Analysing the Data
The data collected shows that 24% of the households in the country
comprises of only 1 member which is constant in comparison with the data in 2011.
Household sizes are affected or impacted the unavailability of affordable housing.
The number of overseas migrants have increased significant and they have the
traditional of living with extended members in the family. This has affected the
household size; household size decreased till the year of 2005 and was stable
between the years of 2006 to 2016. However, there has been an increase in
household sizes in past two three years which shows that there is a lack of
affordable housing opportunities for the younger generation or due to the increase in
family formation. However, the data on the household type shows that percentage of
people living alone have increased significantly. This indicates that younger people
are under greater pressure and are avoiding to start a family due to the increase in
real estate prices. Households are getting relatively smaller and extended
household analysis shows that there has been increase in couples living alone
without any children. This means that the real estate pricing is putting pressure on
the younger couples and they are unable to extend their family due to lack of
affordable real estates. This can also be understood by the dominant group in the
household type where it can be seen that two person household is the most
dominant. Moreover, it can be seen that as the cost of real estates is higher in the
greater capital cities, when compared to the other cities. This can be understood by
the reduction in lone households and increase in larger households. The percentage
of lone household in greater capital cities is 23% which is 1% less than in other
cities.
3. Formulating conclusions
The report draws conclusion by highlighting the key findings and methods
used to conduct the analysis. The conclusion section also provides valid
recommendation based on the analysis of the data. The report used a longitudinal
descriptive research design to examine the phenomenon and discussed nuances
developed from each of the cases. The data has been collected from the from
government websites such as Australian Bureau of Statistics and Australian Institute
family. The findings have been able to address the research problem mentioned in
the study and shows that real estate pricing is relatively higher in Australia. The
Paraphrase This Document
Need a fresh take? Get an instant paraphrase of this document with our AI Paraphraser

7MARKET RESEARCH
majority of the people in the greater capital cities are moving to extended households
due to the increase in real estate prices. However, the pattern is similar throughout
the country which indicates the need for affordable pricing among real estate
apartments.
The study provides following recommendations based on the analysis
performed and they are as follows:
The development of build to rent apartment is one of the most effective
solution for the younger generation feeling effective pressure of prices. Built to
rent apartments construction will facilitate in developing long term ownership
increases the incentive for generating higher quality and this model is immune
to market changes in housing demand.
Development of larger houses at market prices for the diversified population
will result in increase in extended families and affordability of the family.

8MARKET RESEARCH
References
aifs.gov.au 2019. Population and households. [online] Australian Institute of Family
Studies. Available at: https://aifs.gov.au/facts-and-figures/population-and-households
[Accessed 28 Aug. 2019].
Etikan, I., Alkassim, R. and Abubakar, S., 2016. Comparision of snowball sampling
and sequential sampling technique. Biometrics & Biostatistics International
Journal, 3(1), pp.1-2.
Ioannidis, J.P., Greenland, S., Hlatky, M.A., Khoury, M.J., Macleod, M.R., Moher, D.,
Schulz, K.F. and Tibshirani, R., 2014. Increasing value and reducing waste in
research design, conduct, and analysis. The Lancet, 383(9912), pp.166-175.
Profile.id.com.au 2019. Household size | Australia | Community profile. [online]
Profile.id.com.au. Available at: https://profile.id.com.au/australia/household-size
[Accessed 28 Aug. 2019].
Profile.id.com.au 2019. Household type | Australia | Community profile. [online]
Profile.id.com.au. Available at: https://profile.id.com.au/australia/households
[Accessed 28 Aug. 2019].
quickstats.censusdata.abs.gov.au 2019. 2016 Census QuickStats: Australia. [online]
Quickstats.censusdata.abs.gov.au. Available at:
https://quickstats.censusdata.abs.gov.au/census_services/getproduct/census/2016/
quickstat/036 [Accessed 28 Aug. 2019].
www2.deloitte.com 2019. Real Estate Outlook 2019 | Deloitte Australia | Real Estate.
[online] Deloitte Australia. Available at: https://www2.deloitte.com/au/en/pages/real-
estate/articles/real-estate-outlook-australian-perspective.html [Accessed 28 Aug.
2019].
⊘ This is a preview!⊘
Do you want full access?
Subscribe today to unlock all pages.

Trusted by 1+ million students worldwide
1 out of 9
Related Documents

Your All-in-One AI-Powered Toolkit for Academic Success.
+13062052269
info@desklib.com
Available 24*7 on WhatsApp / Email
Unlock your academic potential
Copyright © 2020–2025 A2Z Services. All Rights Reserved. Developed and managed by ZUCOL.