HC2091 Finance Report: Commonwealth Bank Financial Performance
VerifiedAdded on 2023/06/08
|26
|4009
|388
Report
AI Summary
This report provides a detailed analysis of Commonwealth Bank's financial performance between 2016 and 2017. It examines various performance ratios, including short-term solvency (current ratio and times interest earned), long-term solvency (total debt to total assets and debt-equity ratio), asset utilization (asset turnover and receivables collection period), and profitability ratios (cash return on sales, gross profit margin, net profit margin, and return on assets). The analysis indicates improvements in liquidity and asset turnover, but also highlights concerns regarding high debt levels. The report concludes with a comparison of share price movements, offering insights into the bank's overall financial health and investment potential. Desklib provides a platform for students to access similar solved assignments and past papers for academic assistance.
Running head: BUSINESS FINANCE
Business Finance
Name of the Student:
Name of the University:
Author’s Note:
Course ID:
Business Finance
Name of the Student:
Name of the University:
Author’s Note:
Course ID:
Paraphrase This Document
Need a fresh take? Get an instant paraphrase of this document with our AI Paraphraser
1
BUSINESS FINANCE
Table of Contents
1. Description of the companies......................................................................................................3
Brief Description of the Company...............................................................................................3
Core Activities.............................................................................................................................3
Competitive Advantages..............................................................................................................3
Banking Industry.........................................................................................................................4
2. Calculation and analysis of performance ratios...........................................................................5
Short term solvency.....................................................................................................................5
Current Ratio...........................................................................................................................6
Times interest earned...............................................................................................................7
Long term solvency.....................................................................................................................7
Total Debt to Total Assets.......................................................................................................8
Debt Equity Ratio....................................................................................................................9
Asset utilization.........................................................................................................................10
Assets Turnover.....................................................................................................................11
Receivables Collection Period...............................................................................................12
Profitability Ratios.....................................................................................................................12
Cash return on sales...............................................................................................................13
Gross Profit Margin...............................................................................................................14
2
BUSINESS FINANCE
Net Profit Margin...................................................................................................................15
Return on assets.....................................................................................................................16
Market Value Ratios..................................................................................................................16
Price Earnings Ratio..............................................................................................................17
Payout Ratio...........................................................................................................................18
Earning Price Per Share.........................................................................................................19
3. Graphs and comparison of share price movements...................................................................19
References......................................................................................................................................23
⊘ This is a preview!⊘
Do you want full access?
Subscribe today to unlock all pages.
Trusted by 1+ million students worldwide

3
BUSINESS FINANCE
1. Description of the companies
Brief Description of the Company
Commonwealth of Australia was established in accordance to the Commonwealth Bank
Act 1911. Commonwealth Bank is considered to be having sufficient savings pertaining to the
general business in the bank. The initiation of the bank was further depicted in terms of
receiving a federal government guarantee. The earliest and strenuous proponent is further seen to
be flamboyant among the American-Australian politician, King O'Malley (Commbank.com.au
2018).
Core Activities
The key financial activities of the bank are seen to be based on various types of the
financial services. This is seen to be included in terms of the financial services including the
retail, funds management, institutional banking and broking services. The bank is also
recognized as one of the largest listed Australian company including the several types of the
brands pertaining to Commonwealth Insurance, Bankwest, Colonial First State Investments,
ASB Bank (New Zealand) and Commonwealth Securities (CommSec) (Commbank.com.au
2018).
Competitive Advantages
The important factors associated to the competitive advantage for the company needs to
be identified with the visionary, creative and agile initiatives. The disruptors of the company are
also considered with fresh thinking and appetite for growth. The proactive and positive change
has been also seen to be major facilitator of the competitive advantage. It needs to be also seen
Paraphrase This Document
Need a fresh take? Get an instant paraphrase of this document with our AI Paraphraser
4
BUSINESS FINANCE
that the harnessers are able to improve the overall business and also pus the optimization process.
The competitive advantages need to be also considered with the approach taken by the policy
adopters. These strategies are evident with a cautious focus on the innovation and the changes.
The reluctant nature of the adopters has been further seen with reluctant need for the reassurance
and evidence. The maintenance of the complacent resistors is also depicted with competitive
advantage (Commbank.com.au 2018).
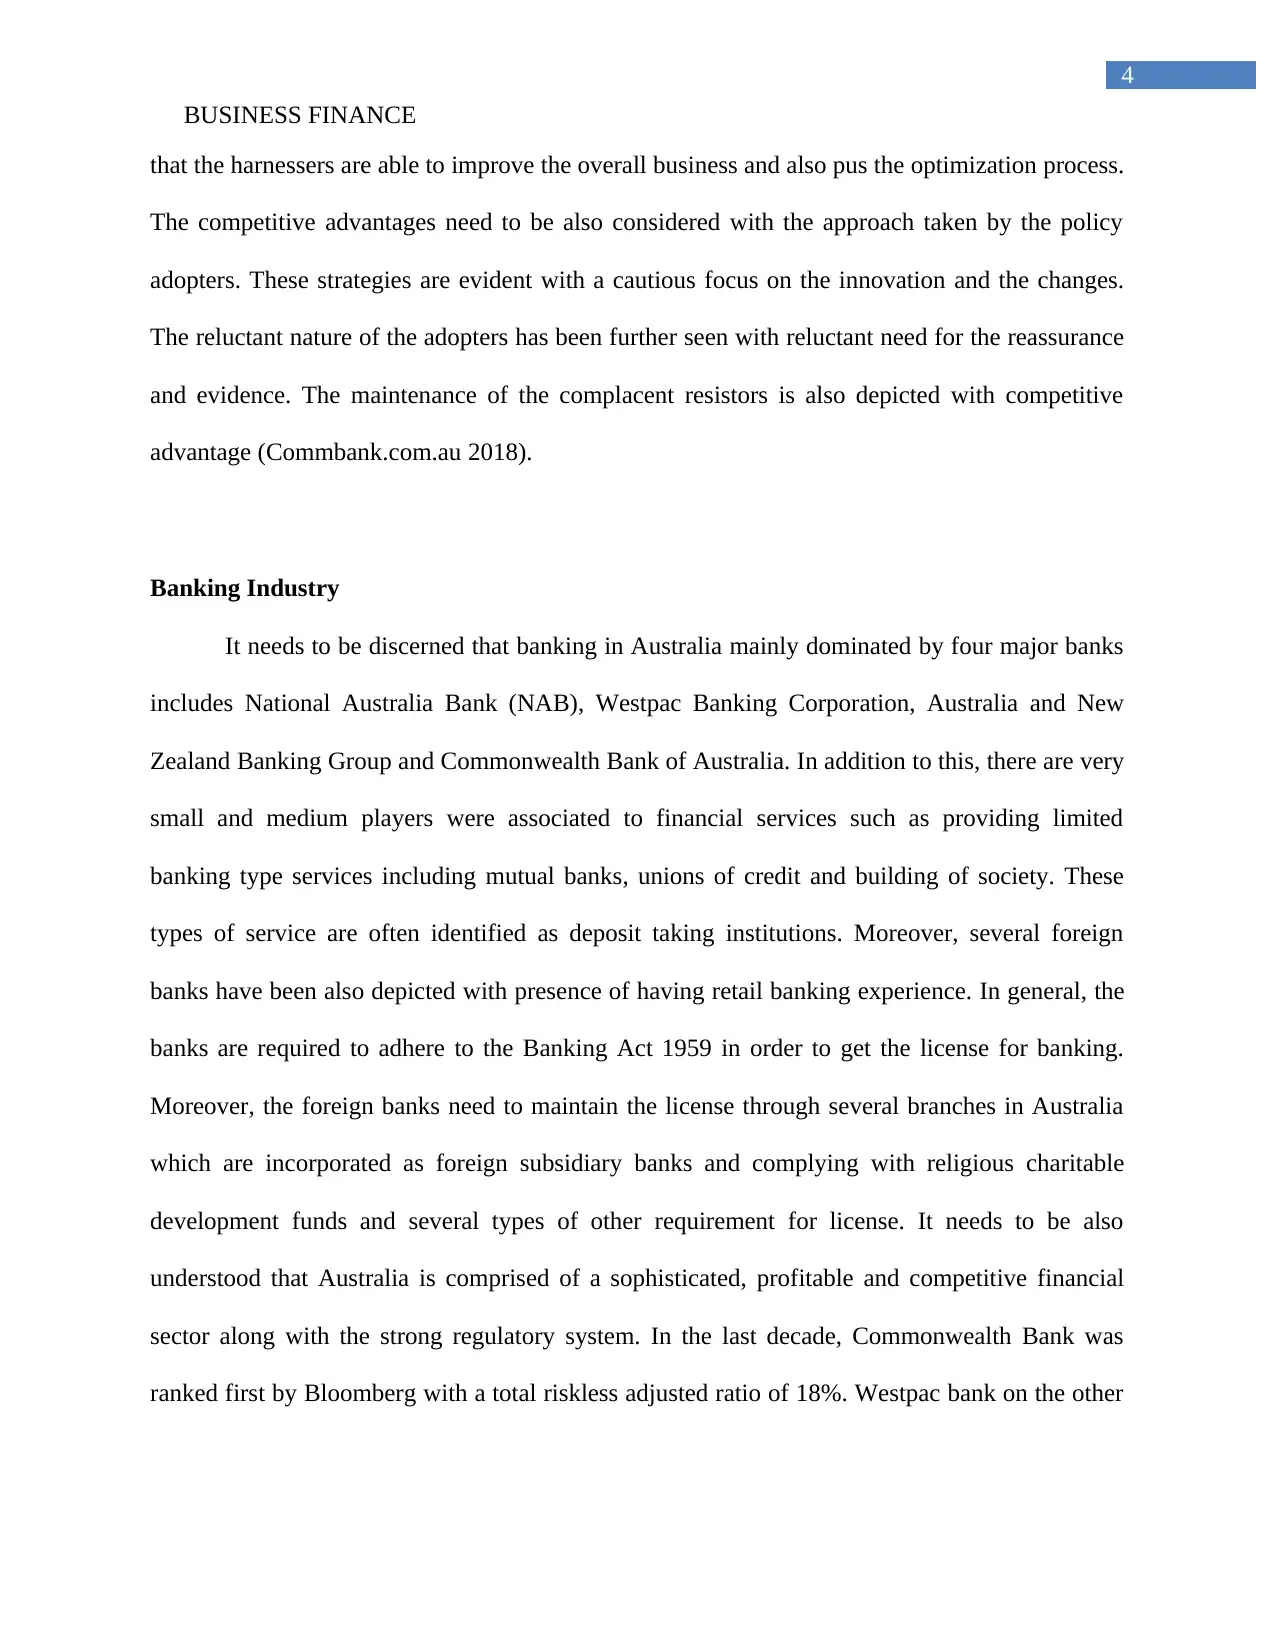
Banking Industry
It needs to be discerned that banking in Australia mainly dominated by four major banks
includes National Australia Bank (NAB), Westpac Banking Corporation, Australia and New
Zealand Banking Group and Commonwealth Bank of Australia. In addition to this, there are very
small and medium players were associated to financial services such as providing limited
banking type services including mutual banks, unions of credit and building of society. These
types of service are often identified as deposit taking institutions. Moreover, several foreign
banks have been also depicted with presence of having retail banking experience. In general, the
banks are required to adhere to the Banking Act 1959 in order to get the license for banking.
Moreover, the foreign banks need to maintain the license through several branches in Australia
which are incorporated as foreign subsidiary banks and complying with religious charitable
development funds and several types of other requirement for license. It needs to be also
understood that Australia is comprised of a sophisticated, profitable and competitive financial
sector along with the strong regulatory system. In the last decade, Commonwealth Bank was
ranked first by Bloomberg with a total riskless adjusted ratio of 18%. Westpac bank on the other
BUSINESS FINANCE
that the harnessers are able to improve the overall business and also pus the optimization process.
The competitive advantages need to be also considered with the approach taken by the policy
adopters. These strategies are evident with a cautious focus on the innovation and the changes.
The reluctant nature of the adopters has been further seen with reluctant need for the reassurance
and evidence. The maintenance of the complacent resistors is also depicted with competitive
advantage (Commbank.com.au 2018).
Banking Industry
It needs to be discerned that banking in Australia mainly dominated by four major banks
includes National Australia Bank (NAB), Westpac Banking Corporation, Australia and New
Zealand Banking Group and Commonwealth Bank of Australia. In addition to this, there are very
small and medium players were associated to financial services such as providing limited
banking type services including mutual banks, unions of credit and building of society. These
types of service are often identified as deposit taking institutions. Moreover, several foreign
banks have been also depicted with presence of having retail banking experience. In general, the
banks are required to adhere to the Banking Act 1959 in order to get the license for banking.
Moreover, the foreign banks need to maintain the license through several branches in Australia
which are incorporated as foreign subsidiary banks and complying with religious charitable
development funds and several types of other requirement for license. It needs to be also
understood that Australia is comprised of a sophisticated, profitable and competitive financial
sector along with the strong regulatory system. In the last decade, Commonwealth Bank was
ranked first by Bloomberg with a total riskless adjusted ratio of 18%. Westpac bank on the other
5
BUSINESS FINANCE
hand is determined to be having 11% of riskless return. Similarly, Australia and New Zealand
bank is identified with 8.7% of riskless return ranking (Rebello 2016).
2. Calculation and analysis of performance ratios
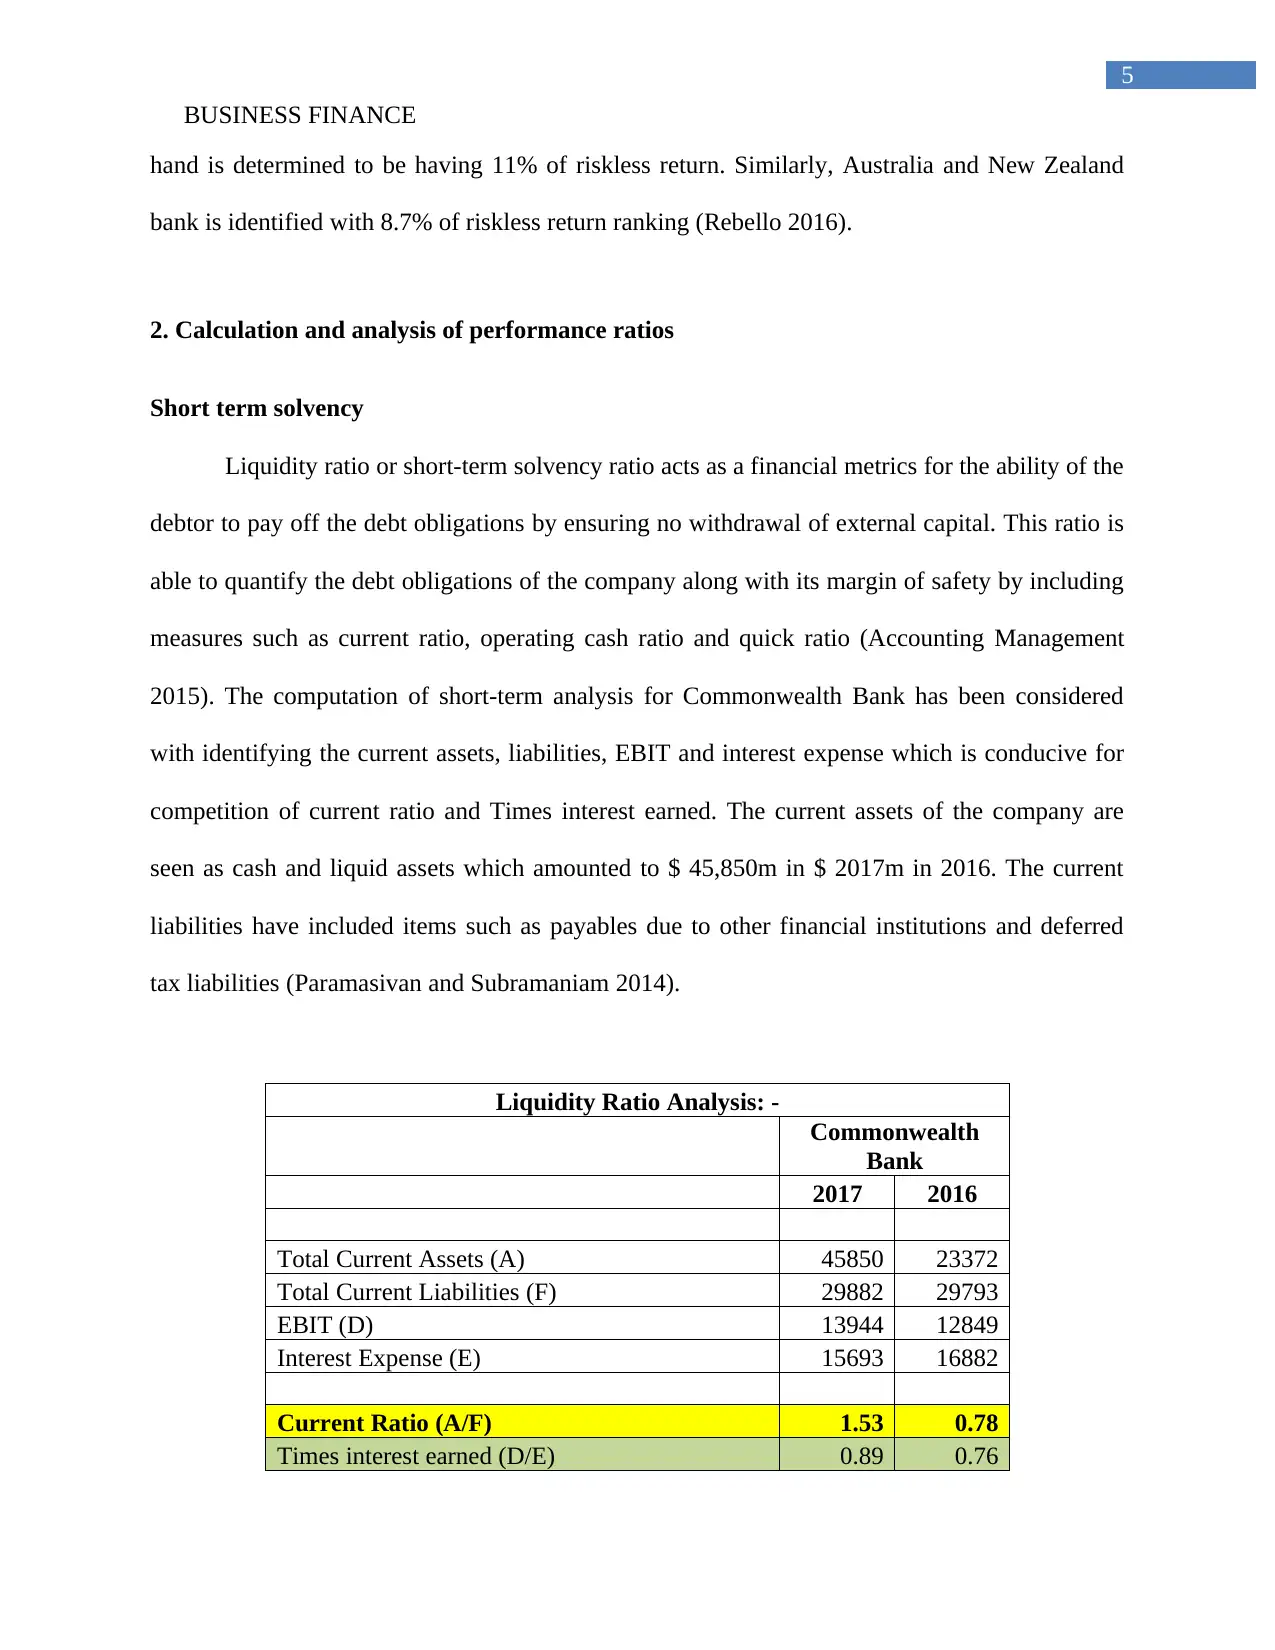
Short term solvency
Liquidity ratio or short-term solvency ratio acts as a financial metrics for the ability of the
debtor to pay off the debt obligations by ensuring no withdrawal of external capital. This ratio is
able to quantify the debt obligations of the company along with its margin of safety by including
measures such as current ratio, operating cash ratio and quick ratio (Accounting Management
2015). The computation of short-term analysis for Commonwealth Bank has been considered
with identifying the current assets, liabilities, EBIT and interest expense which is conducive for
competition of current ratio and Times interest earned. The current assets of the company are
seen as cash and liquid assets which amounted to $ 45,850m in $ 2017m in 2016. The current
liabilities have included items such as payables due to other financial institutions and deferred
tax liabilities (Paramasivan and Subramaniam 2014).
Liquidity Ratio Analysis: -
Commonwealth
Bank
2017 2016
Total Current Assets (A) 45850 23372
Total Current Liabilities (F) 29882 29793
EBIT (D) 13944 12849
Interest Expense (E) 15693 16882
Current Ratio (A/F) 1.53 0.78
Times interest earned (D/E) 0.89 0.76
BUSINESS FINANCE
hand is determined to be having 11% of riskless return. Similarly, Australia and New Zealand
bank is identified with 8.7% of riskless return ranking (Rebello 2016).
2. Calculation and analysis of performance ratios
Short term solvency
Liquidity ratio or short-term solvency ratio acts as a financial metrics for the ability of the
debtor to pay off the debt obligations by ensuring no withdrawal of external capital. This ratio is
able to quantify the debt obligations of the company along with its margin of safety by including
measures such as current ratio, operating cash ratio and quick ratio (Accounting Management
2015). The computation of short-term analysis for Commonwealth Bank has been considered
with identifying the current assets, liabilities, EBIT and interest expense which is conducive for
competition of current ratio and Times interest earned. The current assets of the company are
seen as cash and liquid assets which amounted to $ 45,850m in $ 2017m in 2016. The current
liabilities have included items such as payables due to other financial institutions and deferred
tax liabilities (Paramasivan and Subramaniam 2014).
Liquidity Ratio Analysis: -
Commonwealth
Bank
2017 2016
Total Current Assets (A) 45850 23372
Total Current Liabilities (F) 29882 29793
EBIT (D) 13944 12849
Interest Expense (E) 15693 16882
Current Ratio (A/F) 1.53 0.78
Times interest earned (D/E) 0.89 0.76
⊘ This is a preview!⊘
Do you want full access?
Subscribe today to unlock all pages.
Trusted by 1+ million students worldwide
6
BUSINESS FINANCE
Table 1: Liquidity Ratio Analysis of Commonwealth Bank
(Source: Commbank.com.au. 2018)
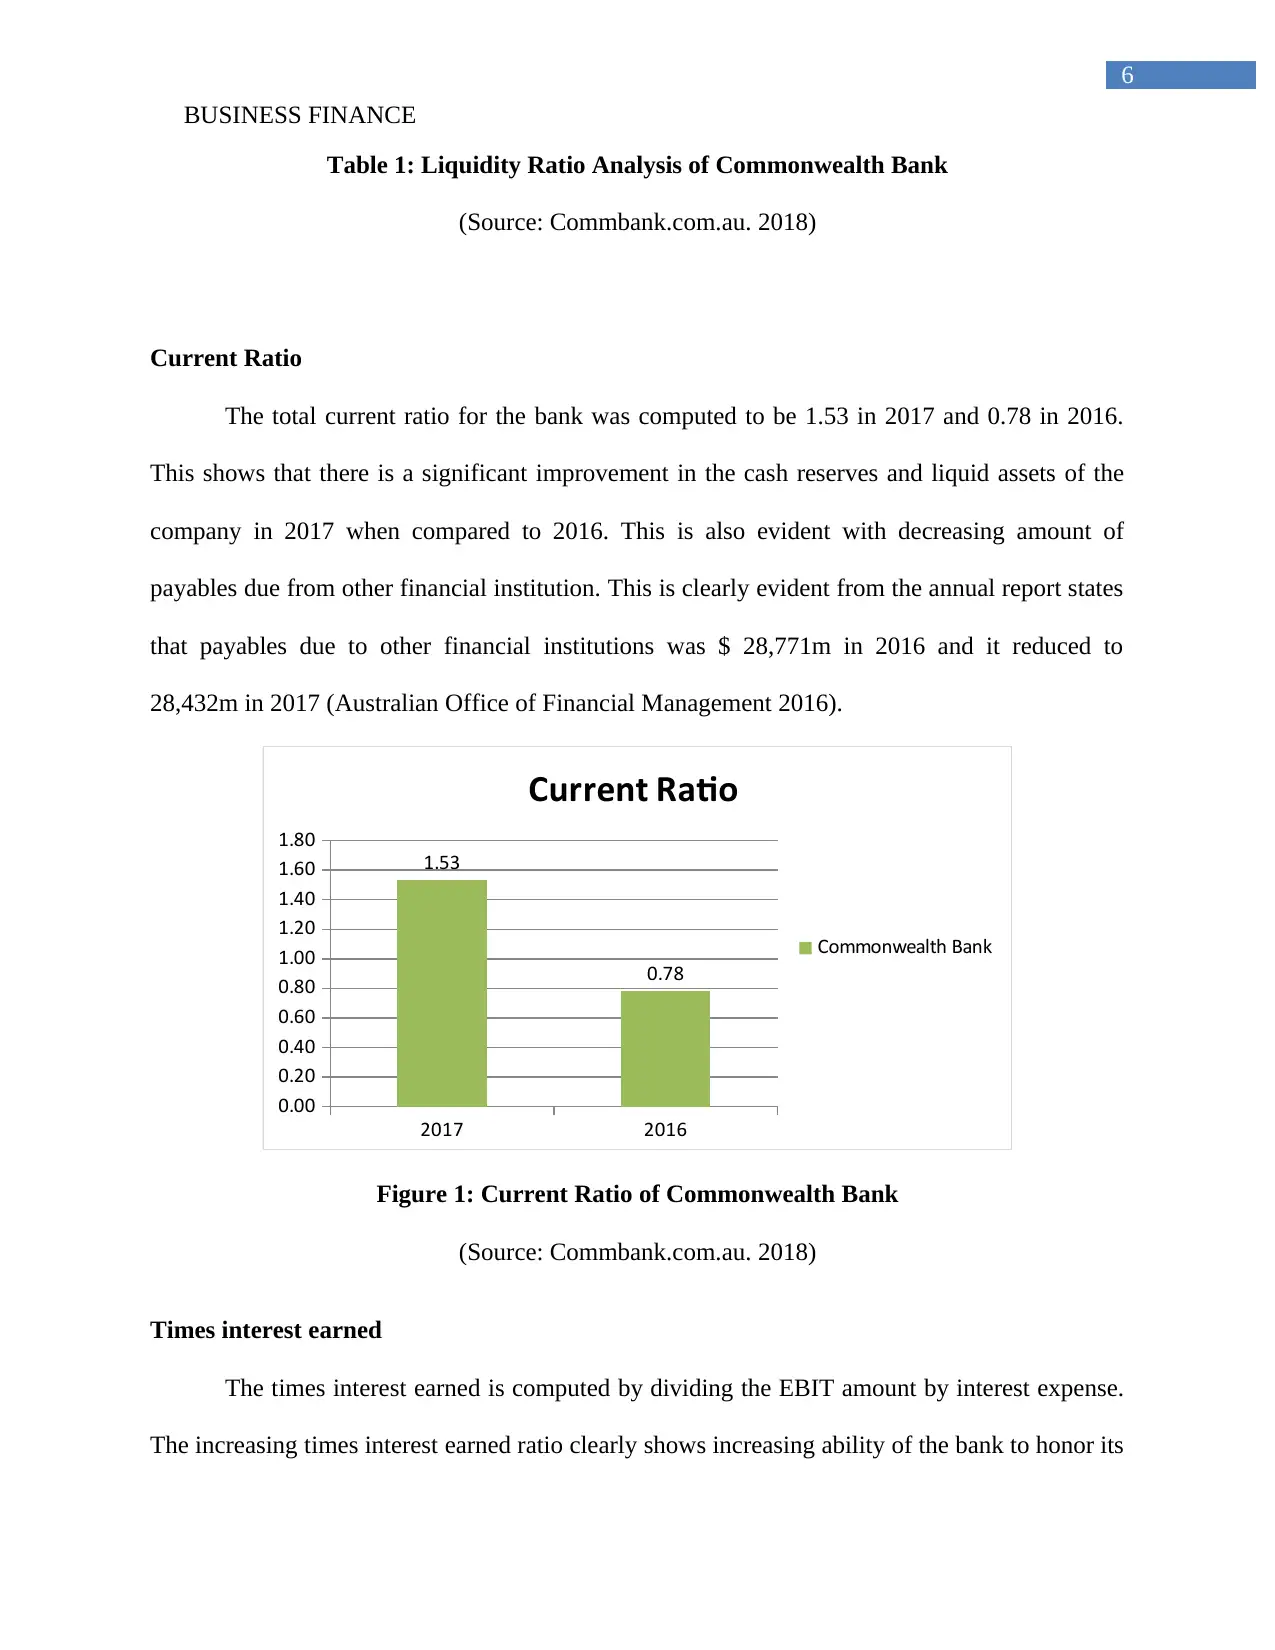
Current Ratio
The total current ratio for the bank was computed to be 1.53 in 2017 and 0.78 in 2016.
This shows that there is a significant improvement in the cash reserves and liquid assets of the
company in 2017 when compared to 2016. This is also evident with decreasing amount of
payables due from other financial institution. This is clearly evident from the annual report states
that payables due to other financial institutions was $ 28,771m in 2016 and it reduced to
28,432m in 2017 (Australian Office of Financial Management 2016).
2017 2016
0.00
0.20
0.40
0.60
0.80
1.00
1.20
1.40
1.60
1.80
1.53
0.78
Current Ratio
Commonwealth Bank
Figure 1: Current Ratio of Commonwealth Bank
(Source: Commbank.com.au. 2018)
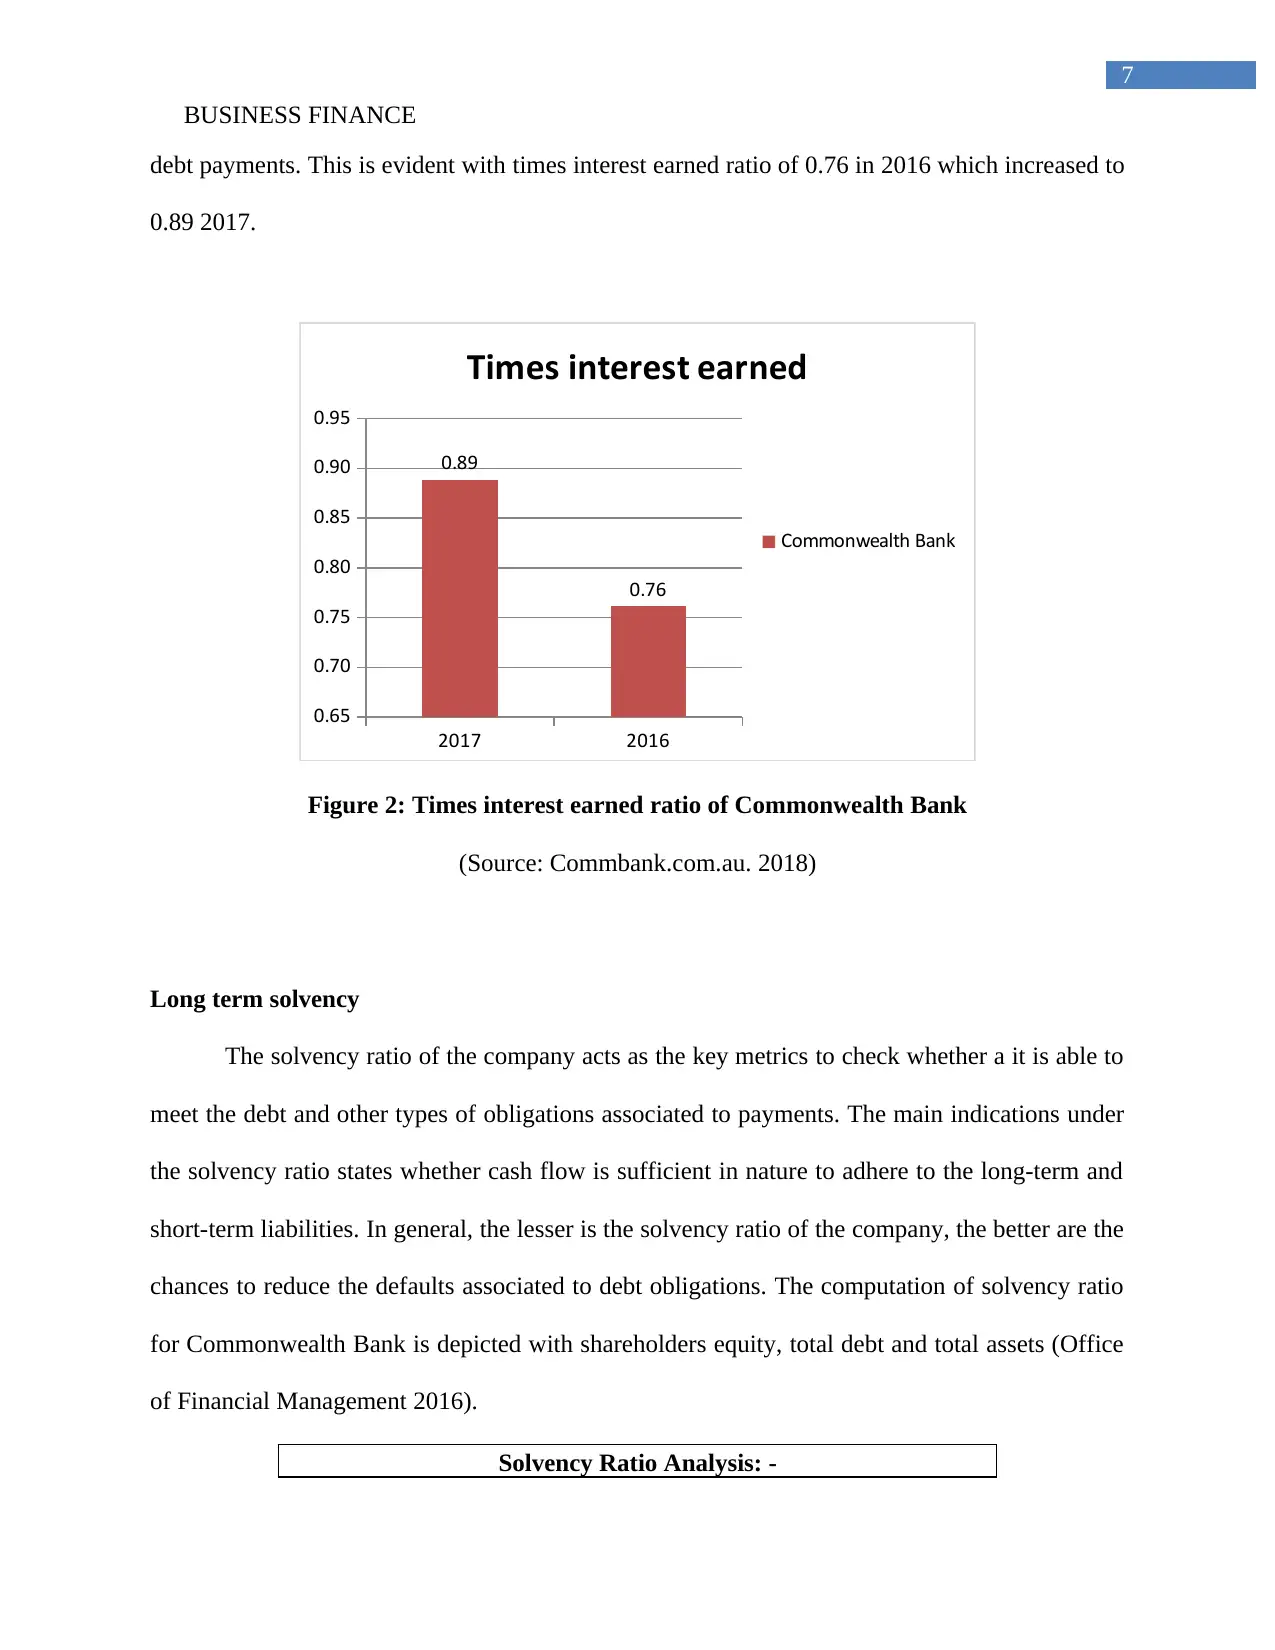
Times interest earned
The times interest earned is computed by dividing the EBIT amount by interest expense.
The increasing times interest earned ratio clearly shows increasing ability of the bank to honor its
BUSINESS FINANCE
Table 1: Liquidity Ratio Analysis of Commonwealth Bank
(Source: Commbank.com.au. 2018)
Current Ratio
The total current ratio for the bank was computed to be 1.53 in 2017 and 0.78 in 2016.
This shows that there is a significant improvement in the cash reserves and liquid assets of the
company in 2017 when compared to 2016. This is also evident with decreasing amount of
payables due from other financial institution. This is clearly evident from the annual report states
that payables due to other financial institutions was $ 28,771m in 2016 and it reduced to
28,432m in 2017 (Australian Office of Financial Management 2016).
2017 2016
0.00
0.20
0.40
0.60
0.80
1.00
1.20
1.40
1.60
1.80
1.53
0.78
Current Ratio
Commonwealth Bank
Figure 1: Current Ratio of Commonwealth Bank
(Source: Commbank.com.au. 2018)
Times interest earned
The times interest earned is computed by dividing the EBIT amount by interest expense.
The increasing times interest earned ratio clearly shows increasing ability of the bank to honor its
Paraphrase This Document
Need a fresh take? Get an instant paraphrase of this document with our AI Paraphraser
7
BUSINESS FINANCE
debt payments. This is evident with times interest earned ratio of 0.76 in 2016 which increased to
0.89 2017.
2017 2016
0.65
0.70
0.75
0.80
0.85
0.90
0.95
0.89
0.76
Times interest earned
Commonwealth Bank
Figure 2: Times interest earned ratio of Commonwealth Bank
(Source: Commbank.com.au. 2018)
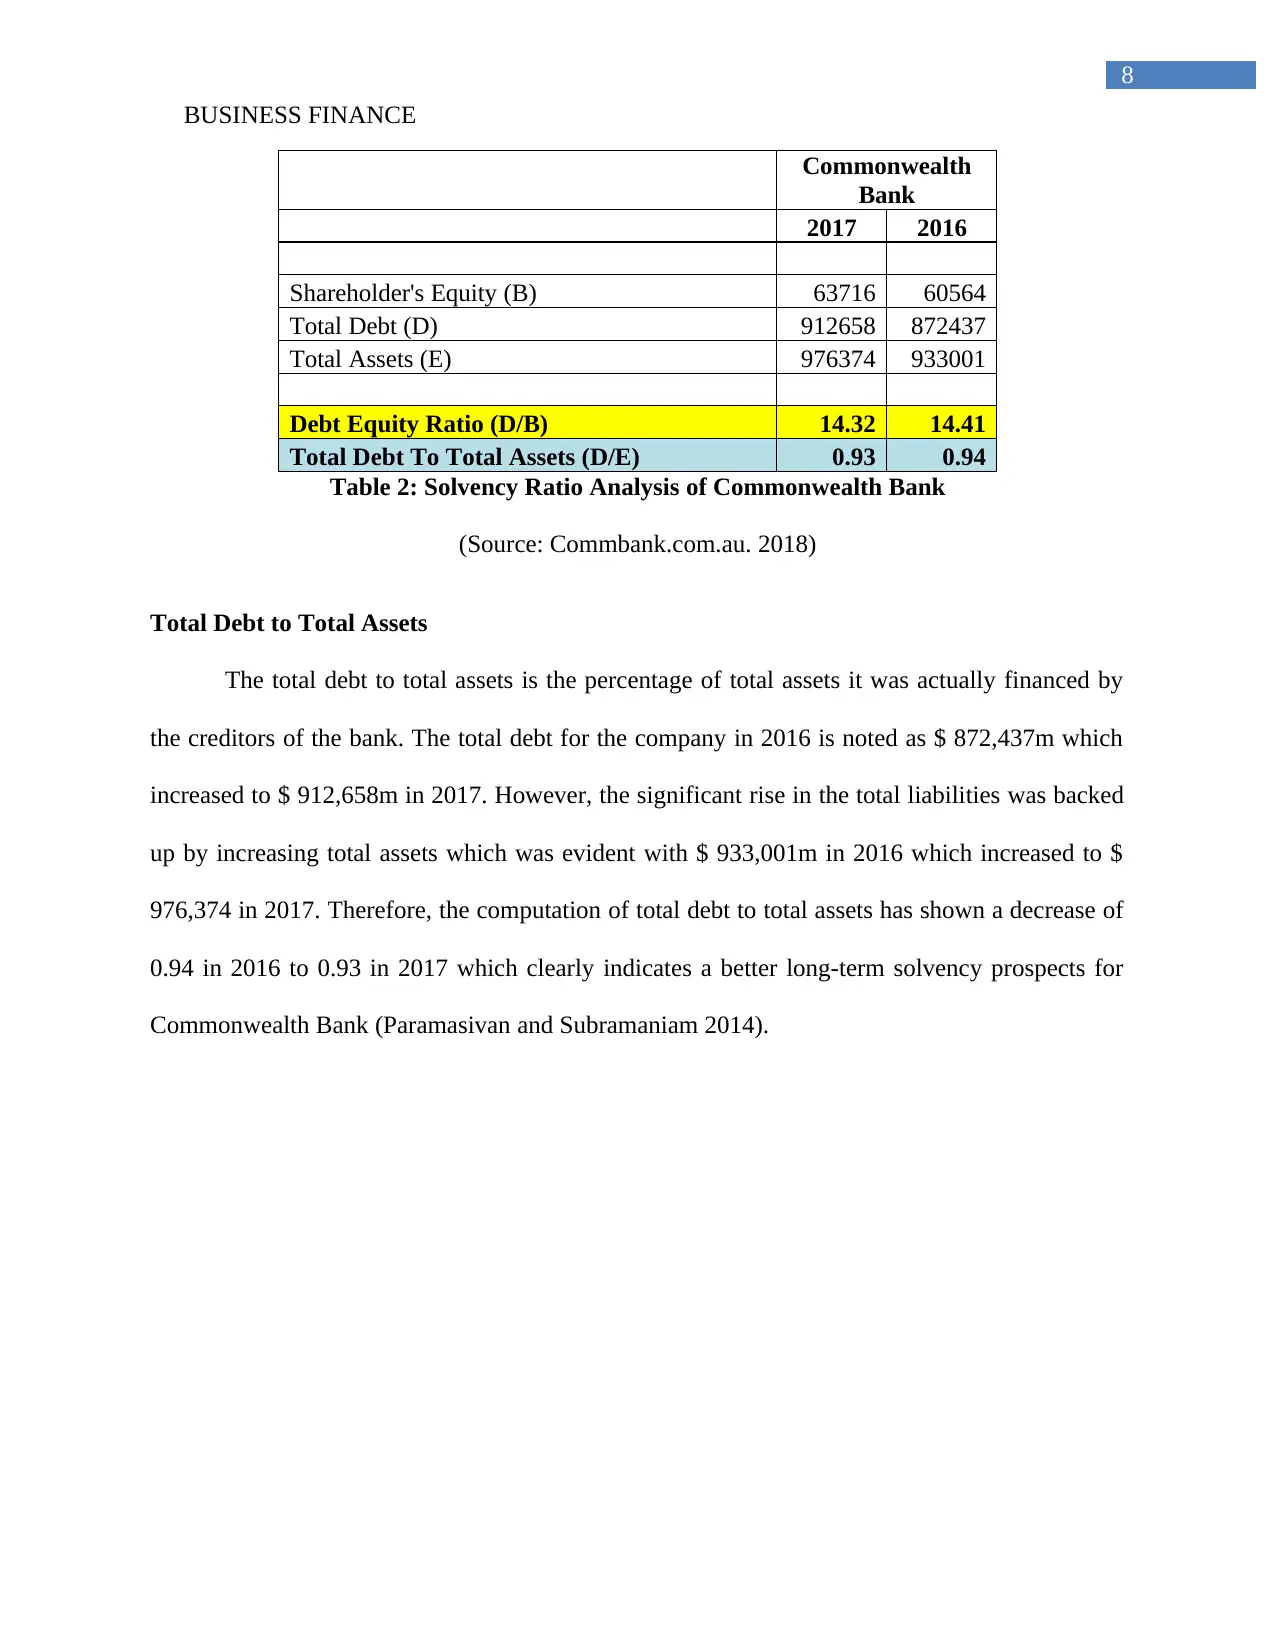
Long term solvency
The solvency ratio of the company acts as the key metrics to check whether a it is able to
meet the debt and other types of obligations associated to payments. The main indications under
the solvency ratio states whether cash flow is sufficient in nature to adhere to the long-term and
short-term liabilities. In general, the lesser is the solvency ratio of the company, the better are the
chances to reduce the defaults associated to debt obligations. The computation of solvency ratio
for Commonwealth Bank is depicted with shareholders equity, total debt and total assets (Office
of Financial Management 2016).
Solvency Ratio Analysis: -
BUSINESS FINANCE
debt payments. This is evident with times interest earned ratio of 0.76 in 2016 which increased to
0.89 2017.
2017 2016
0.65
0.70
0.75
0.80
0.85
0.90
0.95
0.89
0.76
Times interest earned
Commonwealth Bank
Figure 2: Times interest earned ratio of Commonwealth Bank
(Source: Commbank.com.au. 2018)
Long term solvency
The solvency ratio of the company acts as the key metrics to check whether a it is able to
meet the debt and other types of obligations associated to payments. The main indications under
the solvency ratio states whether cash flow is sufficient in nature to adhere to the long-term and
short-term liabilities. In general, the lesser is the solvency ratio of the company, the better are the
chances to reduce the defaults associated to debt obligations. The computation of solvency ratio
for Commonwealth Bank is depicted with shareholders equity, total debt and total assets (Office
of Financial Management 2016).
Solvency Ratio Analysis: -
8
BUSINESS FINANCE
Commonwealth
Bank
2017 2016
Shareholder's Equity (B) 63716 60564
Total Debt (D) 912658 872437
Total Assets (E) 976374 933001
Debt Equity Ratio (D/B) 14.32 14.41
Total Debt To Total Assets (D/E) 0.93 0.94
Table 2: Solvency Ratio Analysis of Commonwealth Bank
(Source: Commbank.com.au. 2018)
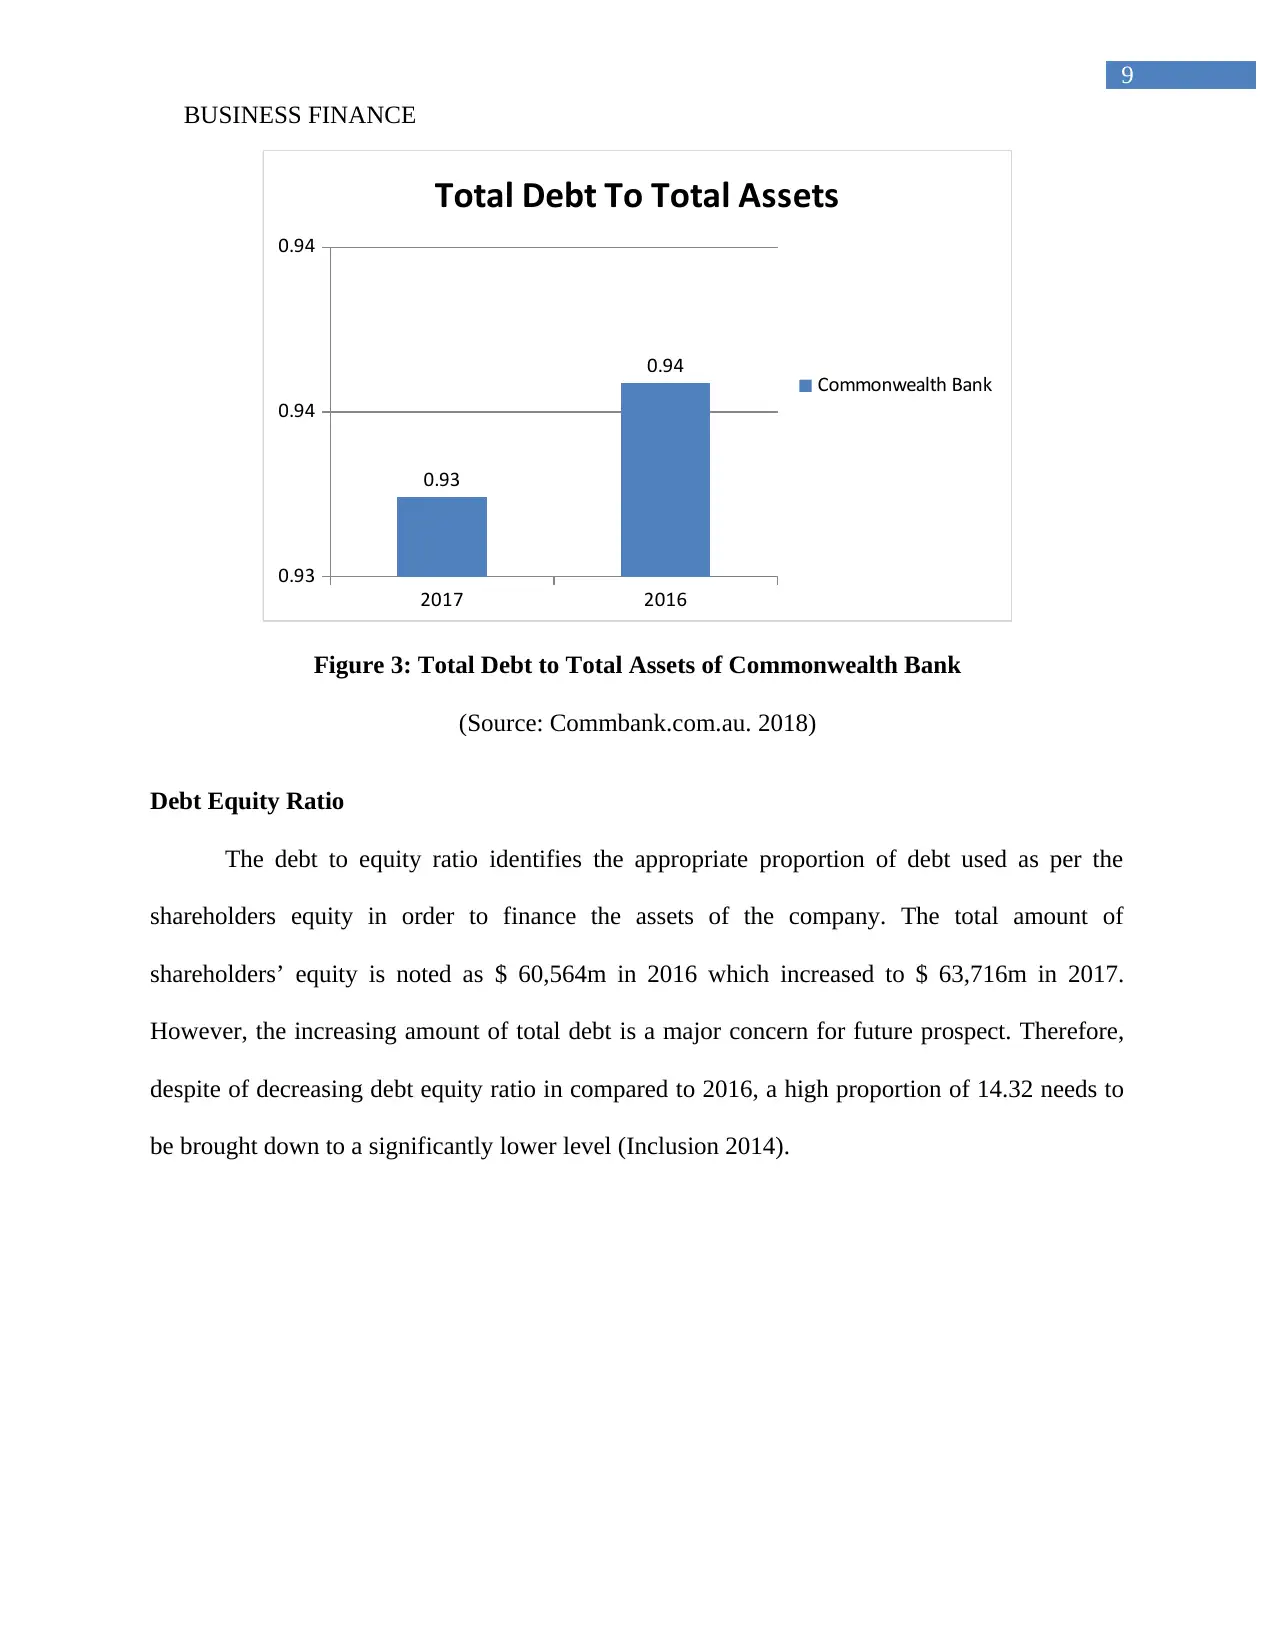
Total Debt to Total Assets
The total debt to total assets is the percentage of total assets it was actually financed by
the creditors of the bank. The total debt for the company in 2016 is noted as $ 872,437m which
increased to $ 912,658m in 2017. However, the significant rise in the total liabilities was backed
up by increasing total assets which was evident with $ 933,001m in 2016 which increased to $
976,374 in 2017. Therefore, the computation of total debt to total assets has shown a decrease of
0.94 in 2016 to 0.93 in 2017 which clearly indicates a better long-term solvency prospects for
Commonwealth Bank (Paramasivan and Subramaniam 2014).
BUSINESS FINANCE
Commonwealth
Bank
2017 2016
Shareholder's Equity (B) 63716 60564
Total Debt (D) 912658 872437
Total Assets (E) 976374 933001
Debt Equity Ratio (D/B) 14.32 14.41
Total Debt To Total Assets (D/E) 0.93 0.94
Table 2: Solvency Ratio Analysis of Commonwealth Bank
(Source: Commbank.com.au. 2018)
Total Debt to Total Assets
The total debt to total assets is the percentage of total assets it was actually financed by
the creditors of the bank. The total debt for the company in 2016 is noted as $ 872,437m which
increased to $ 912,658m in 2017. However, the significant rise in the total liabilities was backed
up by increasing total assets which was evident with $ 933,001m in 2016 which increased to $
976,374 in 2017. Therefore, the computation of total debt to total assets has shown a decrease of
0.94 in 2016 to 0.93 in 2017 which clearly indicates a better long-term solvency prospects for
Commonwealth Bank (Paramasivan and Subramaniam 2014).
⊘ This is a preview!⊘
Do you want full access?
Subscribe today to unlock all pages.
Trusted by 1+ million students worldwide
9
BUSINESS FINANCE
2017 2016
0.93
0.94
0.94
0.93
0.94
Total Debt To Total Assets
Commonwealth Bank
Figure 3: Total Debt to Total Assets of Commonwealth Bank
(Source: Commbank.com.au. 2018)
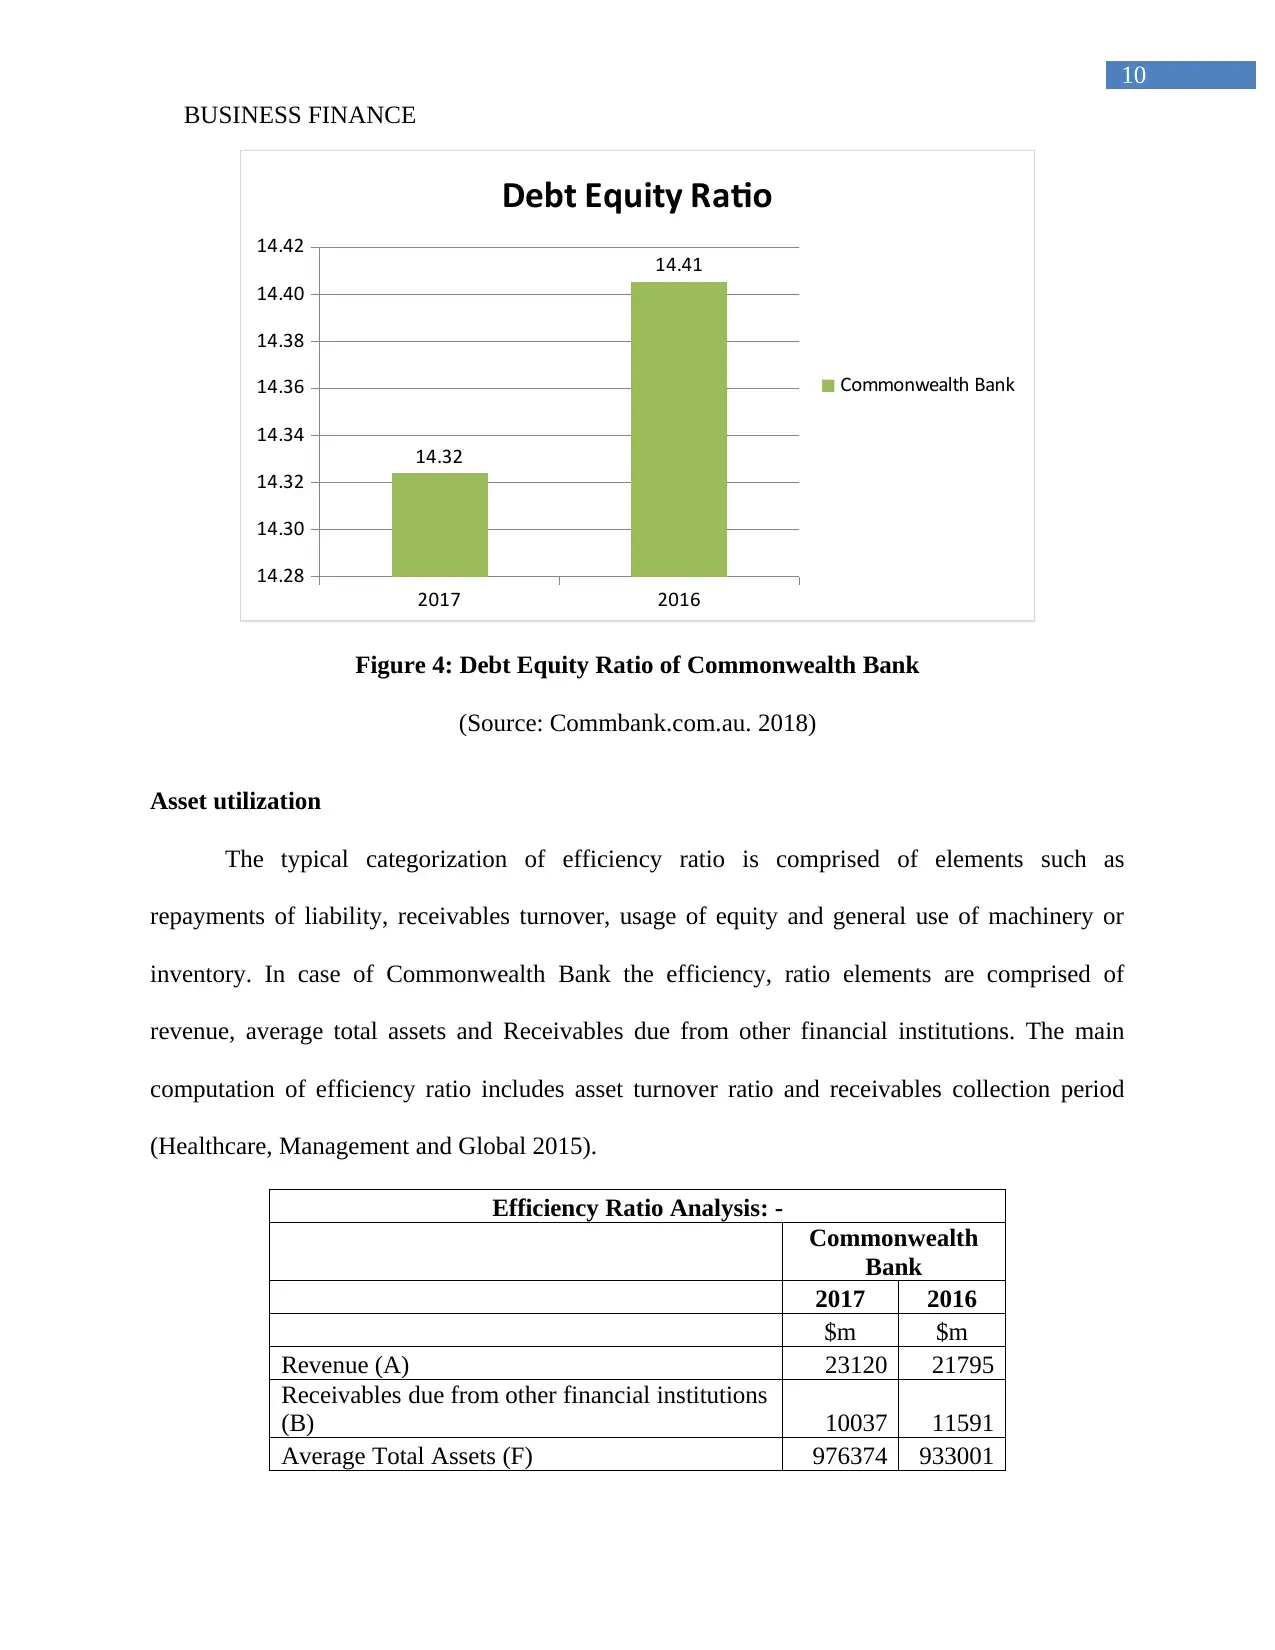
Debt Equity Ratio
The debt to equity ratio identifies the appropriate proportion of debt used as per the
shareholders equity in order to finance the assets of the company. The total amount of
shareholders’ equity is noted as $ 60,564m in 2016 which increased to $ 63,716m in 2017.
However, the increasing amount of total debt is a major concern for future prospect. Therefore,
despite of decreasing debt equity ratio in compared to 2016, a high proportion of 14.32 needs to
be brought down to a significantly lower level (Inclusion 2014).
BUSINESS FINANCE
2017 2016
0.93
0.94
0.94
0.93
0.94
Total Debt To Total Assets
Commonwealth Bank
Figure 3: Total Debt to Total Assets of Commonwealth Bank
(Source: Commbank.com.au. 2018)
Debt Equity Ratio
The debt to equity ratio identifies the appropriate proportion of debt used as per the
shareholders equity in order to finance the assets of the company. The total amount of
shareholders’ equity is noted as $ 60,564m in 2016 which increased to $ 63,716m in 2017.
However, the increasing amount of total debt is a major concern for future prospect. Therefore,
despite of decreasing debt equity ratio in compared to 2016, a high proportion of 14.32 needs to
be brought down to a significantly lower level (Inclusion 2014).
Paraphrase This Document
Need a fresh take? Get an instant paraphrase of this document with our AI Paraphraser
10
BUSINESS FINANCE
2017 2016
14.28
14.30
14.32
14.34
14.36
14.38
14.40
14.42
14.32
14.41
Debt Equity Ratio
Commonwealth Bank
Figure 4: Debt Equity Ratio of Commonwealth Bank
(Source: Commbank.com.au. 2018)
Asset utilization
The typical categorization of efficiency ratio is comprised of elements such as
repayments of liability, receivables turnover, usage of equity and general use of machinery or
inventory. In case of Commonwealth Bank the efficiency, ratio elements are comprised of
revenue, average total assets and Receivables due from other financial institutions. The main
computation of efficiency ratio includes asset turnover ratio and receivables collection period
(Healthcare, Management and Global 2015).
Efficiency Ratio Analysis: -
Commonwealth
Bank
2017 2016
$m $m
Revenue (A) 23120 21795
Receivables due from other financial institutions
(B) 10037 11591
Average Total Assets (F) 976374 933001
11
BUSINESS FINANCE
Assets turnover (A/F) 0.024 0.023
Receivables Collection Period (365/(A/B)) 158 194
Table 3: Efficiency Ratio Analysis of Commonwealth Bank
(Source: Commbank.com.au. 2018)
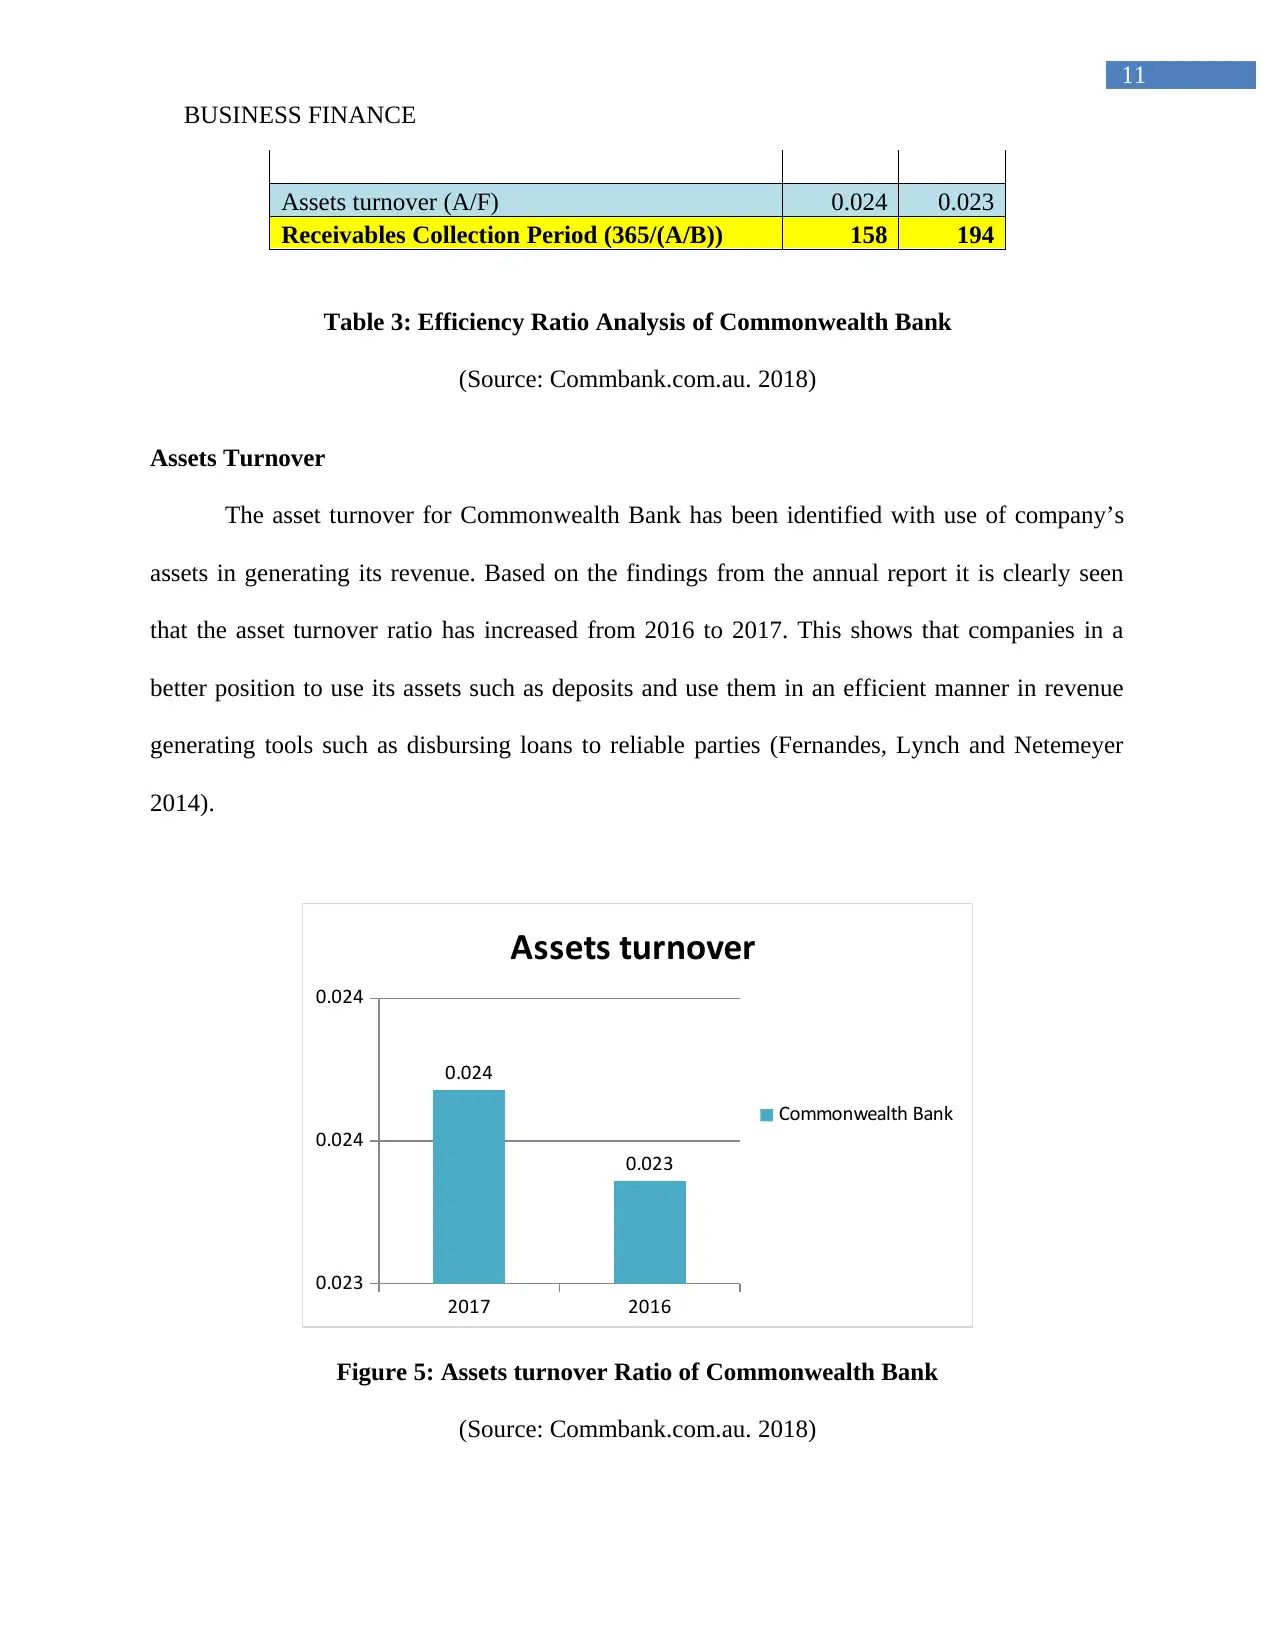
Assets Turnover
The asset turnover for Commonwealth Bank has been identified with use of company’s
assets in generating its revenue. Based on the findings from the annual report it is clearly seen
that the asset turnover ratio has increased from 2016 to 2017. This shows that companies in a
better position to use its assets such as deposits and use them in an efficient manner in revenue
generating tools such as disbursing loans to reliable parties (Fernandes, Lynch and Netemeyer
2014).
2017 2016
0.023
0.024
0.024
0.024
0.023
Assets turnover
Commonwealth Bank
Figure 5: Assets turnover Ratio of Commonwealth Bank
(Source: Commbank.com.au. 2018)
BUSINESS FINANCE
Assets turnover (A/F) 0.024 0.023
Receivables Collection Period (365/(A/B)) 158 194
Table 3: Efficiency Ratio Analysis of Commonwealth Bank
(Source: Commbank.com.au. 2018)
Assets Turnover
The asset turnover for Commonwealth Bank has been identified with use of company’s
assets in generating its revenue. Based on the findings from the annual report it is clearly seen
that the asset turnover ratio has increased from 2016 to 2017. This shows that companies in a
better position to use its assets such as deposits and use them in an efficient manner in revenue
generating tools such as disbursing loans to reliable parties (Fernandes, Lynch and Netemeyer
2014).
2017 2016
0.023
0.024
0.024
0.024
0.023
Assets turnover
Commonwealth Bank
Figure 5: Assets turnover Ratio of Commonwealth Bank
(Source: Commbank.com.au. 2018)
⊘ This is a preview!⊘
Do you want full access?
Subscribe today to unlock all pages.
Trusted by 1+ million students worldwide
1 out of 26
Related Documents


Your All-in-One AI-Powered Toolkit for Academic Success.
+13062052269
info@desklib.com
Available 24*7 on WhatsApp / Email
![[object Object]](/_next/static/media/star-bottom.7253800d.svg)
Unlock your academic potential
Copyright © 2020–2026 A2Z Services. All Rights Reserved. Developed and managed by ZUCOL.