HC2091: Medibank vs NIB Holdings Financial Analysis Report 2018
VerifiedAdded on 2023/06/04
|20
|3961
|486
Report
AI Summary
This report presents a comprehensive financial analysis comparing Medibank Private Limited and NIB Holdings Limited, two prominent Australian health insurers. It begins with a description of each company, outlining their core activities and competitive advantages within the insurance industry. The analysis employs various financial ratios, including liquidity, profitability, solvency, and efficiency ratios, to assess and compare their financial performance. Key metrics such as current ratio, net profit margin, return on equity, debt-to-equity ratio, and asset turnover ratio are evaluated. Furthermore, the report includes a share price valuation analysis using the dividend growth model and compares the share price movements against the all-ordinary index. The ultimate goal is to provide financial and investment advice, determining whether investing in these organizations would be beneficial for investors.
Selected Company- Medibank Private Ltd and NIB Holdings Ltd
financial analysis of Medibank private limited and NIB Holding Limited
Financial analysis
University Name-
financial analysis of Medibank private limited and NIB Holding Limited
Financial analysis
University Name-
Paraphrase This Document
Need a fresh take? Get an instant paraphrase of this document with our AI Paraphraser

Table of Contents
Introduction.................................................................................................................................................1
Description of the Reject Shop................................................................................................................1
Core activities of the Reject Shop............................................................................................................1
Competitive advantage............................................................................................................................1
Industry...................................................................................................................................................2
Financial analysis of The Reject Shop..........................................................................................................2
Liquidity ratio...........................................................................................................................................2
Current ratio........................................................................................................................................2
Quick ratio...........................................................................................................................................3
Profitability ratio......................................................................................................................................3
Net profit margin.................................................................................................................................3
Return on equity..................................................................................................................................4
Return on assets-.................................................................................................................................4
Gross profit margin..............................................................................................................................4
Solvency ratio......................................................................................................................................4
Debt to equity......................................................................................................................................5
Efficiency ratio.........................................................................................................................................5
Creditors turnover ratio.......................................................................................................................5
Inventory Turnover ratio.....................................................................................................................6
Assets turnover ratio...........................................................................................................................6
Market ratio (General investment proposal analysis).............................................................................6
Dividend payout ratio..........................................................................................................................7
Evaluation of the key points found in this financial analysis.......................................................................7
Analysis to compare the Share price movement of Reject Shop with all ordinary index.............................7
Computation of the value of the stock of the Reject Shop Company......................................................8
Computation of the dividend growth rate of Reject Shop...................................................................9
Recommendation......................................................................................................................................10
Conclusion.................................................................................................................................................10
References.................................................................................................................................................11
Appendix...................................................................................................................................................13
Introduction
With the ramified financial market factors, each and every investor needs to use financial
analysis tools before investing their capital in the particular stocks and shares. In this report,
financial analysis of Medibank private limited and NIB Holding Limited has been take into
consideration to analyses and compare the financial performance, share valuation and capital
structure of these two companies. In the starting of this report, description of both companies,
their competitive advantages and core activities have been discussed. After that financial ratio
analysis has been used to identify the ups and down in the financial performance of company.
Afterward, share price valuation analysis has been done by using the dividend growth models so
that the share price value of company could be assessed. In the end , share price comparison of
the company with another and all ordinary stock exchange have been done so that it could be
determined whether investing capital in organization would be beneficial for the investors to
create value on its investment or not. There are several financial analysis tools have been used
such as Du pont analysis, capital budgeting, dividend growth model, ratio analysis and share
price valuation methods to determine whether company has been creating value on the invested
capital of the investors or not.
Description of the Medibank and NIB Holding Limited
The Medibank Private limited is the Australian national private health insurer which has been
offering its banking and insurance services to its clients throughout the time. It is the second
largest health insurance service provider after BUPA. It has covered at least 29.1% market share
in the insurance industry of the Australia. This company has created value on its investment by
offering insurance services to its clients. Currently, all the shares of company are traded at AUD
$ 3.3 which is 12% higher as compared to last year data.
⊘ This is a preview!⊘
Do you want full access?
Subscribe today to unlock all pages.
Trusted by 1+ million students worldwide
On the other hand, NIB holding Limited is also one of the health insurer which offers health
insurance and financial services to clients. It has increased its capital investment by 20% with a
view to cover more market share in the insurance sector of the Australia.
Core activities of the Medibank Private Limited
The core activity of Medibank is to provide insurance services to clients so that they could their
health insurance from the most trusted brands.
Competitive advantage
The main competitive advantage of Medibank Organizaiton is related to its health
insurance services. it has been providing unique health insurance services at very low cost which
will help clients to avail these health services at very least cost. It will assist company to grab
more market share.
Industry
The Medibank is indulged in offering its health insurance to its clients in insurance and financial
sectors with the increase in the GDP rate of the Australia; it would be positive factor for the
Medibank to strengthen its overall turnover and market share.
Financial analysis of Medibank private Limited
The financial analysis of Medibank private Limited is used to evaluate the liquidity, profitability,
efficiency and market ratio of company and how well it has performed throughout the time.
Liquidity ratio
The liquidity ratio is used to measure how well company could pay off its long term and short
term liabilities out of its available current assets investment. This ratio has been divided into two
main parts.
Current ratio
The current
Paraphrase This Document
Need a fresh take? Get an instant paraphrase of this document with our AI Paraphraser
Descriptio
n Formula MEDIBANK PRIVATE LTD (Ratio Analysis )
2015` 2016 2017
NIB Holding
Company
Current
ratio
Current assets/current
liabilities 0.62 0.32 0.34 0.42
Quick
Ratio
Current
assets-Inventory/current
liabilities 0.62 0.32 0.34 0.39
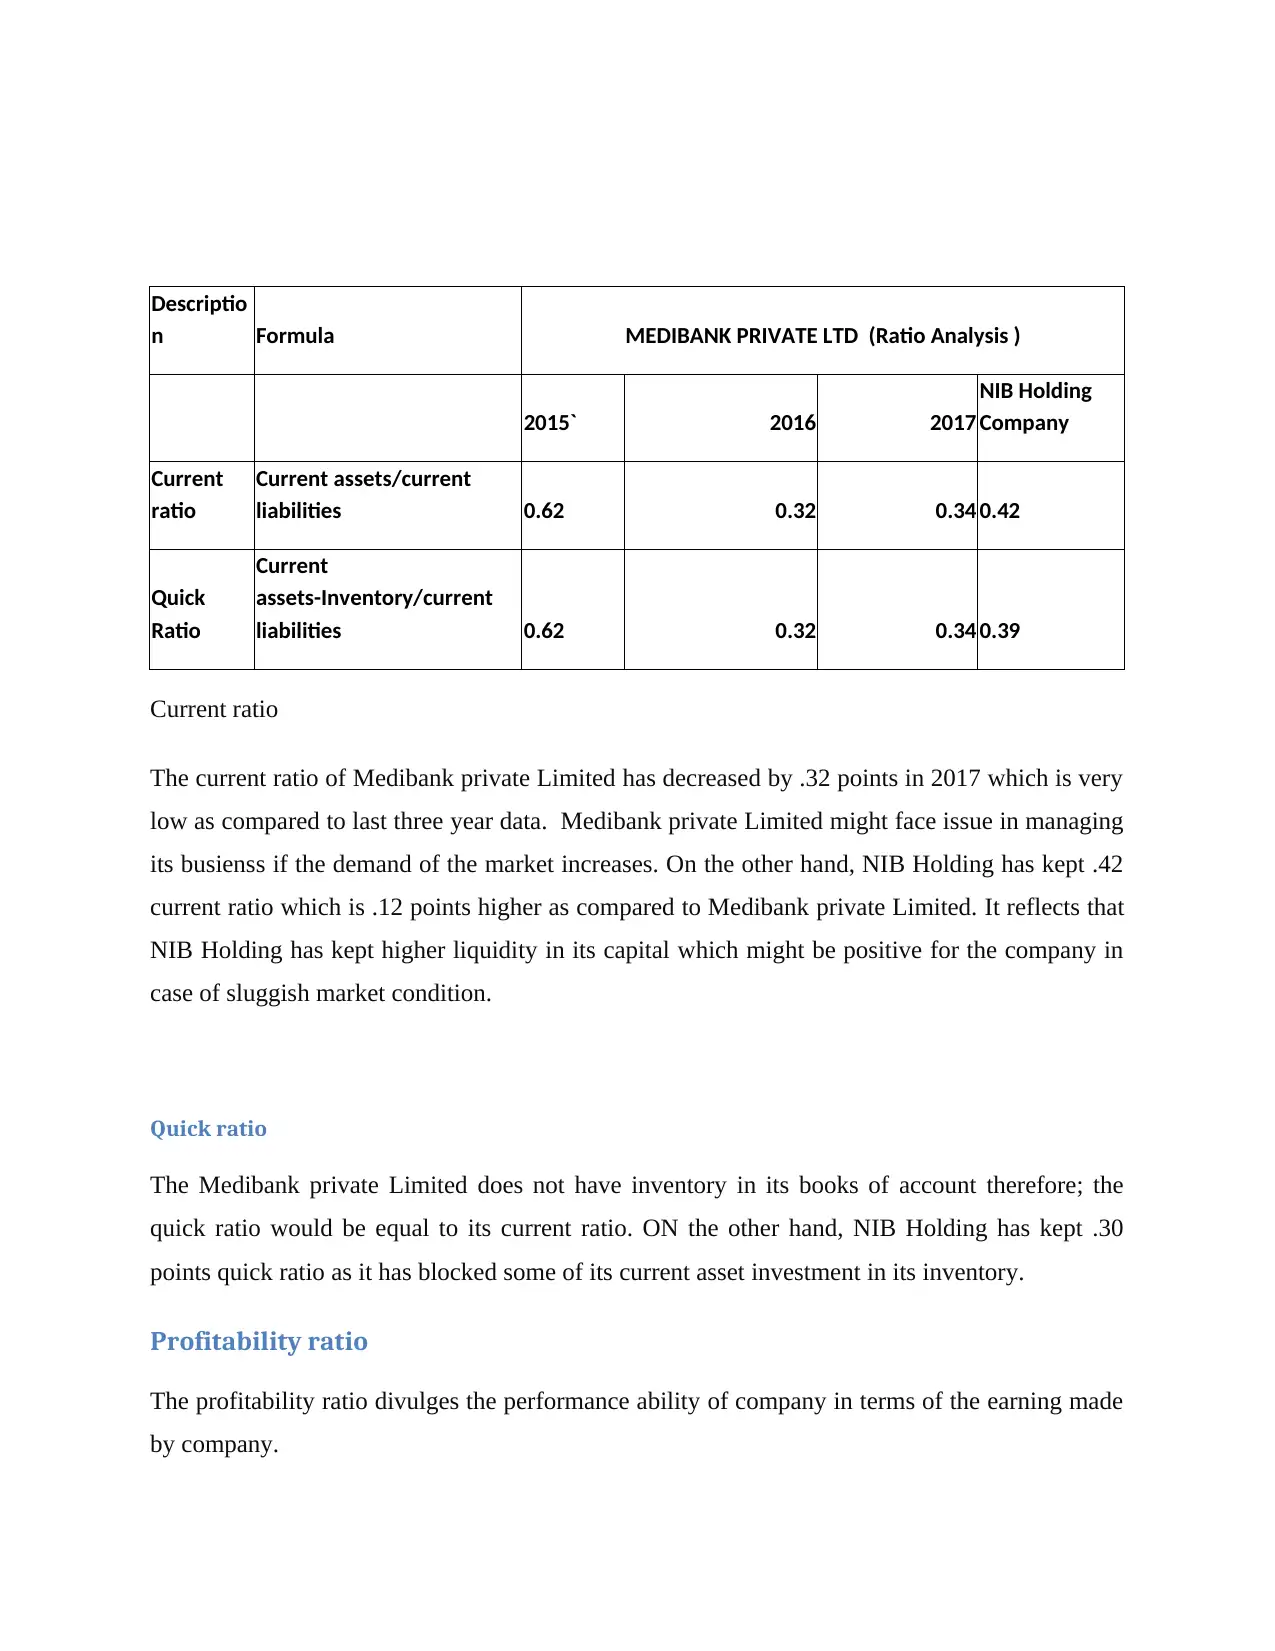
Current ratio
The current ratio of Medibank private Limited has decreased by .32 points in 2017 which is very
low as compared to last three year data. Medibank private Limited might face issue in managing
its busienss if the demand of the market increases. On the other hand, NIB Holding has kept .42
current ratio which is .12 points higher as compared to Medibank private Limited. It reflects that
NIB Holding has kept higher liquidity in its capital which might be positive for the company in
case of sluggish market condition.
Quick ratio
The Medibank private Limited does not have inventory in its books of account therefore; the
quick ratio would be equal to its current ratio. ON the other hand, NIB Holding has kept .30
points quick ratio as it has blocked some of its current asset investment in its inventory.
Profitability ratio
The profitability ratio divulges the performance ability of company in terms of the earning made
by company.
n Formula MEDIBANK PRIVATE LTD (Ratio Analysis )
2015` 2016 2017
NIB Holding
Company
Current
ratio
Current assets/current
liabilities 0.62 0.32 0.34 0.42
Quick
Ratio
Current
assets-Inventory/current
liabilities 0.62 0.32 0.34 0.39
Current ratio
The current ratio of Medibank private Limited has decreased by .32 points in 2017 which is very
low as compared to last three year data. Medibank private Limited might face issue in managing
its busienss if the demand of the market increases. On the other hand, NIB Holding has kept .42
current ratio which is .12 points higher as compared to Medibank private Limited. It reflects that
NIB Holding has kept higher liquidity in its capital which might be positive for the company in
case of sluggish market condition.
Quick ratio
The Medibank private Limited does not have inventory in its books of account therefore; the
quick ratio would be equal to its current ratio. ON the other hand, NIB Holding has kept .30
points quick ratio as it has blocked some of its current asset investment in its inventory.
Profitability ratio
The profitability ratio divulges the performance ability of company in terms of the earning made
by company.
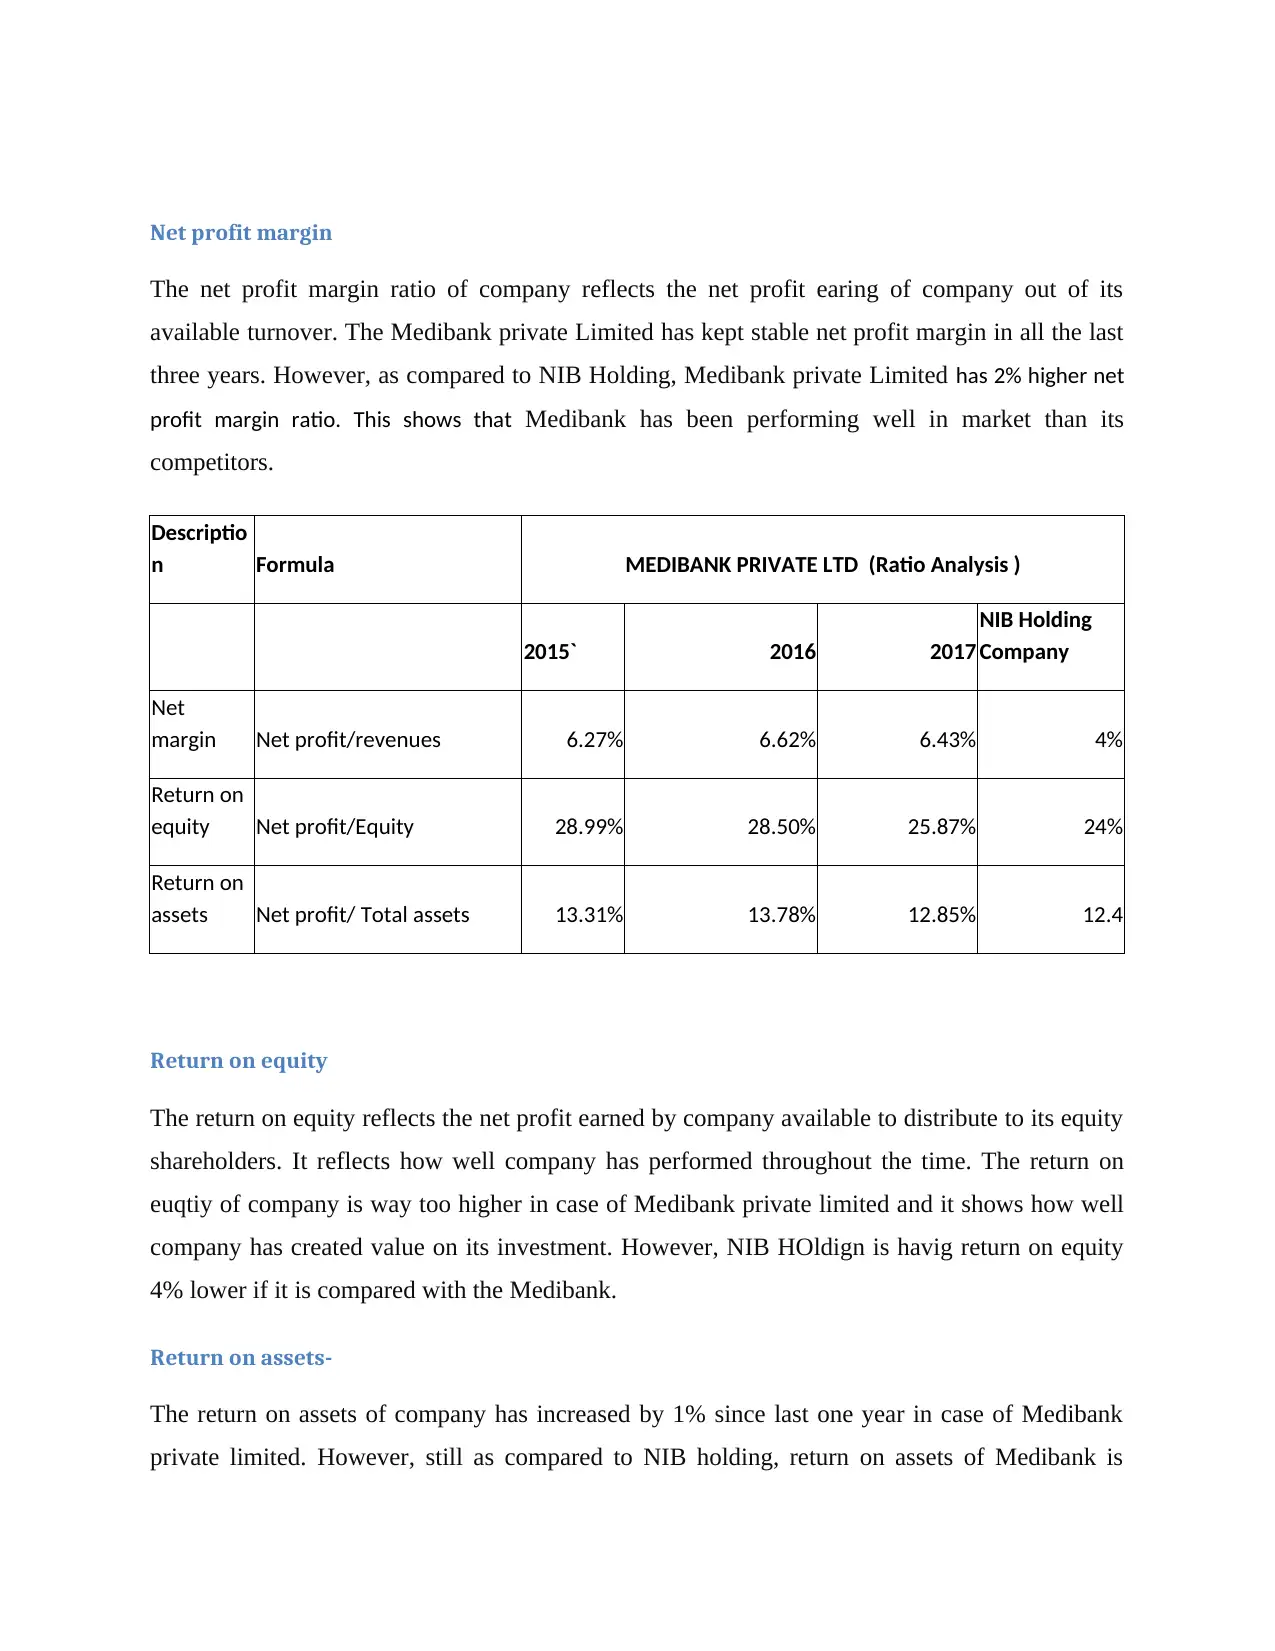
Net profit margin
The net profit margin ratio of company reflects the net profit earing of company out of its
available turnover. The Medibank private Limited has kept stable net profit margin in all the last
three years. However, as compared to NIB Holding, Medibank private Limited has 2% higher net
profit margin ratio. This shows that Medibank has been performing well in market than its
competitors.
Descriptio
n Formula MEDIBANK PRIVATE LTD (Ratio Analysis )
2015` 2016 2017
NIB Holding
Company
Net
margin Net profit/revenues 6.27% 6.62% 6.43% 4%
Return on
equity Net profit/Equity 28.99% 28.50% 25.87% 24%
Return on
assets Net profit/ Total assets 13.31% 13.78% 12.85% 12.4
Return on equity
The return on equity reflects the net profit earned by company available to distribute to its equity
shareholders. It reflects how well company has performed throughout the time. The return on
euqtiy of company is way too higher in case of Medibank private limited and it shows how well
company has created value on its investment. However, NIB HOldign is havig return on equity
4% lower if it is compared with the Medibank.
Return on assets-
The return on assets of company has increased by 1% since last one year in case of Medibank
private limited. However, still as compared to NIB holding, return on assets of Medibank is
⊘ This is a preview!⊘
Do you want full access?
Subscribe today to unlock all pages.
Trusted by 1+ million students worldwide
higher. It reflects that company is consistently increasing its profitability and performing well in
market as compared to others.
Gross profit margin
The gross profit margin of Medibank private limited has increased with the increase in its overall
turnover. However, the gross profit margin has increased to 12% which is 2% higher as
compared to last three year data. On the other hand, NIB Holding has also increased its earning
and kept gross profit margin to 11% in 2017. It reveals that Medibank private limited has
performed well and kept higher profitability as compared to others (Medibank private limited,
2015).
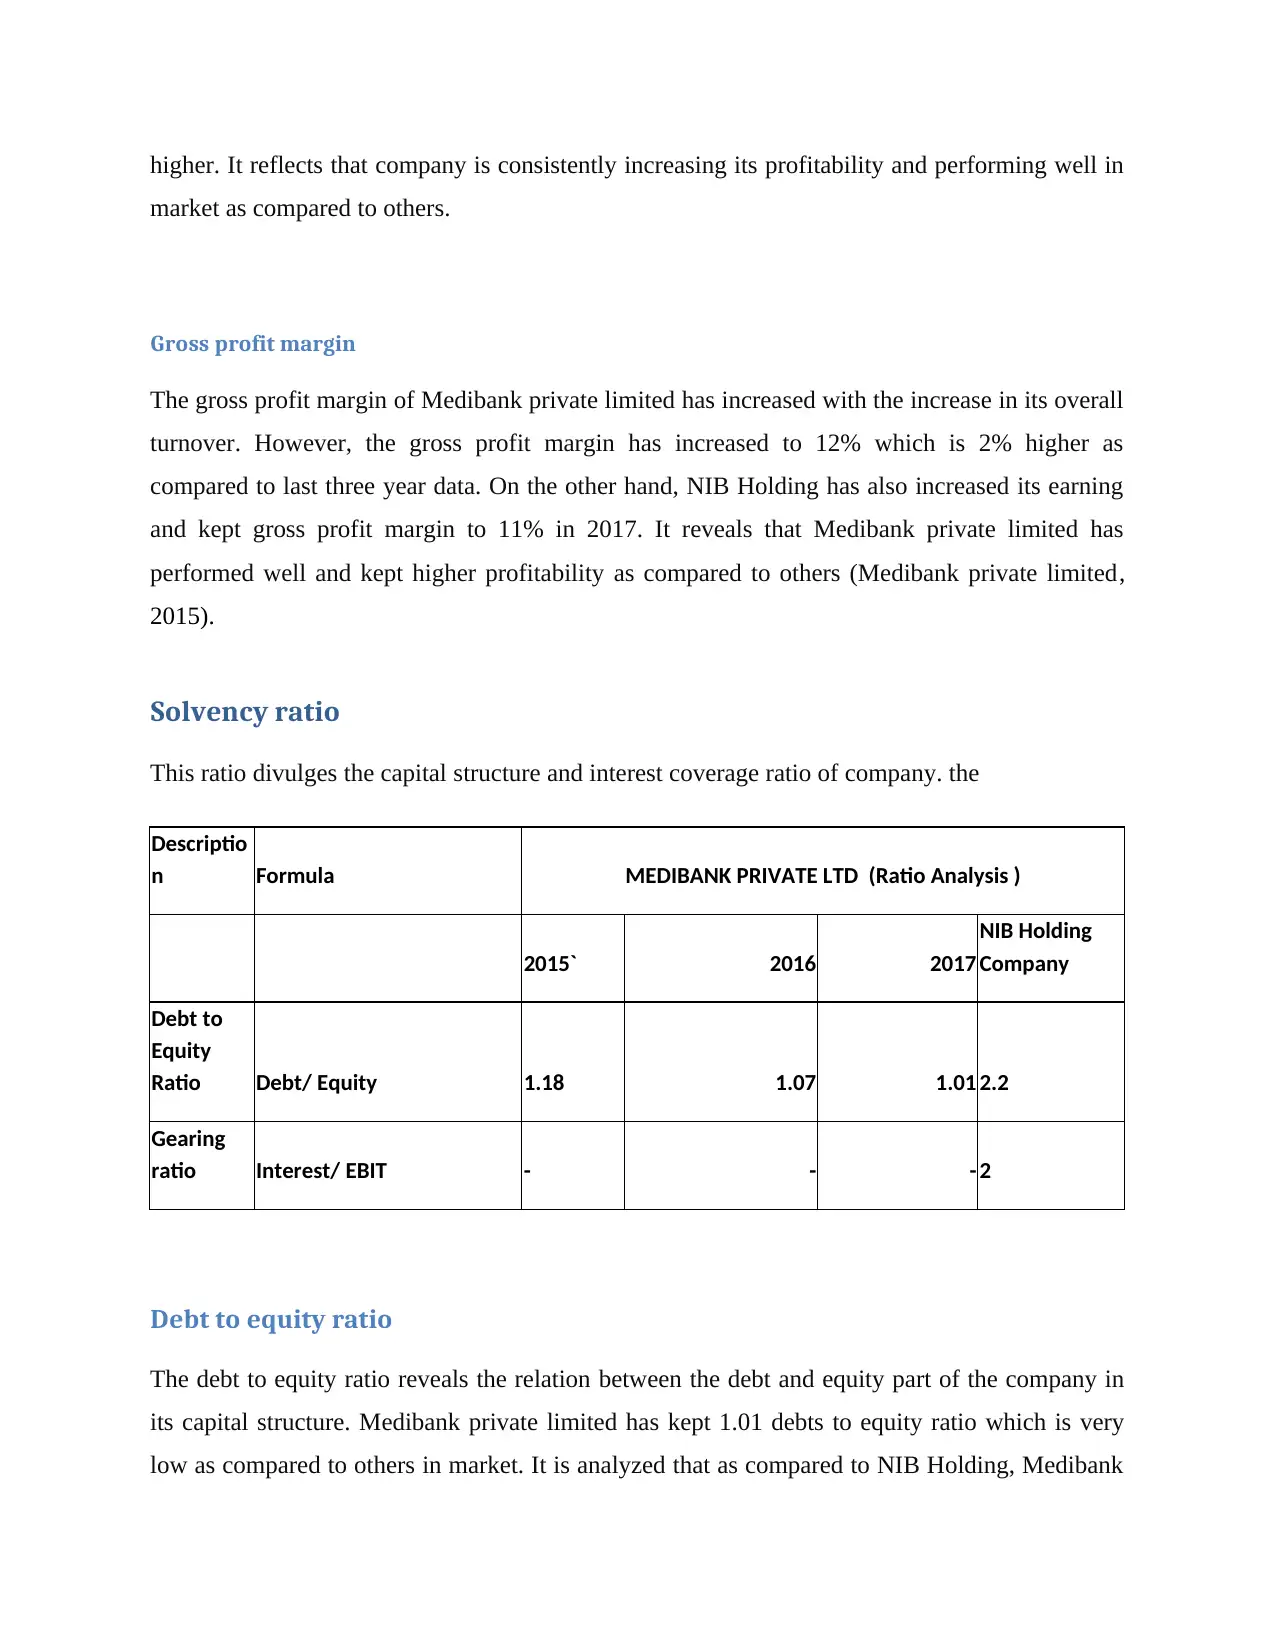
Solvency ratio
This ratio divulges the capital structure and interest coverage ratio of company. the
Descriptio
n Formula MEDIBANK PRIVATE LTD (Ratio Analysis )
2015` 2016 2017
NIB Holding
Company
Debt to
Equity
Ratio Debt/ Equity 1.18 1.07 1.01 2.2
Gearing
ratio Interest/ EBIT - - - 2
Debt to equity ratio
The debt to equity ratio reveals the relation between the debt and equity part of the company in
its capital structure. Medibank private limited has kept 1.01 debts to equity ratio which is very
low as compared to others in market. It is analyzed that as compared to NIB Holding, Medibank
market as compared to others.
Gross profit margin
The gross profit margin of Medibank private limited has increased with the increase in its overall
turnover. However, the gross profit margin has increased to 12% which is 2% higher as
compared to last three year data. On the other hand, NIB Holding has also increased its earning
and kept gross profit margin to 11% in 2017. It reveals that Medibank private limited has
performed well and kept higher profitability as compared to others (Medibank private limited,
2015).
Solvency ratio
This ratio divulges the capital structure and interest coverage ratio of company. the
Descriptio
n Formula MEDIBANK PRIVATE LTD (Ratio Analysis )
2015` 2016 2017
NIB Holding
Company
Debt to
Equity
Ratio Debt/ Equity 1.18 1.07 1.01 2.2
Gearing
ratio Interest/ EBIT - - - 2
Debt to equity ratio
The debt to equity ratio reveals the relation between the debt and equity part of the company in
its capital structure. Medibank private limited has kept 1.01 debts to equity ratio which is very
low as compared to others in market. It is analyzed that as compared to NIB Holding, Medibank
Paraphrase This Document
Need a fresh take? Get an instant paraphrase of this document with our AI Paraphraser
private limited has kept lower debt to equity which may be risky in terms of cost of caaptial. It is
considered that due to the low debt capital portion in its business, Medibank private limited may
have high cost of capital and it will eventually decrease the overall return on capital employed of
company.
Gearing ratio
It is analyzed that gearing ratio reflects how well company could meet its financial interest
payment out of its available earning. It shows its interest coverage capacity in its busienss. It
might negatively impact the business sustainability if company has low interest coverage. In case
of Medibank private limited, it is analyzed that it has kept zero interest coverage or gearing ratio
as it has no amount to pay as its interest payment. On the other hand, NIB Holding company has
kept low interest payment which is positive indicator and higher debt portion will also be helpful
for the Organizaiton to lower down its cost of capital. The interest payment will also be used by
company as tax deduction expenses to lower down the tax expenses (Yahoo Finance, 2017).
Efficiency ratio
This ratio divulges how Medibank private limited could effectively deploy its capital in its
busienss process.
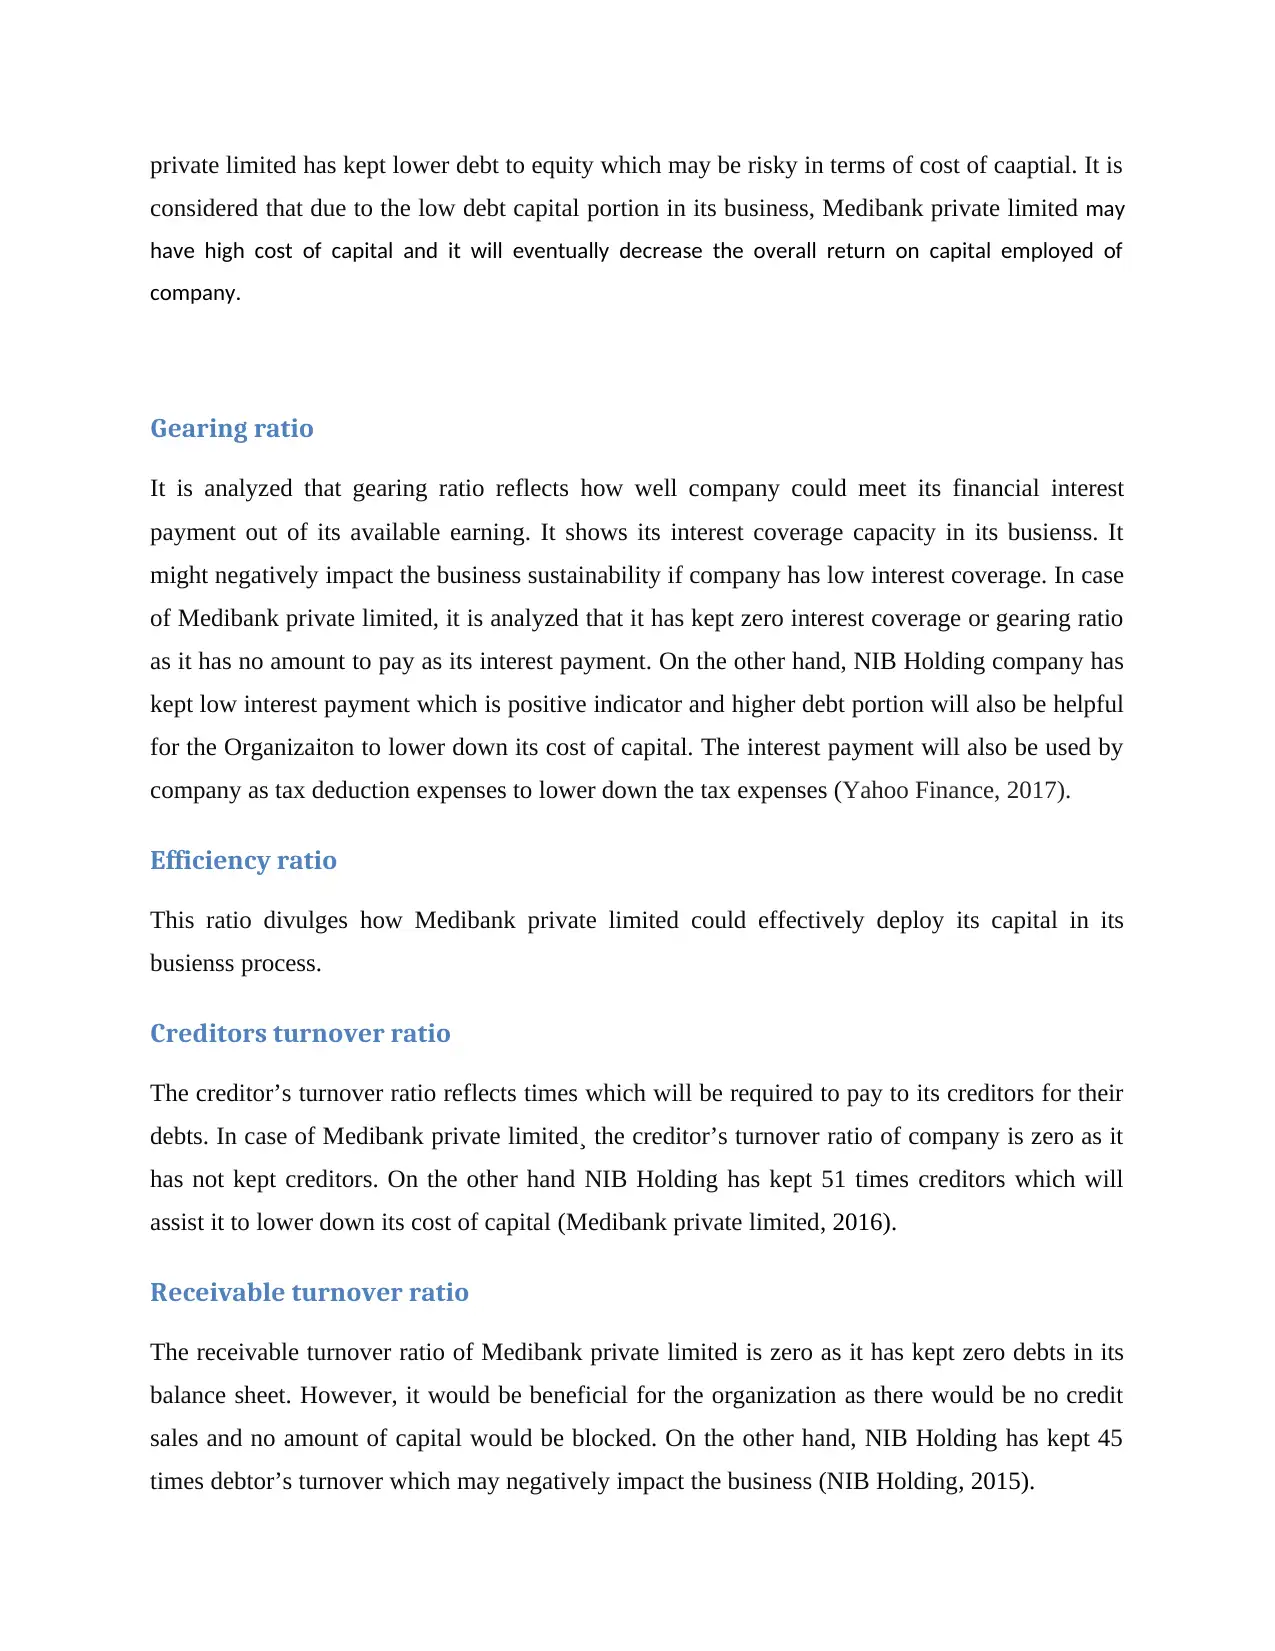
Creditors turnover ratio
The creditor’s turnover ratio reflects times which will be required to pay to its creditors for their
debts. In case of Medibank private limited¸ the creditor’s turnover ratio of company is zero as it
has not kept creditors. On the other hand NIB Holding has kept 51 times creditors which will
assist it to lower down its cost of capital (Medibank private limited, 2016).
Receivable turnover ratio
The receivable turnover ratio of Medibank private limited is zero as it has kept zero debts in its
balance sheet. However, it would be beneficial for the organization as there would be no credit
sales and no amount of capital would be blocked. On the other hand, NIB Holding has kept 45
times debtor’s turnover which may negatively impact the business (NIB Holding, 2015).
considered that due to the low debt capital portion in its business, Medibank private limited may
have high cost of capital and it will eventually decrease the overall return on capital employed of
company.
Gearing ratio
It is analyzed that gearing ratio reflects how well company could meet its financial interest
payment out of its available earning. It shows its interest coverage capacity in its busienss. It
might negatively impact the business sustainability if company has low interest coverage. In case
of Medibank private limited, it is analyzed that it has kept zero interest coverage or gearing ratio
as it has no amount to pay as its interest payment. On the other hand, NIB Holding company has
kept low interest payment which is positive indicator and higher debt portion will also be helpful
for the Organizaiton to lower down its cost of capital. The interest payment will also be used by
company as tax deduction expenses to lower down the tax expenses (Yahoo Finance, 2017).
Efficiency ratio
This ratio divulges how Medibank private limited could effectively deploy its capital in its
busienss process.
Creditors turnover ratio
The creditor’s turnover ratio reflects times which will be required to pay to its creditors for their
debts. In case of Medibank private limited¸ the creditor’s turnover ratio of company is zero as it
has not kept creditors. On the other hand NIB Holding has kept 51 times creditors which will
assist it to lower down its cost of capital (Medibank private limited, 2016).
Receivable turnover ratio
The receivable turnover ratio of Medibank private limited is zero as it has kept zero debts in its
balance sheet. However, it would be beneficial for the organization as there would be no credit
sales and no amount of capital would be blocked. On the other hand, NIB Holding has kept 45
times debtor’s turnover which may negatively impact the business (NIB Holding, 2015).
Descriptio
n Formula MEDIBANK PRIVATE LTD (Ratio Analysis )
2015` 2016 2017
NIB Holding
Company
Creditors
payable
period creditors / Total sales*365 - - - 51
Inventory
Turnover
ratio COGS/ Sales*365 - - - 245
Asset
turnover
ratio Total sales/ Total assets 2.12 2.08 2.00 4
Inventory Turnover ratio
The inventory turnover ratio Medibank private limited is zero as it has not kept capital in its
inventory. It would be beneficial for the organization as there would be no amount of capital
blocked in its inventory. On the other hand, NIB Holding has kept 245 times inventory’s
turnover which may result to increased cost of capital and may also negatively impact the
busienss (Talebnia, Jaberzadeh, and Salehi, (2015).
Assets turnover ratio
The assets turnover ratio of Medibank private limited has been stable since last three years.
Company has not been performing well but the assets turnover ratio of company is also not that
high. NIB Holding company has kept 4 times assets turnover which is positive indicator for the
future growth of the organization.
⊘ This is a preview!⊘
Do you want full access?
Subscribe today to unlock all pages.
Trusted by 1+ million students worldwide
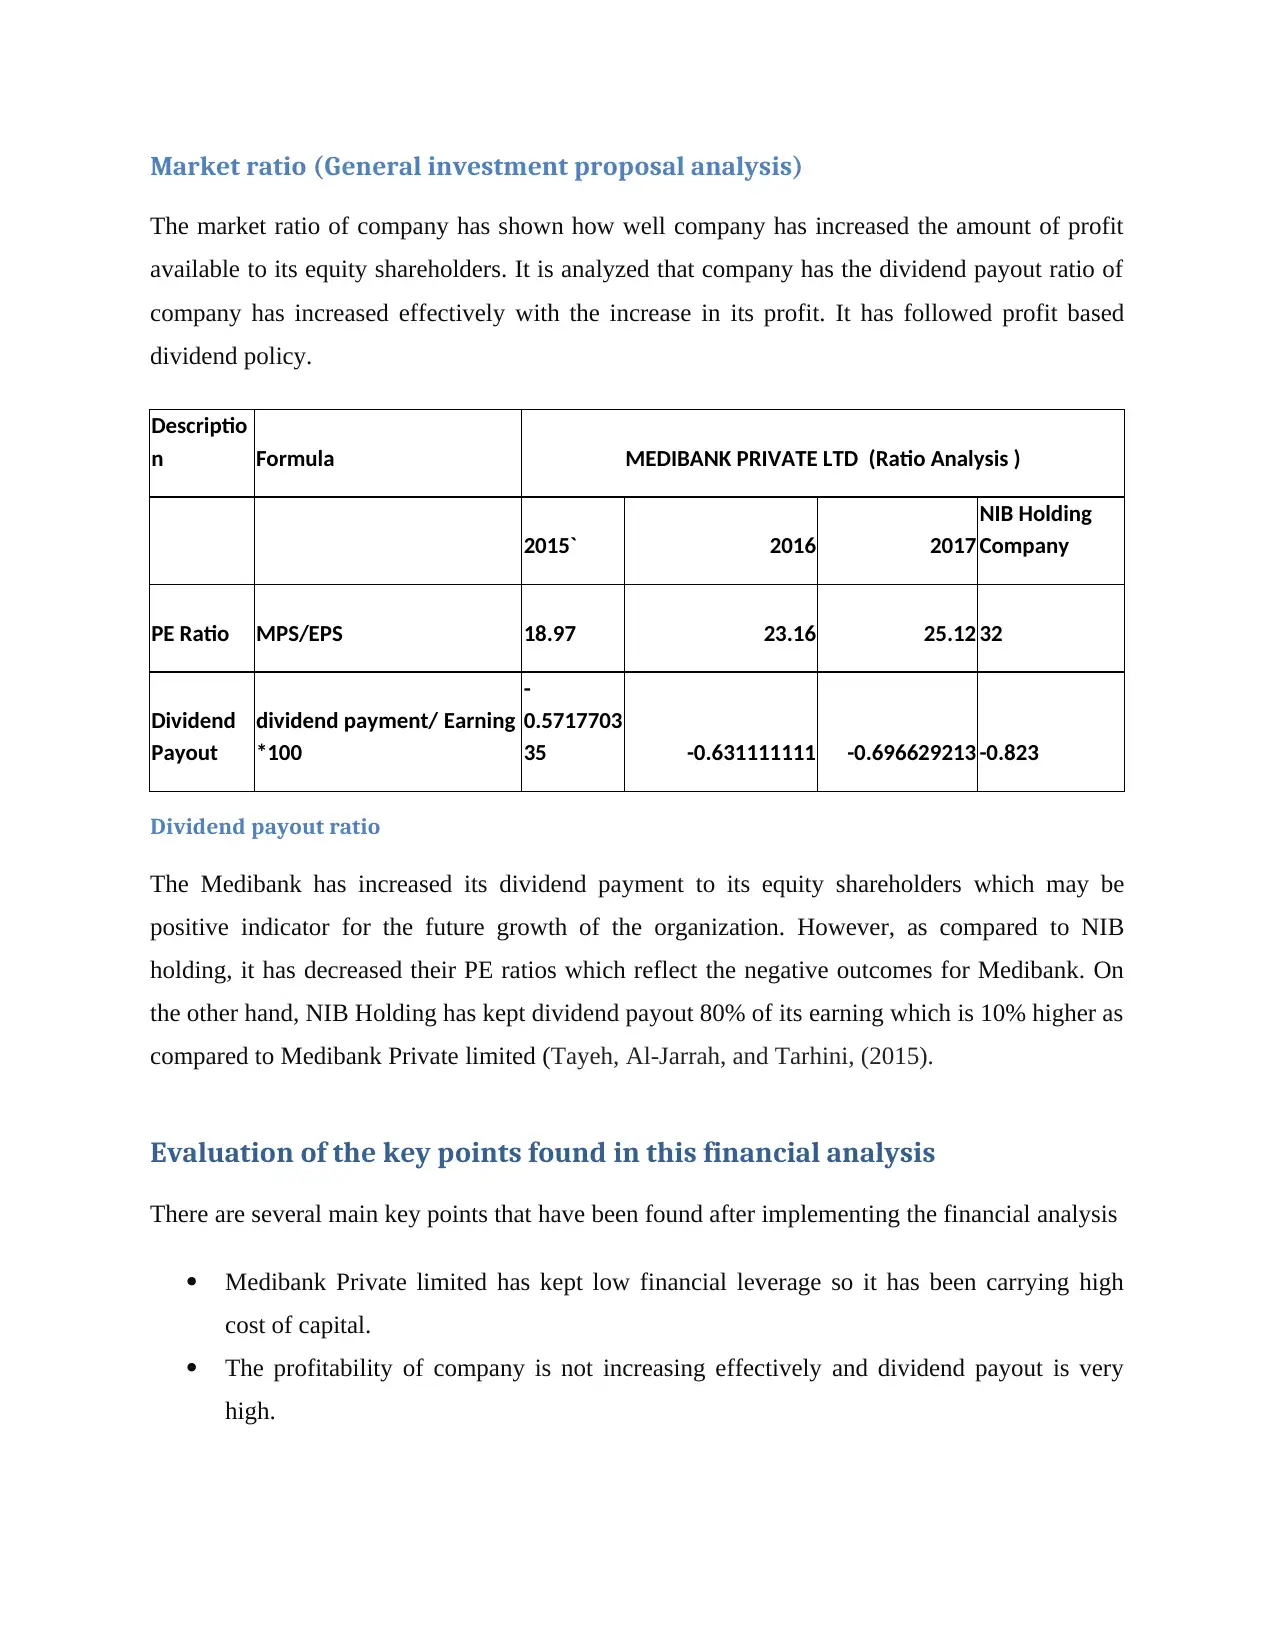
Market ratio (General investment proposal analysis)
The market ratio of company has shown how well company has increased the amount of profit
available to its equity shareholders. It is analyzed that company has the dividend payout ratio of
company has increased effectively with the increase in its profit. It has followed profit based
dividend policy.
Descriptio
n Formula MEDIBANK PRIVATE LTD (Ratio Analysis )
2015` 2016 2017
NIB Holding
Company
PE Ratio MPS/EPS 18.97 23.16 25.12 32
Dividend
Payout
dividend payment/ Earning
*100
-
0.5717703
35 -0.631111111 -0.696629213 -0.823
Dividend payout ratio
The Medibank has increased its dividend payment to its equity shareholders which may be
positive indicator for the future growth of the organization. However, as compared to NIB
holding, it has decreased their PE ratios which reflect the negative outcomes for Medibank. On
the other hand, NIB Holding has kept dividend payout 80% of its earning which is 10% higher as
compared to Medibank Private limited (Tayeh, Al-Jarrah, and Tarhini, (2015).
Evaluation of the key points found in this financial analysis
There are several main key points that have been found after implementing the financial analysis
Medibank Private limited has kept low financial leverage so it has been carrying high
cost of capital.
The profitability of company is not increasing effectively and dividend payout is very
high.
Paraphrase This Document
Need a fresh take? Get an instant paraphrase of this document with our AI Paraphraser
As compared to NIB Holding, Medibank Private limited has low financial performance in
terms of profitability and solvency.
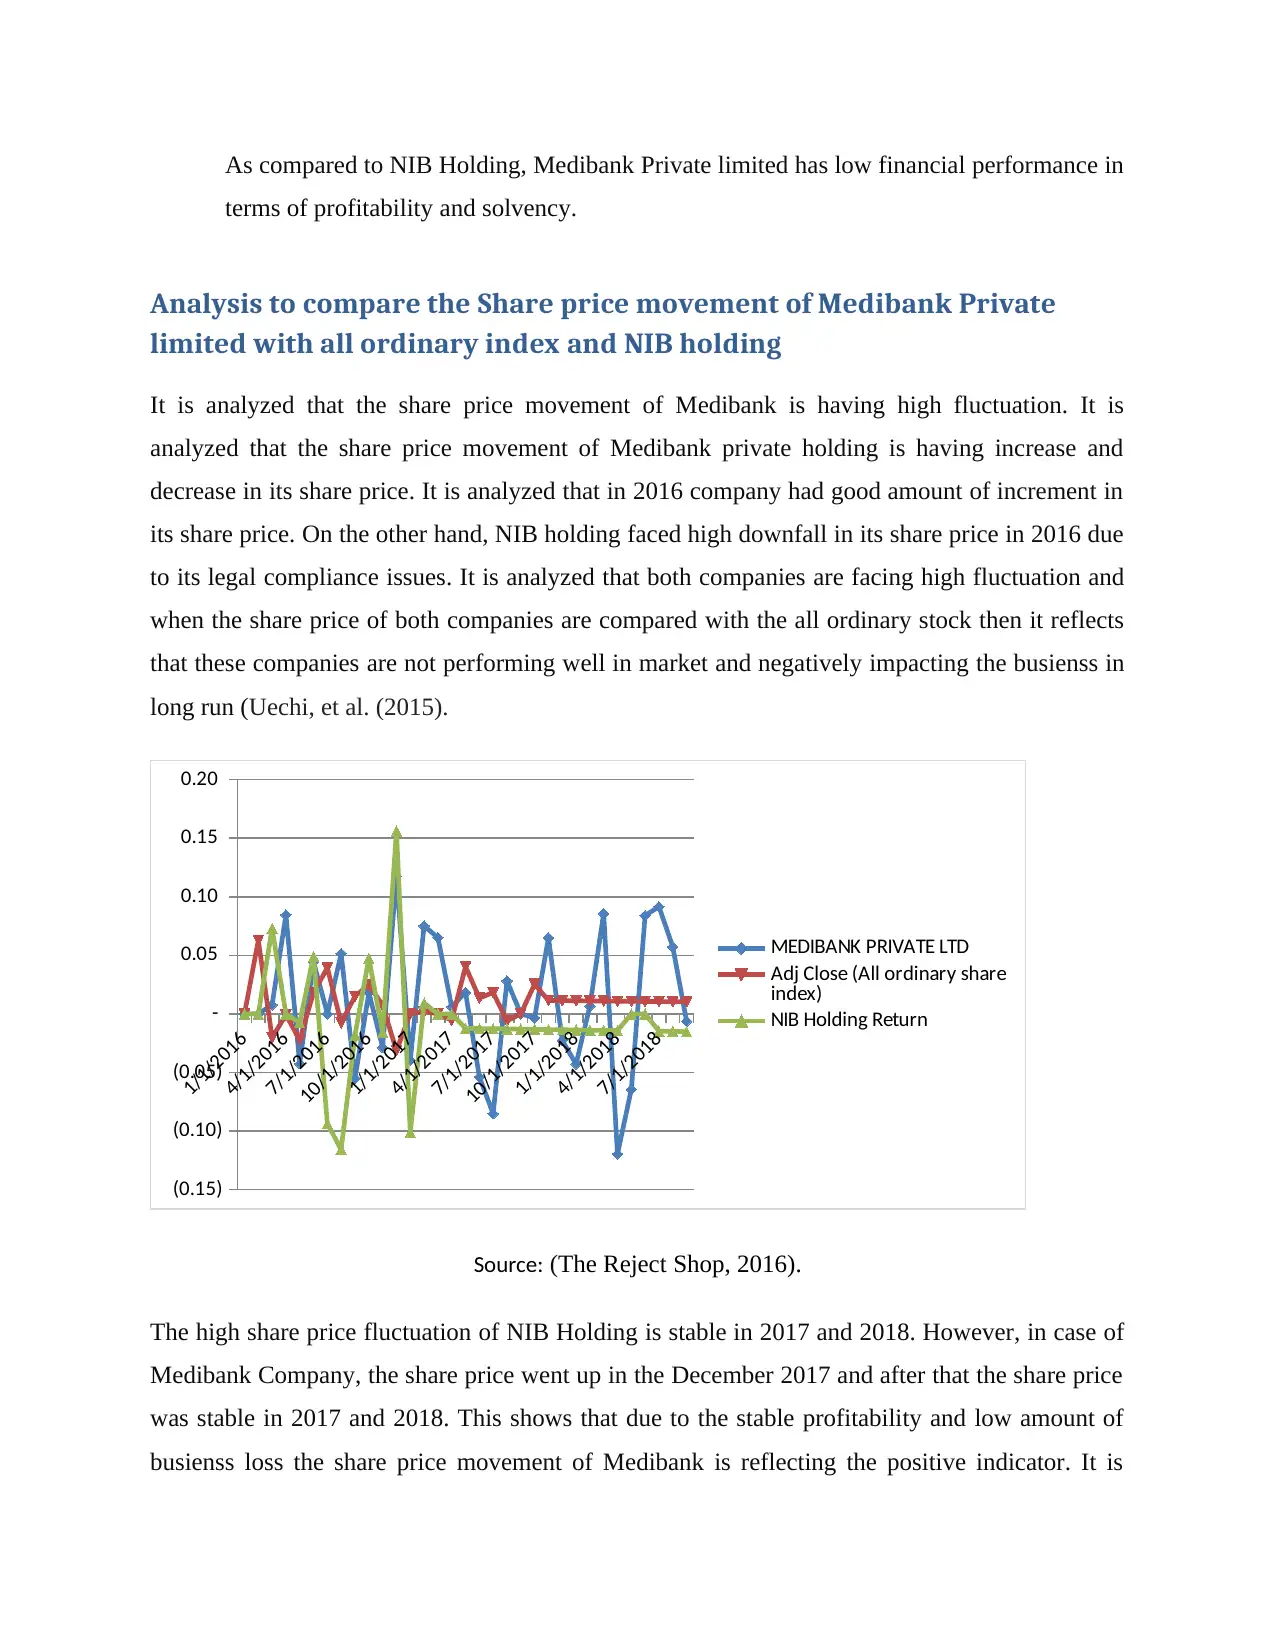
Analysis to compare the Share price movement of Medibank Private
limited with all ordinary index and NIB holding
It is analyzed that the share price movement of Medibank is having high fluctuation. It is
analyzed that the share price movement of Medibank private holding is having increase and
decrease in its share price. It is analyzed that in 2016 company had good amount of increment in
its share price. On the other hand, NIB holding faced high downfall in its share price in 2016 due
to its legal compliance issues. It is analyzed that both companies are facing high fluctuation and
when the share price of both companies are compared with the all ordinary stock then it reflects
that these companies are not performing well in market and negatively impacting the busienss in
long run (Uechi, et al. (2015).
1/1/2016
4/1/2016
7/1/2016
10/1/2016
1/1/2017
4/1/2017
7/1/2017
10/1/2017
1/1/2018
4/1/2018
7/1/2018
(0.15)
(0.10)
(0.05)
-
0.05
0.10
0.15
0.20
MEDIBANK PRIVATE LTD
Adj Close (All ordinary share
index)
NIB Holding Return
Source: (The Reject Shop, 2016).
The high share price fluctuation of NIB Holding is stable in 2017 and 2018. However, in case of
Medibank Company, the share price went up in the December 2017 and after that the share price
was stable in 2017 and 2018. This shows that due to the stable profitability and low amount of
busienss loss the share price movement of Medibank is reflecting the positive indicator. It is
terms of profitability and solvency.
Analysis to compare the Share price movement of Medibank Private
limited with all ordinary index and NIB holding
It is analyzed that the share price movement of Medibank is having high fluctuation. It is
analyzed that the share price movement of Medibank private holding is having increase and
decrease in its share price. It is analyzed that in 2016 company had good amount of increment in
its share price. On the other hand, NIB holding faced high downfall in its share price in 2016 due
to its legal compliance issues. It is analyzed that both companies are facing high fluctuation and
when the share price of both companies are compared with the all ordinary stock then it reflects
that these companies are not performing well in market and negatively impacting the busienss in
long run (Uechi, et al. (2015).
1/1/2016
4/1/2016
7/1/2016
10/1/2016
1/1/2017
4/1/2017
7/1/2017
10/1/2017
1/1/2018
4/1/2018
7/1/2018
(0.15)
(0.10)
(0.05)
-
0.05
0.10
0.15
0.20
MEDIBANK PRIVATE LTD
Adj Close (All ordinary share
index)
NIB Holding Return
Source: (The Reject Shop, 2016).
The high share price fluctuation of NIB Holding is stable in 2017 and 2018. However, in case of
Medibank Company, the share price went up in the December 2017 and after that the share price
was stable in 2017 and 2018. This shows that due to the stable profitability and low amount of
busienss loss the share price movement of Medibank is reflecting the positive indicator. It is
inferred that the share price movement of all ordinary index is very lost and reflecting the
positive indicator. If investors invest their capital in all ordinary index share companies then they
will have higher return on capital employed (Delen, Kuzey, and Uyar, (2013).
Computation of the value of the stock of the Reject Shop Company
The dividend growth model is the model which is used to compute the share value of company.
It uses the divided paid to shareholders, growth rate and cost of capital of company (Ehiedu,
2014).
Formula:
Value of the stock = D1/ KE-G
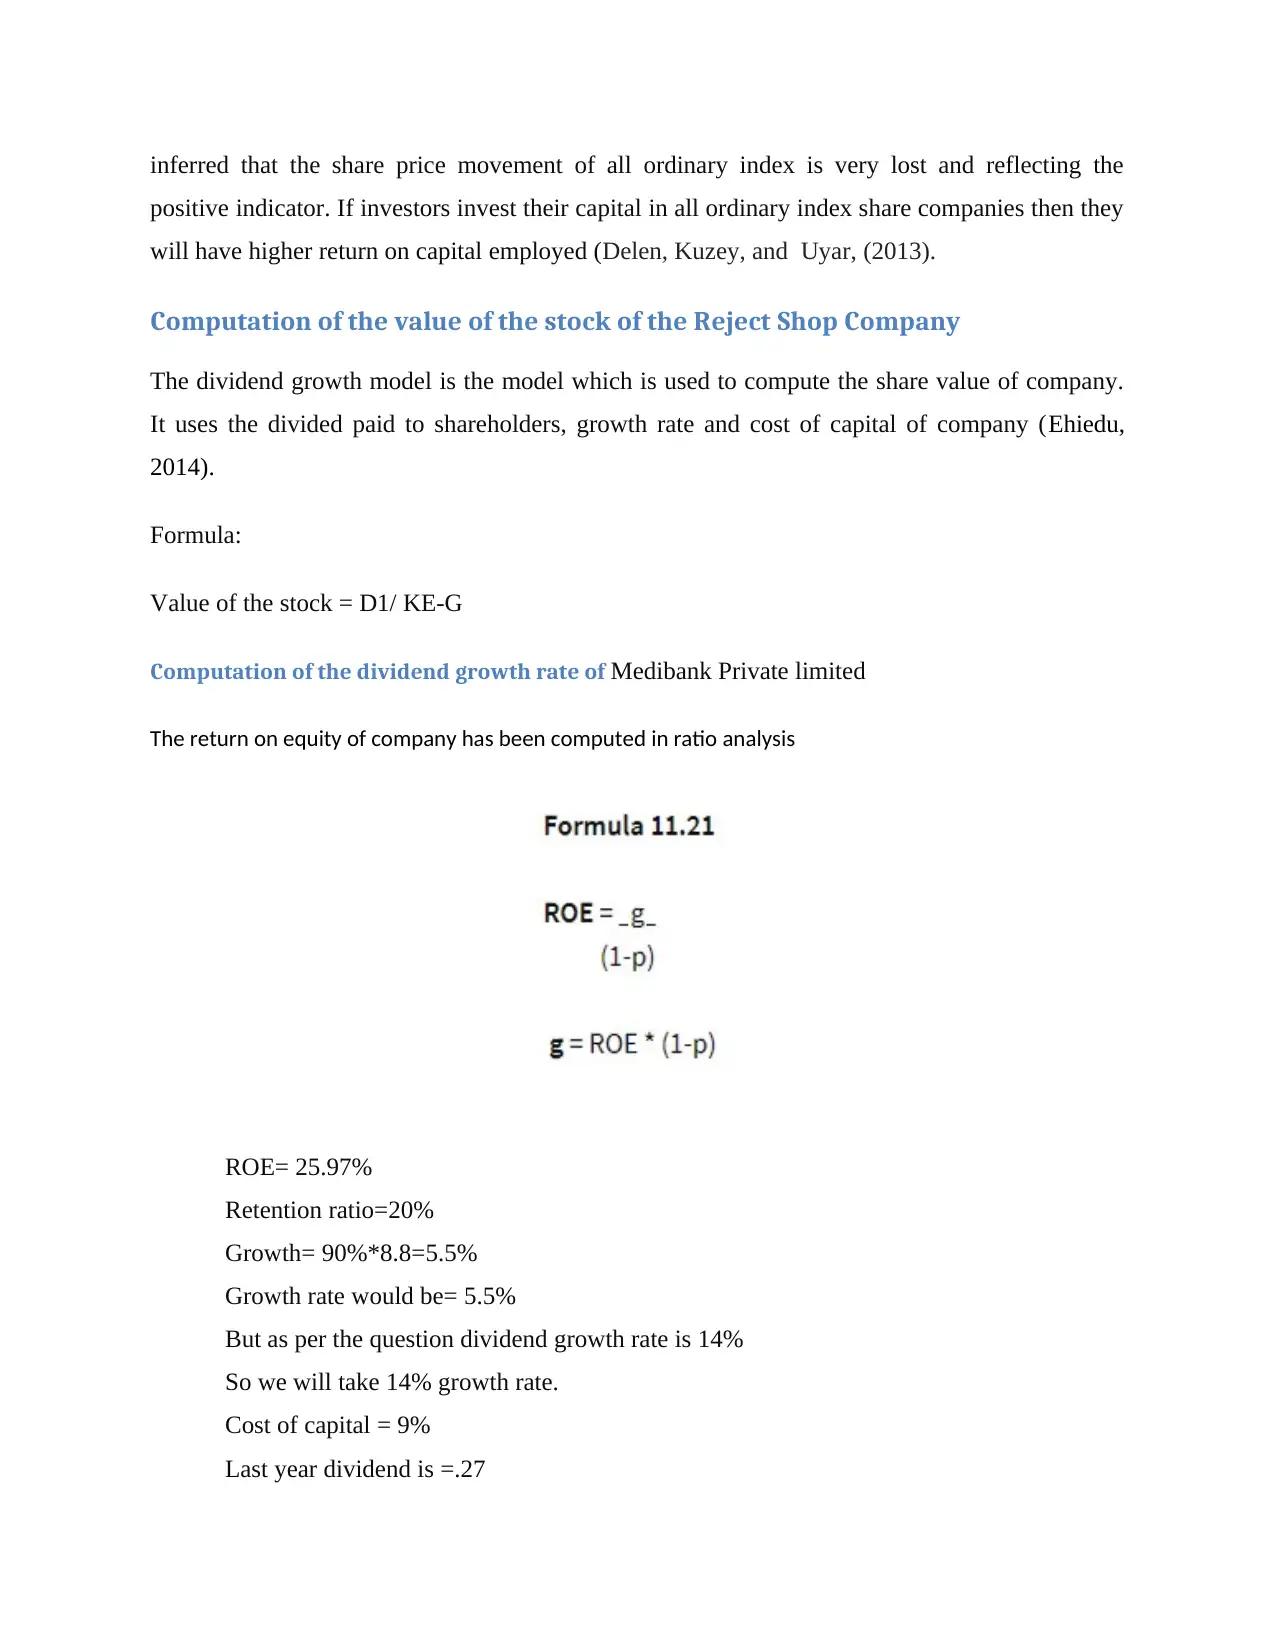
Computation of the dividend growth rate of Medibank Private limited
The return on equity of company has been computed in ratio analysis
ROE= 25.97%
Retention ratio=20%
Growth= 90%*8.8=5.5%
Growth rate would be= 5.5%
But as per the question dividend growth rate is 14%
So we will take 14% growth rate.
Cost of capital = 9%
Last year dividend is =.27
positive indicator. If investors invest their capital in all ordinary index share companies then they
will have higher return on capital employed (Delen, Kuzey, and Uyar, (2013).
Computation of the value of the stock of the Reject Shop Company
The dividend growth model is the model which is used to compute the share value of company.
It uses the divided paid to shareholders, growth rate and cost of capital of company (Ehiedu,
2014).
Formula:
Value of the stock = D1/ KE-G
Computation of the dividend growth rate of Medibank Private limited
The return on equity of company has been computed in ratio analysis
ROE= 25.97%
Retention ratio=20%
Growth= 90%*8.8=5.5%
Growth rate would be= 5.5%
But as per the question dividend growth rate is 14%
So we will take 14% growth rate.
Cost of capital = 9%
Last year dividend is =.27
⊘ This is a preview!⊘
Do you want full access?
Subscribe today to unlock all pages.
Trusted by 1+ million students worldwide
1 out of 20
Related Documents


Your All-in-One AI-Powered Toolkit for Academic Success.
+13062052269
info@desklib.com
Available 24*7 on WhatsApp / Email
![[object Object]](/_next/static/media/star-bottom.7253800d.svg)
Unlock your academic potential
Copyright © 2020–2026 A2Z Services. All Rights Reserved. Developed and managed by ZUCOL.