Financial Health and Value Creation Analysis of HCA Healthcare
VerifiedAdded on 2022/08/13
|10
|1971
|15
Report
AI Summary
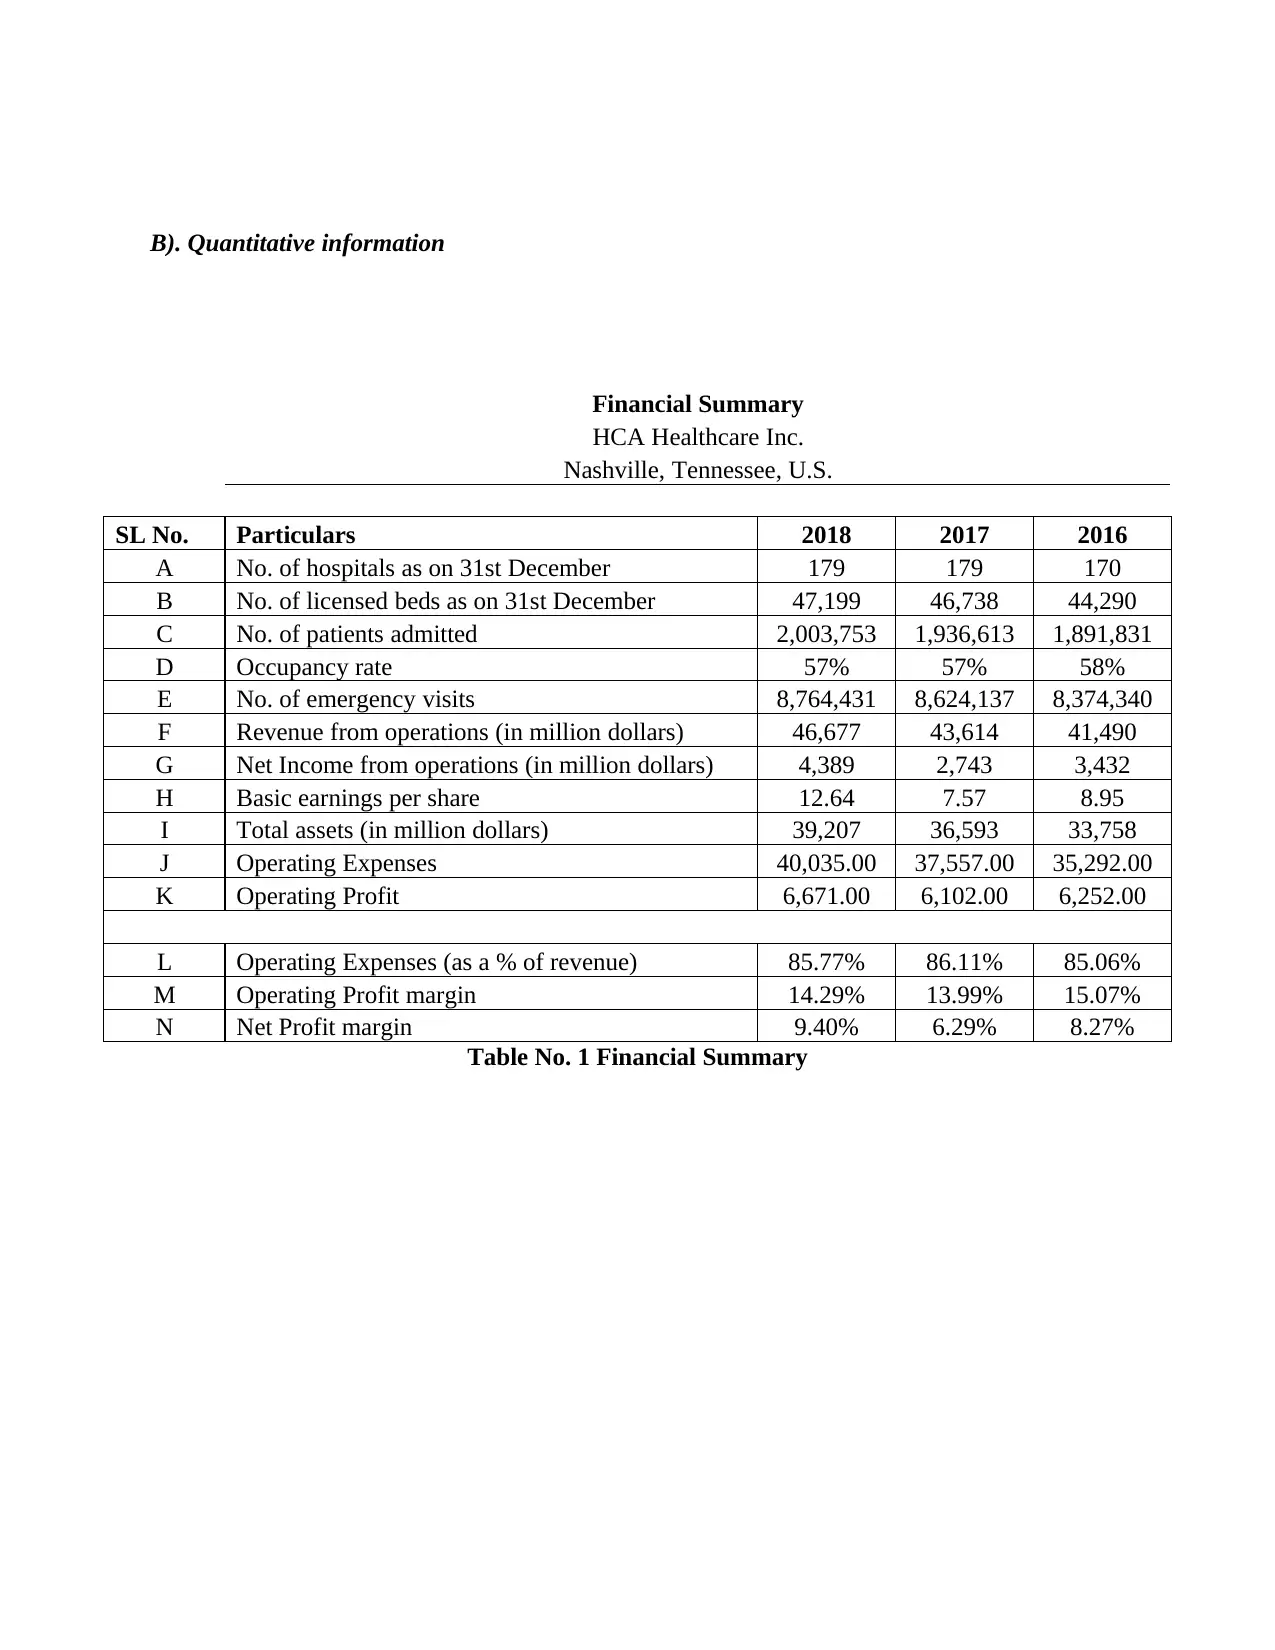
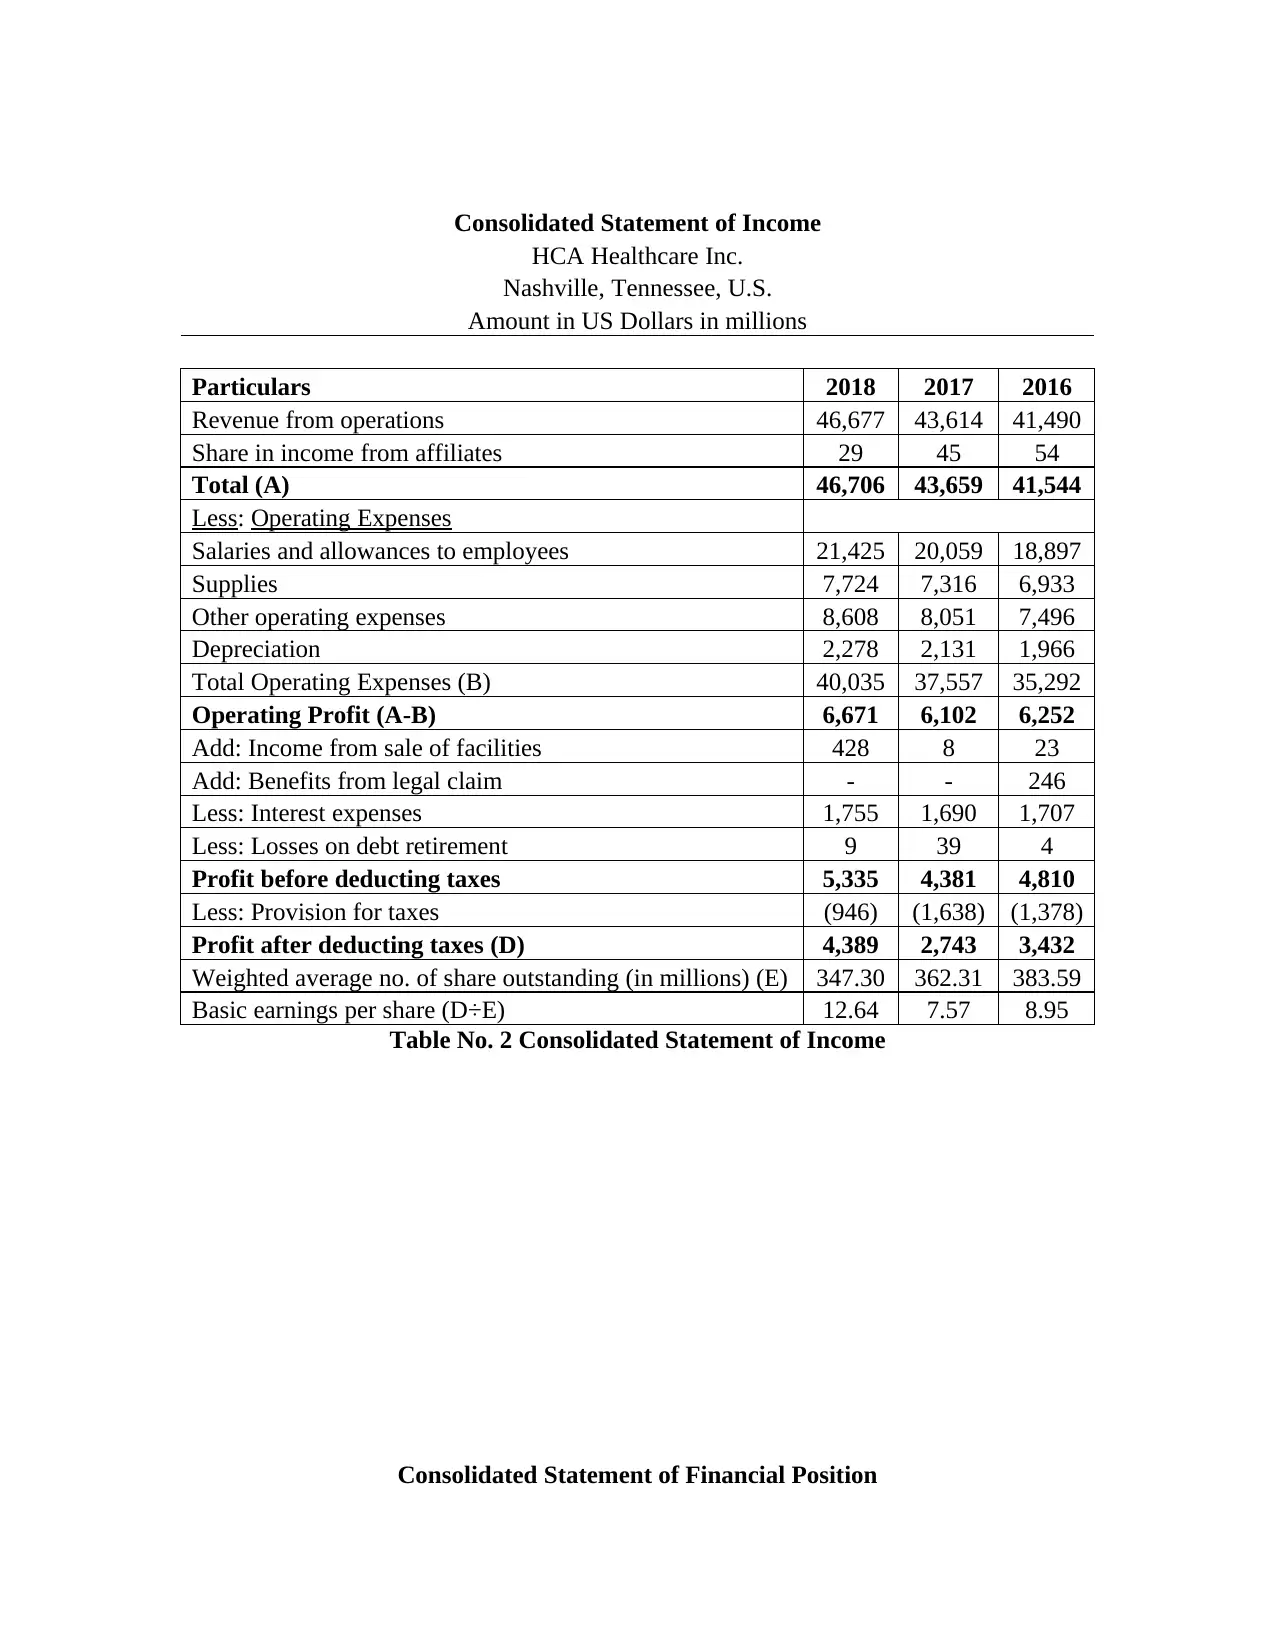
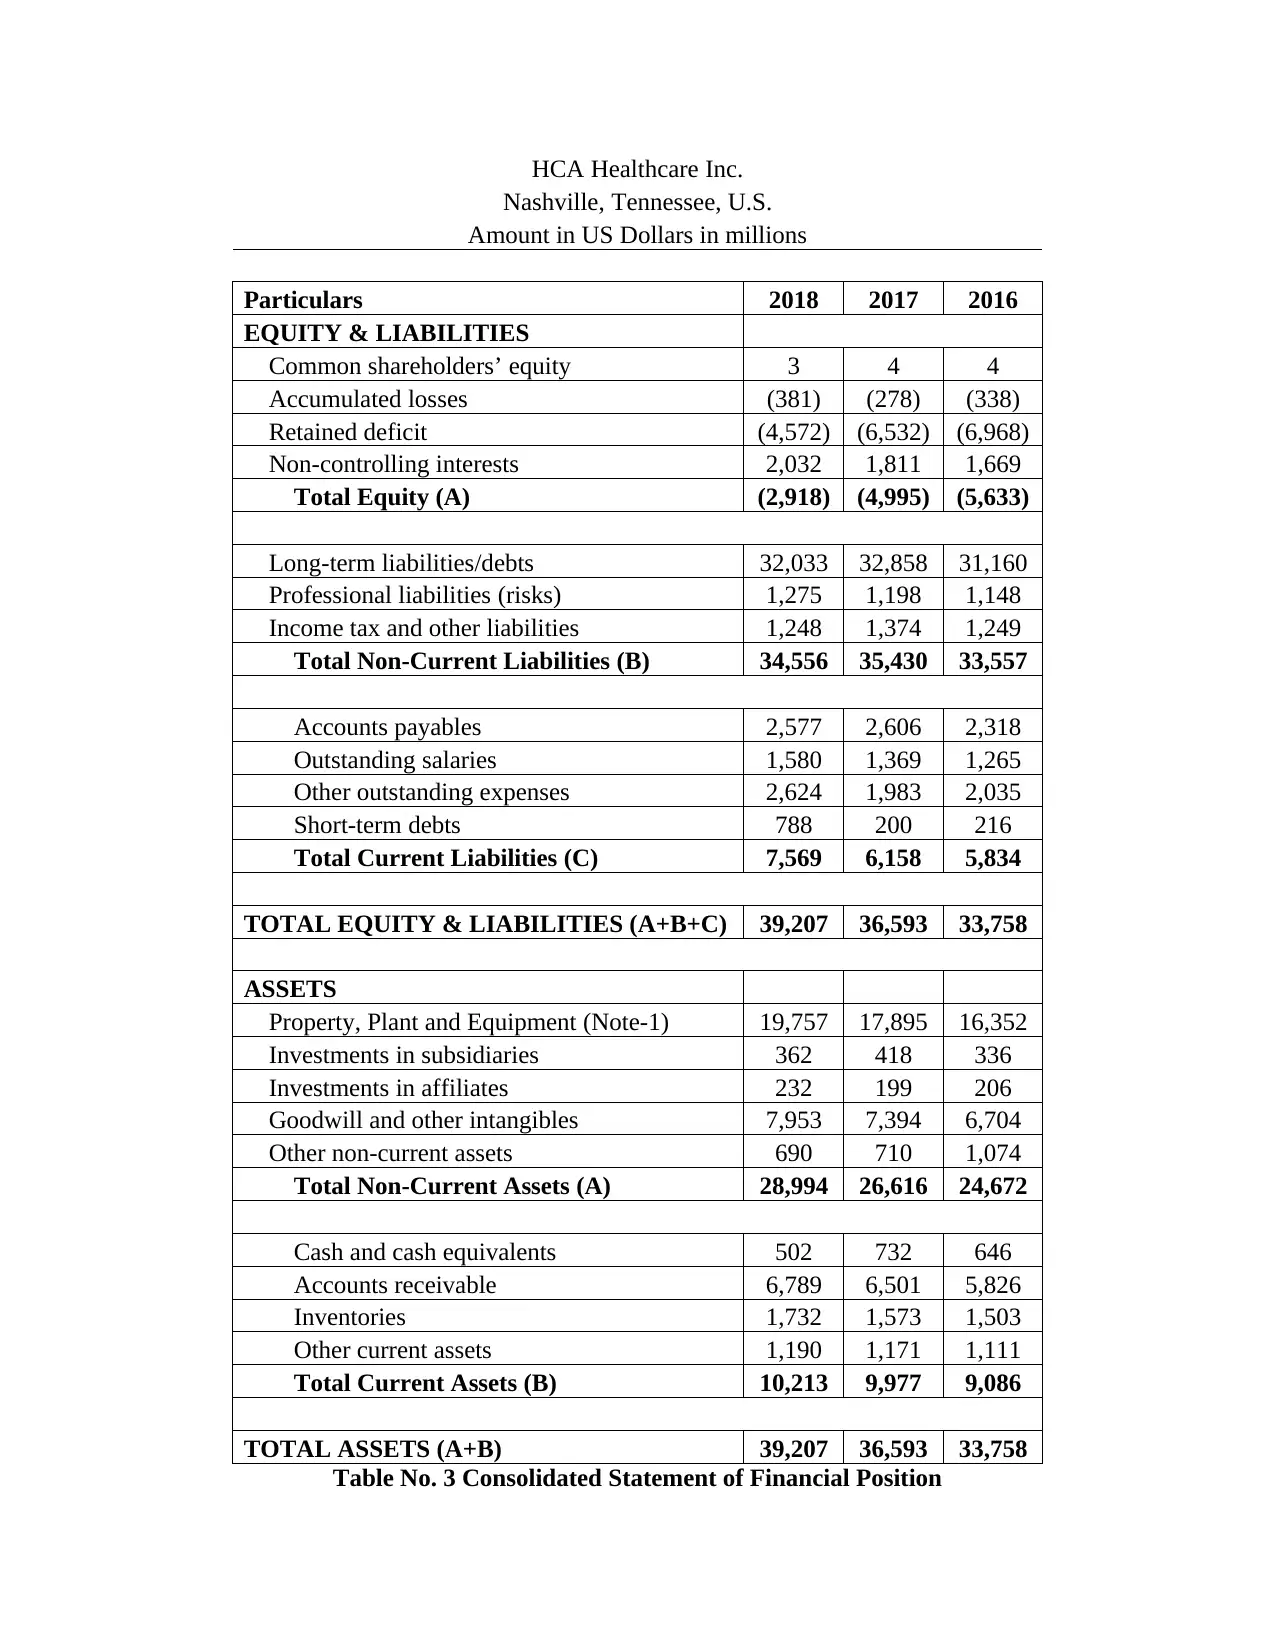
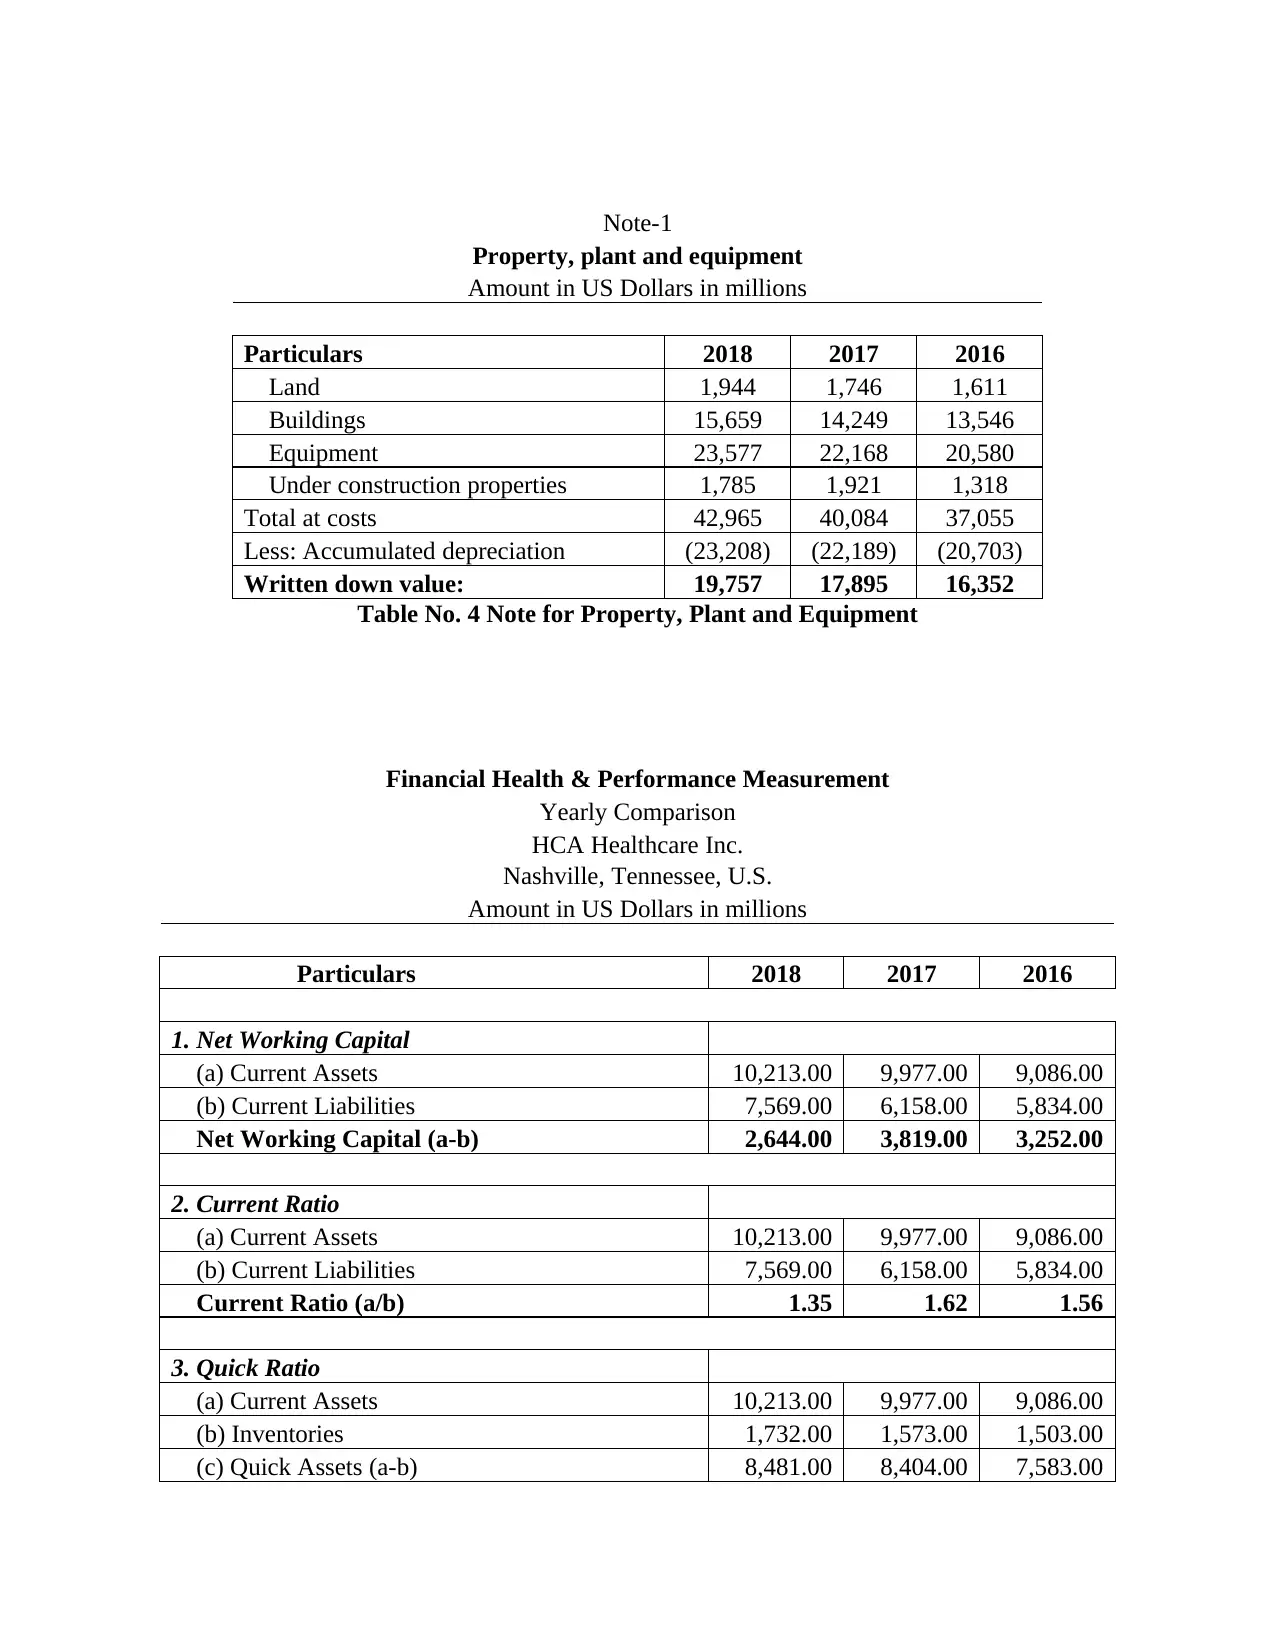
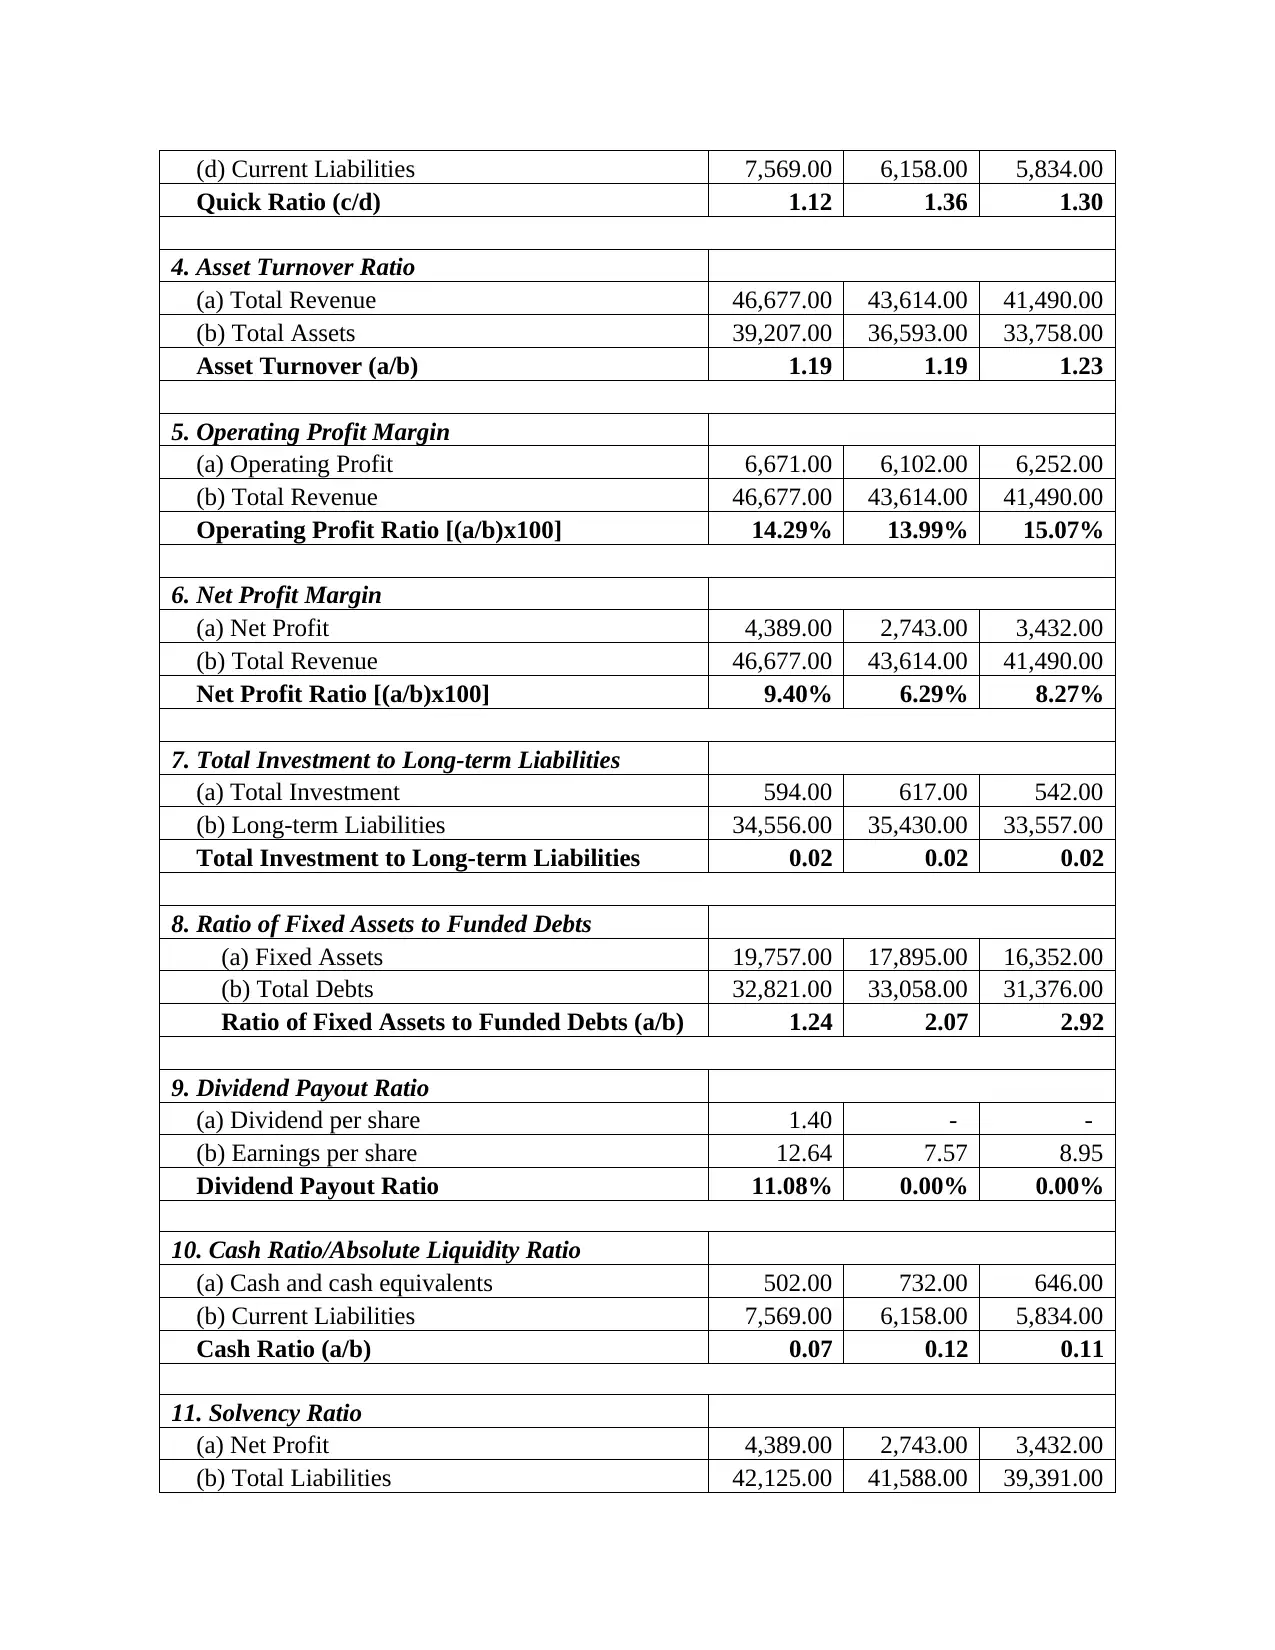
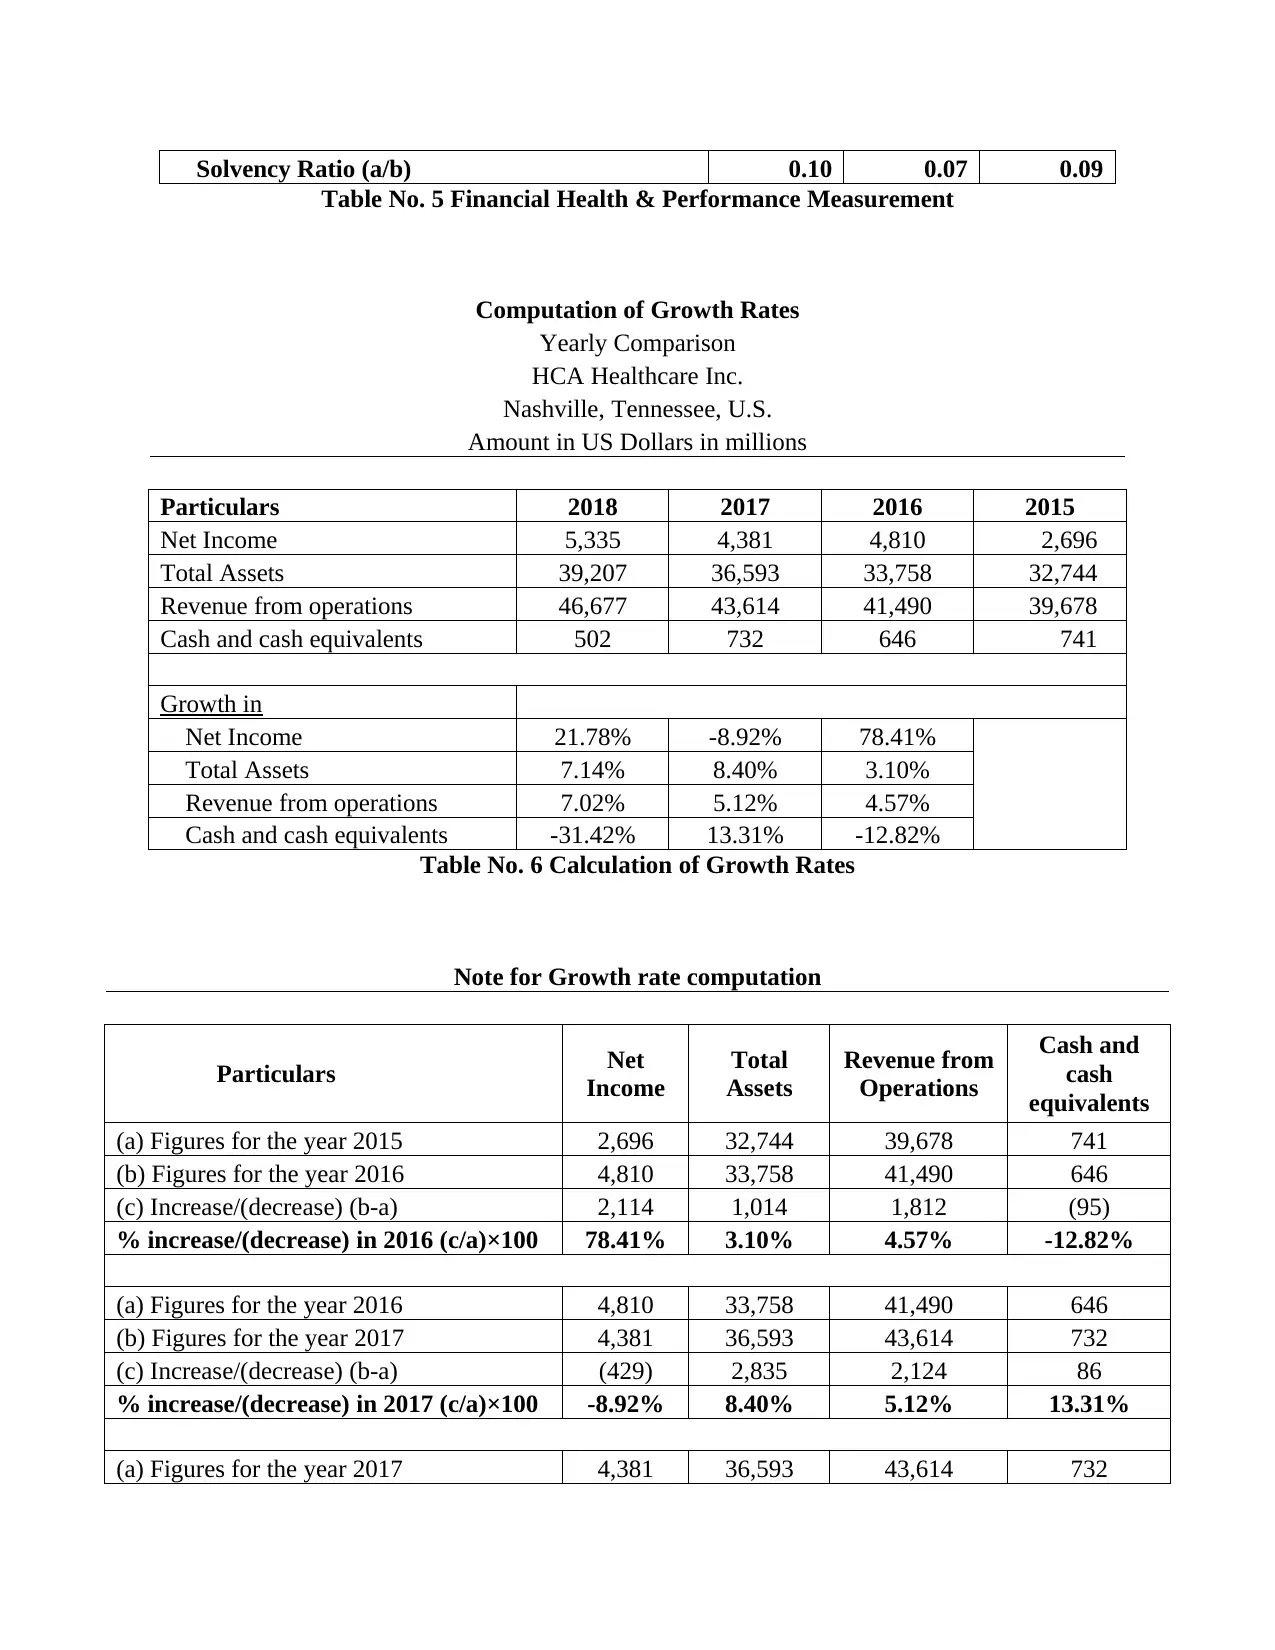
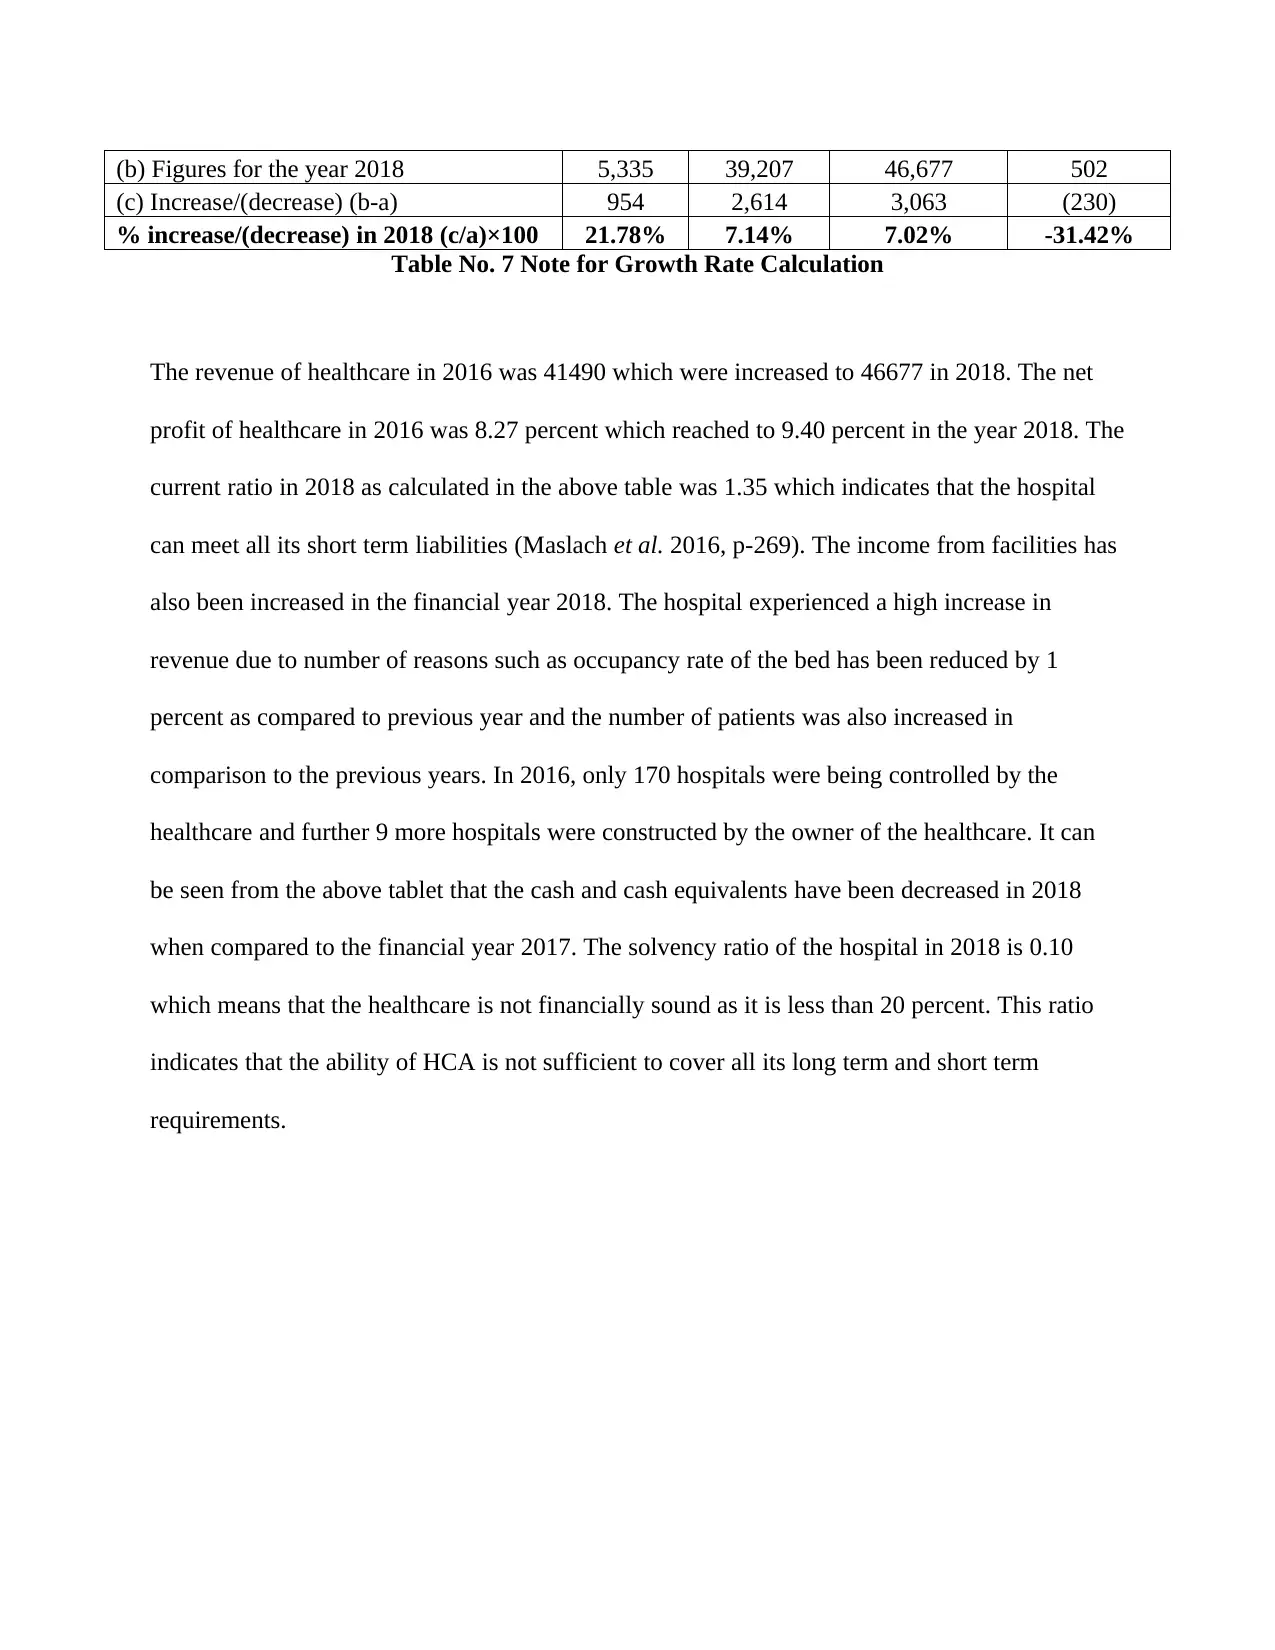
This report provides a comprehensive financial analysis of HCA Healthcare, a major healthcare provider in the United States. It examines both qualitative aspects, such as the company's collaborative healthcare network and commitment to patient care, and quantitative data, including financial summaries from 2016 to 2018. The analysis includes key financial statements like the consolidated statement of income and financial position, along with detailed notes on property, plant, and equipment. Performance is evaluated using various financial health and performance metrics such as current ratio, quick ratio, asset turnover, and profit margins. Additionally, the report calculates growth rates for key financial indicators like net income, total assets, and revenue from operations. The analysis highlights trends in revenue, profitability, and solvency, concluding with observations on the company's financial health and ability to meet its obligations, supported by relevant references.
Contribute Materials
Your contribution can guide someone’s learning journey. Share your
documents today.

Financial health and value creation in health care
Secure Best Marks with AI Grader
Need help grading? Try our AI Grader for instant feedback on your assignments.

Introduction
In this paper, the financial analysis of HCA Healthcare has been done. HCA healthcare was
founded in the year 1968 and is located in Tennessee, United States. It is also listed in the S&P
500. The healthcare serves the whole of United Kingdom and United States. It also manages
around 185 hospitals and 119 surgery centers. Around 249000 employees are providing their
valuable services to the healthcare and also to the people of the United States. Doctors who are
specialized in their field are hired by healthcare for rendering best services to their patients.
Qualitative and quantitative information about HCA HEALTCARE
A). Qualitative information
The healthcare is a network of collaborative healthcare which is managed by the nurses, best
physician, and other staff to provide better facilities to the people of United States. It has a
comprehensive network with almost 1800 nursing home which enables them to provide better
outcomes and results to their patients. They also provide superior care facilities to all of their
patients and the physician are also separately trained by healthcare. Each year 30 million patients
are treated by them which led to increase in the goodwill and reputation of healthcare in the State
(Glassdoor.co.in. 2020). They are also committed to render high quality treatment and take better
care of human life. The hospital also provides consultancy, diagnosis, medical education,
nursing, training programs, surgeries, and other medical services.

B). Quantitative information
Financial Summary
HCA Healthcare Inc.
Nashville, Tennessee, U.S.
SL No. Particulars 2018 2017 2016
A No. of hospitals as on 31st December 179 179 170
B No. of licensed beds as on 31st December 47,199 46,738 44,290
C No. of patients admitted 2,003,753 1,936,613 1,891,831
D Occupancy rate 57% 57% 58%
E No. of emergency visits 8,764,431 8,624,137 8,374,340
F Revenue from operations (in million dollars) 46,677 43,614 41,490
G Net Income from operations (in million dollars) 4,389 2,743 3,432
H Basic earnings per share 12.64 7.57 8.95
I Total assets (in million dollars) 39,207 36,593 33,758
J Operating Expenses 40,035.00 37,557.00 35,292.00
K Operating Profit 6,671.00 6,102.00 6,252.00
L Operating Expenses (as a % of revenue) 85.77% 86.11% 85.06%
M Operating Profit margin 14.29% 13.99% 15.07%
N Net Profit margin 9.40% 6.29% 8.27%
Table No. 1 Financial Summary

Consolidated Statement of Income
HCA Healthcare Inc.
Nashville, Tennessee, U.S.
Amount in US Dollars in millions
Particulars 2018 2017 2016
Revenue from operations 46,677 43,614 41,490
Share in income from affiliates 29 45 54
Total (A) 46,706 43,659 41,544
Less: Operating Expenses
Salaries and allowances to employees 21,425 20,059 18,897
Supplies 7,724 7,316 6,933
Other operating expenses 8,608 8,051 7,496
Depreciation 2,278 2,131 1,966
Total Operating Expenses (B) 40,035 37,557 35,292
Operating Profit (A-B) 6,671 6,102 6,252
Add: Income from sale of facilities 428 8 23
Add: Benefits from legal claim - - 246
Less: Interest expenses 1,755 1,690 1,707
Less: Losses on debt retirement 9 39 4
Profit before deducting taxes 5,335 4,381 4,810
Less: Provision for taxes (946) (1,638) (1,378)
Profit after deducting taxes (D) 4,389 2,743 3,432
Weighted average no. of share outstanding (in millions) (E) 347.30 362.31 383.59
Basic earnings per share (D÷E) 12.64 7.57 8.95
Table No. 2 Consolidated Statement of Income
Consolidated Statement of Financial Position
Secure Best Marks with AI Grader
Need help grading? Try our AI Grader for instant feedback on your assignments.

HCA Healthcare Inc.
Nashville, Tennessee, U.S.
Amount in US Dollars in millions
Particulars 2018 2017 2016
EQUITY & LIABILITIES
Common shareholders’ equity 3 4 4
Accumulated losses (381) (278) (338)
Retained deficit (4,572) (6,532) (6,968)
Non-controlling interests 2,032 1,811 1,669
Total Equity (A) (2,918) (4,995) (5,633)
Long-term liabilities/debts 32,033 32,858 31,160
Professional liabilities (risks) 1,275 1,198 1,148
Income tax and other liabilities 1,248 1,374 1,249
Total Non-Current Liabilities (B) 34,556 35,430 33,557
Accounts payables 2,577 2,606 2,318
Outstanding salaries 1,580 1,369 1,265
Other outstanding expenses 2,624 1,983 2,035
Short-term debts 788 200 216
Total Current Liabilities (C) 7,569 6,158 5,834
TOTAL EQUITY & LIABILITIES (A+B+C) 39,207 36,593 33,758
ASSETS
Property, Plant and Equipment (Note-1) 19,757 17,895 16,352
Investments in subsidiaries 362 418 336
Investments in affiliates 232 199 206
Goodwill and other intangibles 7,953 7,394 6,704
Other non-current assets 690 710 1,074
Total Non-Current Assets (A) 28,994 26,616 24,672
Cash and cash equivalents 502 732 646
Accounts receivable 6,789 6,501 5,826
Inventories 1,732 1,573 1,503
Other current assets 1,190 1,171 1,111
Total Current Assets (B) 10,213 9,977 9,086
TOTAL ASSETS (A+B) 39,207 36,593 33,758
Table No. 3 Consolidated Statement of Financial Position

Note-1
Property, plant and equipment
Amount in US Dollars in millions
Particulars 2018 2017 2016
Land 1,944 1,746 1,611
Buildings 15,659 14,249 13,546
Equipment 23,577 22,168 20,580
Under construction properties 1,785 1,921 1,318
Total at costs 42,965 40,084 37,055
Less: Accumulated depreciation (23,208) (22,189) (20,703)
Written down value: 19,757 17,895 16,352
Table No. 4 Note for Property, Plant and Equipment
Financial Health & Performance Measurement
Yearly Comparison
HCA Healthcare Inc.
Nashville, Tennessee, U.S.
Amount in US Dollars in millions
Particulars 2018 2017 2016
1. Net Working Capital
(a) Current Assets 10,213.00 9,977.00 9,086.00
(b) Current Liabilities 7,569.00 6,158.00 5,834.00
Net Working Capital (a-b) 2,644.00 3,819.00 3,252.00
2. Current Ratio
(a) Current Assets 10,213.00 9,977.00 9,086.00
(b) Current Liabilities 7,569.00 6,158.00 5,834.00
Current Ratio (a/b) 1.35 1.62 1.56
3. Quick Ratio
(a) Current Assets 10,213.00 9,977.00 9,086.00
(b) Inventories 1,732.00 1,573.00 1,503.00
(c) Quick Assets (a-b) 8,481.00 8,404.00 7,583.00

(d) Current Liabilities 7,569.00 6,158.00 5,834.00
Quick Ratio (c/d) 1.12 1.36 1.30
4. Asset Turnover Ratio
(a) Total Revenue 46,677.00 43,614.00 41,490.00
(b) Total Assets 39,207.00 36,593.00 33,758.00
Asset Turnover (a/b) 1.19 1.19 1.23
5. Operating Profit Margin
(a) Operating Profit 6,671.00 6,102.00 6,252.00
(b) Total Revenue 46,677.00 43,614.00 41,490.00
Operating Profit Ratio [(a/b)x100] 14.29% 13.99% 15.07%
6. Net Profit Margin
(a) Net Profit 4,389.00 2,743.00 3,432.00
(b) Total Revenue 46,677.00 43,614.00 41,490.00
Net Profit Ratio [(a/b)x100] 9.40% 6.29% 8.27%
7. Total Investment to Long-term Liabilities
(a) Total Investment 594.00 617.00 542.00
(b) Long-term Liabilities 34,556.00 35,430.00 33,557.00
Total Investment to Long-term Liabilities 0.02 0.02 0.02
8. Ratio of Fixed Assets to Funded Debts
(a) Fixed Assets 19,757.00 17,895.00 16,352.00
(b) Total Debts 32,821.00 33,058.00 31,376.00
Ratio of Fixed Assets to Funded Debts (a/b) 1.24 2.07 2.92
9. Dividend Payout Ratio
(a) Dividend per share 1.40 - -
(b) Earnings per share 12.64 7.57 8.95
Dividend Payout Ratio 11.08% 0.00% 0.00%
10. Cash Ratio/Absolute Liquidity Ratio
(a) Cash and cash equivalents 502.00 732.00 646.00
(b) Current Liabilities 7,569.00 6,158.00 5,834.00
Cash Ratio (a/b) 0.07 0.12 0.11
11. Solvency Ratio
(a) Net Profit 4,389.00 2,743.00 3,432.00
(b) Total Liabilities 42,125.00 41,588.00 39,391.00
Paraphrase This Document
Need a fresh take? Get an instant paraphrase of this document with our AI Paraphraser

Solvency Ratio (a/b) 0.10 0.07 0.09
Table No. 5 Financial Health & Performance Measurement
Computation of Growth Rates
Yearly Comparison
HCA Healthcare Inc.
Nashville, Tennessee, U.S.
Amount in US Dollars in millions
Particulars 2018 2017 2016 2015
Net Income 5,335 4,381 4,810 2,696
Total Assets 39,207 36,593 33,758 32,744
Revenue from operations 46,677 43,614 41,490 39,678
Cash and cash equivalents 502 732 646 741
Growth in
Net Income 21.78% -8.92% 78.41%
Total Assets 7.14% 8.40% 3.10%
Revenue from operations 7.02% 5.12% 4.57%
Cash and cash equivalents -31.42% 13.31% -12.82%
Table No. 6 Calculation of Growth Rates
Note for Growth rate computation
Particulars Net
Income
Total
Assets
Revenue from
Operations
Cash and
cash
equivalents
(a) Figures for the year 2015 2,696 32,744 39,678 741
(b) Figures for the year 2016 4,810 33,758 41,490 646
(c) Increase/(decrease) (b-a) 2,114 1,014 1,812 (95)
% increase/(decrease) in 2016 (c/a)×100 78.41% 3.10% 4.57% -12.82%
(a) Figures for the year 2016 4,810 33,758 41,490 646
(b) Figures for the year 2017 4,381 36,593 43,614 732
(c) Increase/(decrease) (b-a) (429) 2,835 2,124 86
% increase/(decrease) in 2017 (c/a)×100 -8.92% 8.40% 5.12% 13.31%
(a) Figures for the year 2017 4,381 36,593 43,614 732

(b) Figures for the year 2018 5,335 39,207 46,677 502
(c) Increase/(decrease) (b-a) 954 2,614 3,063 (230)
% increase/(decrease) in 2018 (c/a)×100 21.78% 7.14% 7.02% -31.42%
Table No. 7 Note for Growth Rate Calculation
The revenue of healthcare in 2016 was 41490 which were increased to 46677 in 2018. The net
profit of healthcare in 2016 was 8.27 percent which reached to 9.40 percent in the year 2018. The
current ratio in 2018 as calculated in the above table was 1.35 which indicates that the hospital
can meet all its short term liabilities (Maslach et al. 2016, p-269). The income from facilities has
also been increased in the financial year 2018. The hospital experienced a high increase in
revenue due to number of reasons such as occupancy rate of the bed has been reduced by 1
percent as compared to previous year and the number of patients was also increased in
comparison to the previous years. In 2016, only 170 hospitals were being controlled by the
healthcare and further 9 more hospitals were constructed by the owner of the healthcare. It can
be seen from the above tablet that the cash and cash equivalents have been decreased in 2018
when compared to the financial year 2017. The solvency ratio of the hospital in 2018 is 0.10
which means that the healthcare is not financially sound as it is less than 20 percent. This ratio
indicates that the ability of HCA is not sufficient to cover all its long term and short term
requirements.

References
Glassdoor.co.in. (2020), [online] Available at: https://www.glasdoor.co.in/overview/Working-at-
HCA-Healtcare-EI_ IE2062, 11/25.htm [Accessed 15 FEB. 2020].
Maślach, D., Markiewicz, J., Warelis, A. and Krzyżak, M., (2016). Importance of financial
liquidity in hospital management. EPIDEMIOLOGICAL REVIEW, 2017, p.369.
Rosita, T., Nurwahyuni, A. and Sari, K., 2018. The Implications of National Health Insurance on
District Public Hospitals Performance: Financial Analysis. KnE Life Sciences, pp.205-215.
1 out of 10
Related Documents

Your All-in-One AI-Powered Toolkit for Academic Success.
+13062052269
info@desklib.com
Available 24*7 on WhatsApp / Email
Unlock your academic potential
© 2024 | Zucol Services PVT LTD | All rights reserved.