Market Research Survey Report: Customer Behavior Analysis
VerifiedAdded on 2019/11/26
|14
|2123
|166
Report
AI Summary
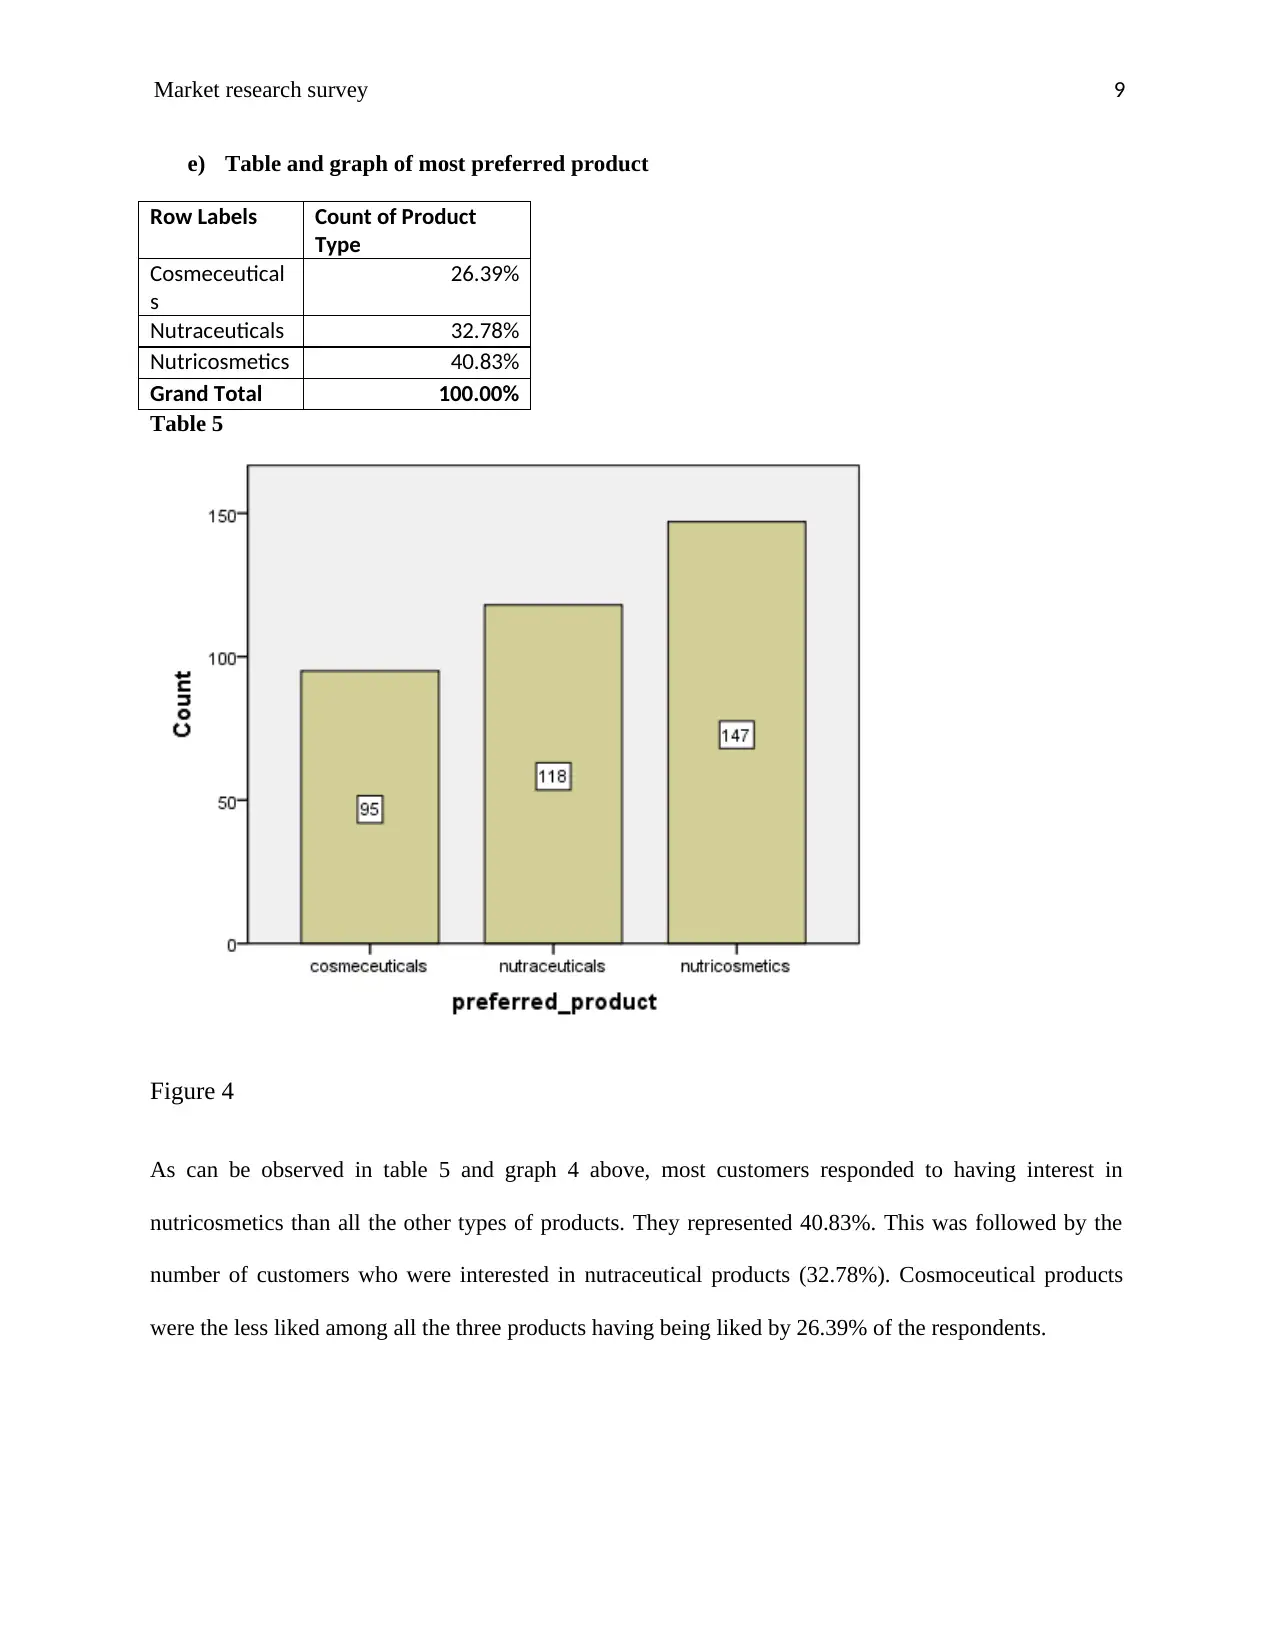
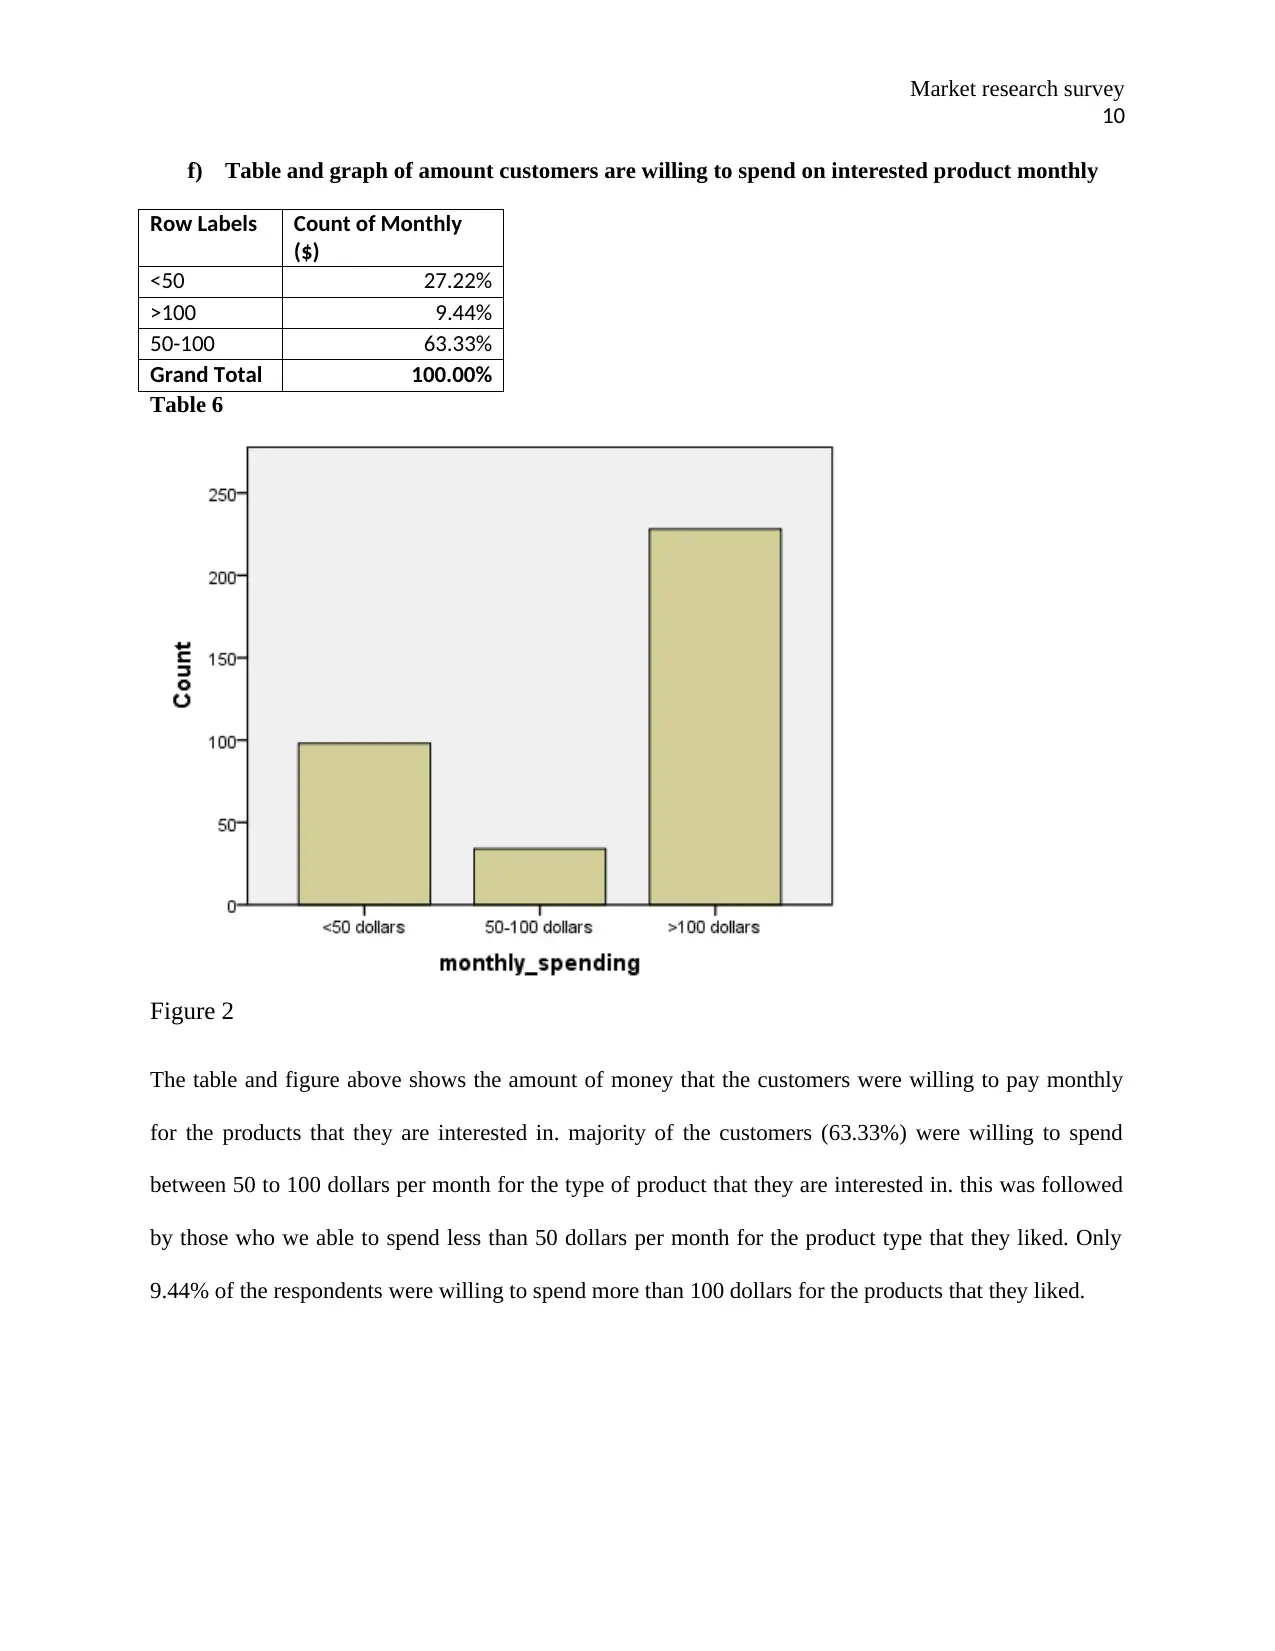
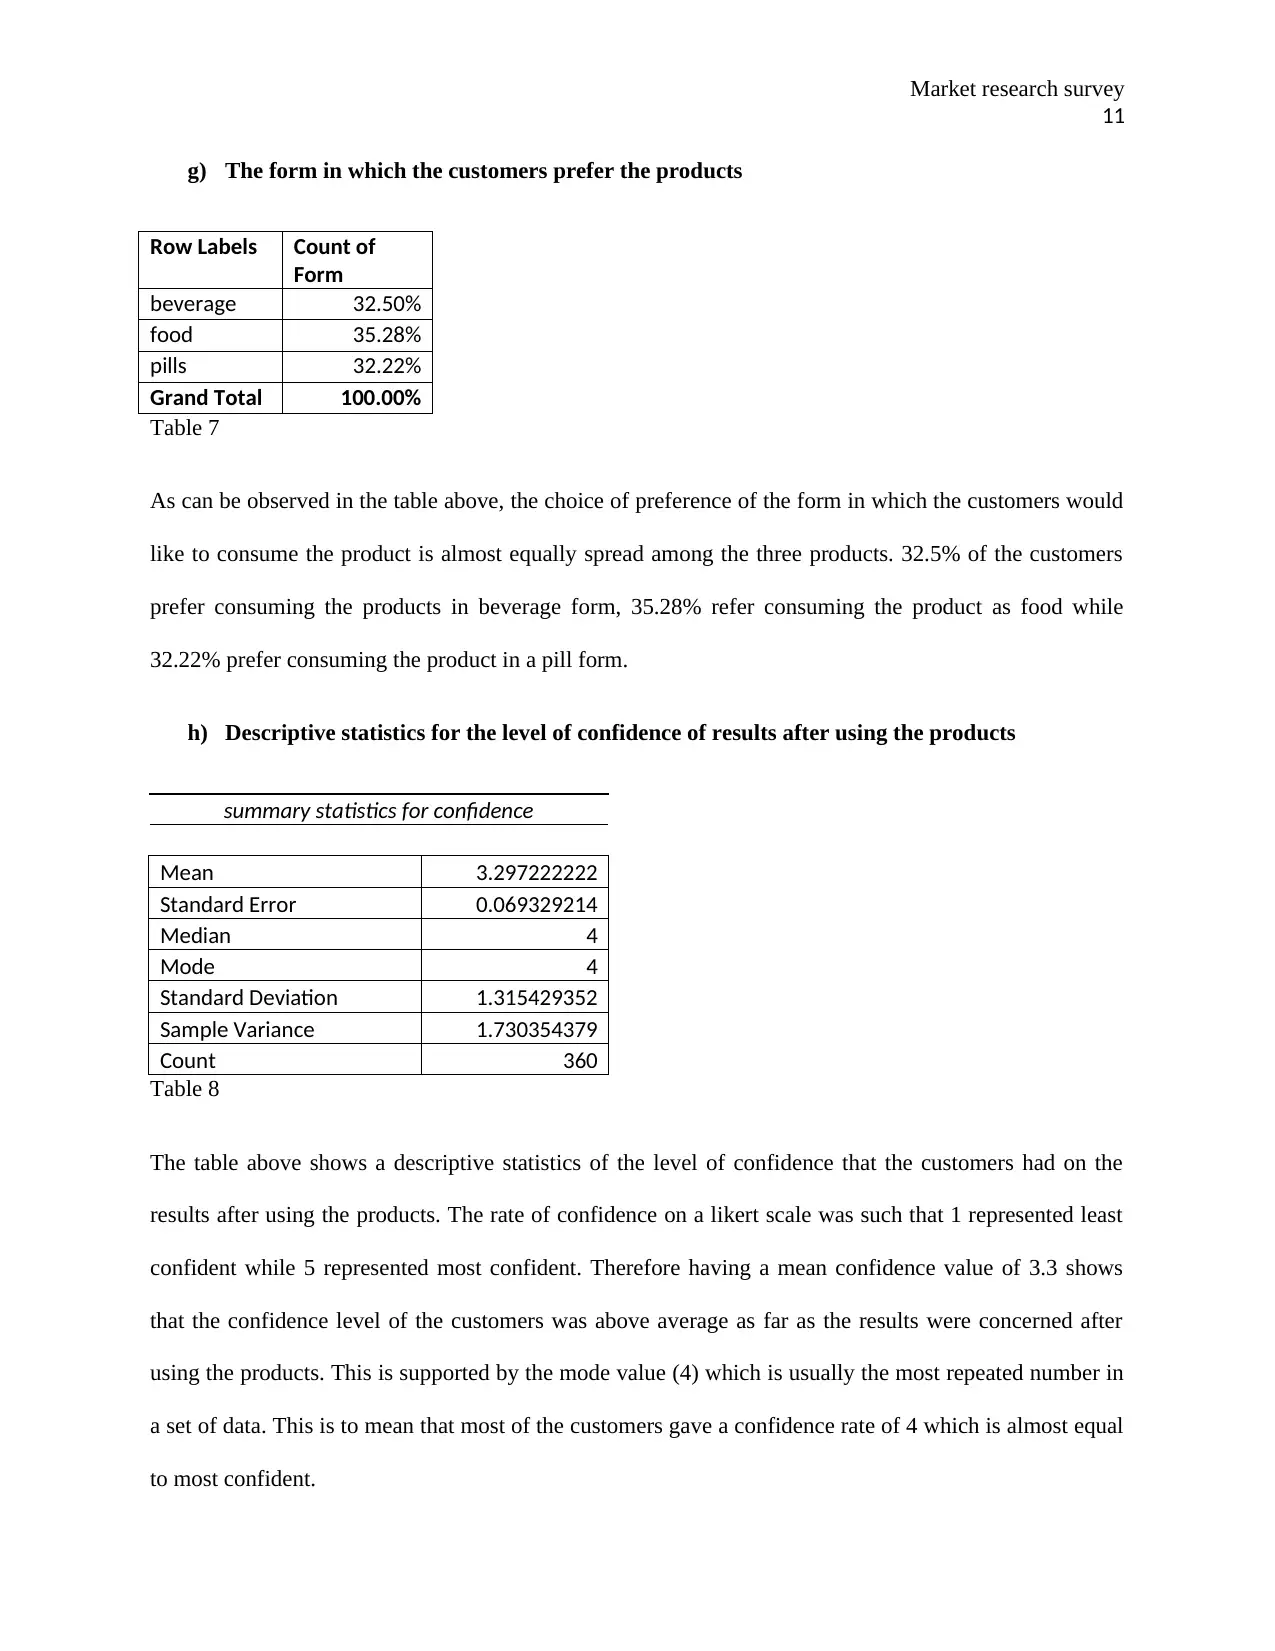
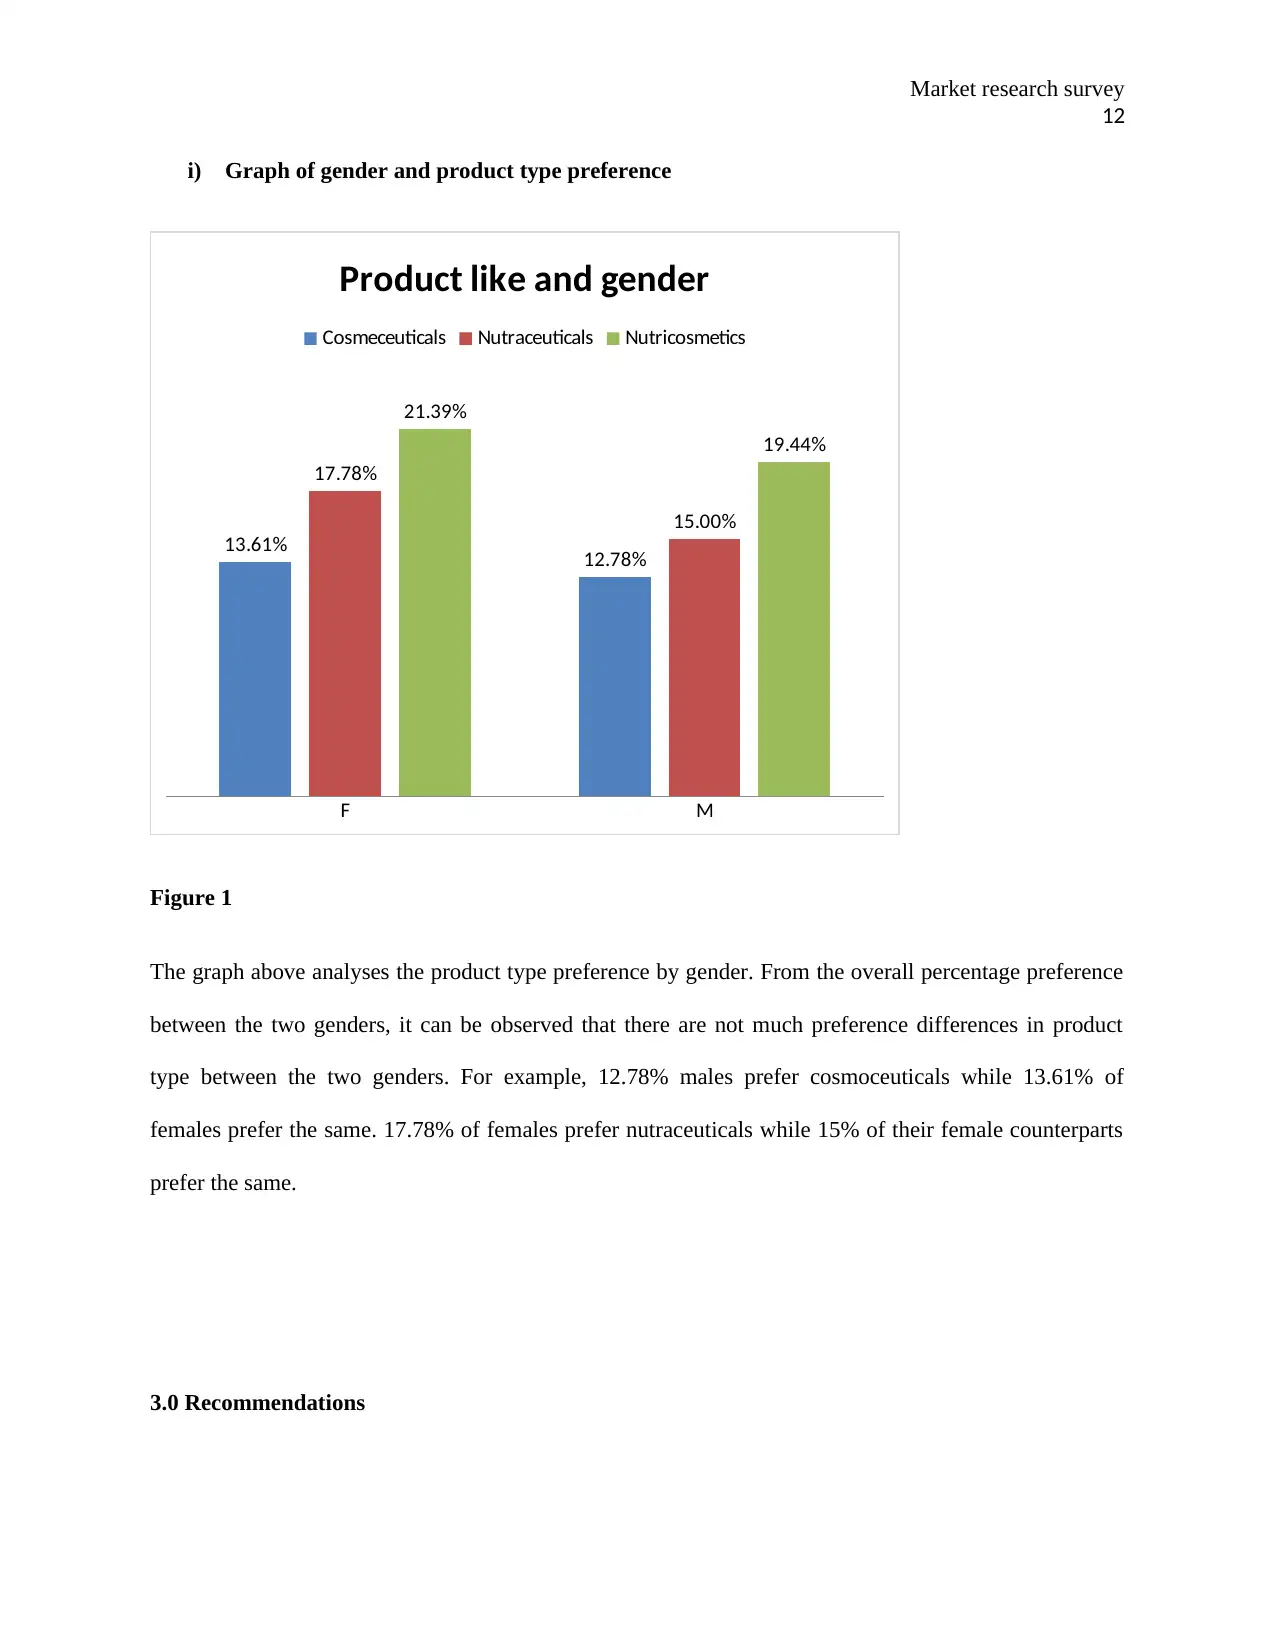
This market research survey report analyzes consumer behavior concerning nutraceuticals, cosmoceuticals, and nutrocosmetics to inform marketing strategies. The study, conducted on a sample of 360 respondents, explores customer preferences regarding product types, preferred channels of communication (social media, email, post), and willingness to spend. Key findings reveal a preference for nutricosmetics, with social media identified as the most effective channel for reaching customers. The report details customer demographics, including age, gender, and income levels, and examines product form preferences (beverage, food, pills) and customer confidence in product results. The analysis includes descriptive statistics, tables, and graphs to illustrate the data, providing a comprehensive overview of consumer behavior and making recommendations for targeted marketing efforts, such as focusing on nutricosmetics and leveraging social media to increase customer engagement and sales.

Market research survey 1
Student name:
Student ID:
Course Name:
Course Code
Market Research
Student name:
Student ID:
Course Name:
Course Code
Market Research
Paraphrase This Document
Need a fresh take? Get an instant paraphrase of this document with our AI Paraphraser

Market research survey 2
Executive summary
This research survey was focused on understanding the customers’ buying and consumption behavior as
far as nutriceutical, cosmoceutical and nutrocosmetics are concerned. The understanding of the customer
behavior would therefore form a basis on which the company was going to lay strategies as far as
marketing is concerned so as to increase its customer base. A close analysis showed that most customers
preferred being reached through social media. The research survey also established that most customers
preferred nutrocosmetics compared to the other two products. This report therefore recommends to the
management that it should concentrate more on social media as a way of reaching its customers in order
to increase its customer base. to add on, it should produce more of nutrocosmetics compared to the other
two products.

Market research survey 3
Table of content Page
1.0 Introduction 4
1.1 Main objective 5
1.2 Specific objectives 5
2.0 Methodology 5
2.1 Data analysis and results 6
3.0 Recommendations 13
4.0 References 14
Table of content Page
1.0 Introduction 4
1.1 Main objective 5
1.2 Specific objectives 5
2.0 Methodology 5
2.1 Data analysis and results 6
3.0 Recommendations 13
4.0 References 14
⊘ This is a preview!⊘
Do you want full access?
Subscribe today to unlock all pages.

Trusted by 1+ million students worldwide

Market research survey 4
1.0 Introduction
It goes without say that there has been an emerging trend in the health, nutrition and physical wellbeing.
Just to shed some light on the three categories of products, the health or products with medicinal values
are known as pharmaceuticals, products with food supplements known as nutritional products while
personal care products are known as cosmetics. Companies dealing in health products, nutritional
products and products that enhance physical wellbeing have in the recent past seen the need to diversify
their products due to market demand across the world. In an effort to achieve their objectives of
diversifying the market, they have created sub-industries that manufacture products with a mix of two of
the three product values afore mentioned. From cosmetics and pharmaceuticals, cosmoceutical products
have been manufactured. From nutritional and pharmaceutical products, nutraceutical products have been
produced while from nutrition and cosmetics, nutricosmetic products have been produced. By definition,
nutraceuticals can be said to be those products produced from food sources that apart from providing
nutritional value they also provide health benefits. Cosmoceuticals on the other hand refer to cosmetic
products that have got medicinal benefits. Lastly, nutricosmetic refer to nutrient supplements that are
formulated for beauty purposes.
Statistics have it that these industries in the recent years have had a global growth of from 4% to 8%. The
research also indicates that the three industries have had varying domination across the global market.
Asia and in particular Japan and China have been found to dominate in nutricosmetics contributing to
90% of the sales made globally. United States of America on the other hand has been found to dominate
in production of Nutraceuticals. It accounts for about 45% of the total global sales in the product. The
core driving factor for these industries has been found to be ever increasing demand for preventive
healthcare and anti-aging products.
Paraphrase This Document
Need a fresh take? Get an instant paraphrase of this document with our AI Paraphraser

Market research survey 5
1.1 Main objective
In any business enterprise, it is always a challenge to hit the ground running especially in a market full of
competitors. It is usually therefore very important to understand the market as to produce products and
services that are in line with the demand of the market. It is against this background that this research
survey was conducted to understand the cosmoceutical, nutraceutical and nutricosmetic market so as to
design an effective marketing strategy having understood the market opportunities, target market and
channels for campaigns.
1.2 Specific objectives
Apart from having the main objective, the research also had specific objectives to achieve. The specific
objectives were as listed below;
To establish the products that has got the highest demand in the market.
To determine the form in which the customers would love the products to be in.
To determine the preferred channels for reaching the customers.
To establish whether the customers have confidence in the products that they buy.
2.0 Methodology
The data of this research survey was organized by coding the non- numerical variables for the purpose of
easy analysis. The data was then analyzed using both excel and statistical package for social sciences
(SPSS). Descriptive and inferential statistics was used to analyze the data. Measures of central tendencies
and measures of dispersion were used to describe various numerical variables such as age and income.
Inferential statistics was used to establish relationship between variables. Graphs, charts and tables were
also used to summarize and present data.

Market research survey 6
2.1 Data analysis and results
a) Age summary statistics
Row Labels Count of Age
Band
30-40 22.78%
40-50 15.83%
50-60 13.06%
60-70 10.56%
<30 25.00%
>70 12.78%
Grand Total 100.00%
Table 1
From the table above, the distribution of the respondents in terms of their age brackets can be clearly
seen. It can be observed that most customers interviewed (25%) are below the age of 30 years. This age is
followed closely by those who are between 30 to 40 years who represent 22.7%. The least in number
were customers who were between 60 to 70 years who represent 10.56%.
b) Table and graph of gender summary statistics
Row Labels Count of
Gender
F 52.78%
M 47.22%
Grand Total 100.00%
Table 2
⊘ This is a preview!⊘
Do you want full access?
Subscribe today to unlock all pages.

Trusted by 1+ million students worldwide

Market research survey 7
FEMALE MALE
190
170
Graph of distribution by gender
Figure 1
The table and graph above show the distribution of the respondents in terms of their gender. It can be
observed that most customers interviewed (52.78%) are females while 47.22% are males.
c) Annual income tabulation
Row Labels Count of Income
($)
< 50,000 21.39%
> 100,000 10.28%
50,000-70,000 28.61%
70,000-90,000 39.72%
Grand Total 100.00%
Table 3
The table above shows the distribution of the respondents in terms of their annual income brackets. It can
be observed that most customers interviewed (39.72%) earn between 70,000 to 90,000 dollars. This is
followed by a group which earns between 50,000 to 70,000 dollars. This group represents 28.61%. The
lowest number of respondents (10.28%) earns more than 100,000 dollars.
Paraphrase This Document
Need a fresh take? Get an instant paraphrase of this document with our AI Paraphraser

Market research survey 8
d) Table and graph of preferred contact channel
Row Labels Count of
Channel
Email 36.11%
Post 23.06%
Social Media 40.83%
Grand Total 100.00%
Table 4
Figure 3
The table and graph above show a summary table of the various preferred channels through which the
customers preferred to be contacted through. It can be observed that majority of the customers preferred
to be contacted through social media. They represented 40.83%. Those who preferred to be contacted
through emails were the second largest in number and represented 36.11%. The respondents who
preferred to be contacted through post were the least in number. They only represented 23.06%.

Market research survey 9
e) Table and graph of most preferred product
Row Labels Count of Product
Type
Cosmeceutical
s
26.39%
Nutraceuticals 32.78%
Nutricosmetics 40.83%
Grand Total 100.00%
Table 5
Figure 4
As can be observed in table 5 and graph 4 above, most customers responded to having interest in
nutricosmetics than all the other types of products. They represented 40.83%. This was followed by the
number of customers who were interested in nutraceutical products (32.78%). Cosmoceutical products
were the less liked among all the three products having being liked by 26.39% of the respondents.
⊘ This is a preview!⊘
Do you want full access?
Subscribe today to unlock all pages.

Trusted by 1+ million students worldwide

Market research survey
10
f) Table and graph of amount customers are willing to spend on interested product monthly
Row Labels Count of Monthly
($)
<50 27.22%
>100 9.44%
50-100 63.33%
Grand Total 100.00%
Table 6
Figure 2
The table and figure above shows the amount of money that the customers were willing to pay monthly
for the products that they are interested in. majority of the customers (63.33%) were willing to spend
between 50 to 100 dollars per month for the type of product that they are interested in. this was followed
by those who we able to spend less than 50 dollars per month for the product type that they liked. Only
9.44% of the respondents were willing to spend more than 100 dollars for the products that they liked.
Paraphrase This Document
Need a fresh take? Get an instant paraphrase of this document with our AI Paraphraser

Market research survey
11
g) The form in which the customers prefer the products
Row Labels Count of
Form
beverage 32.50%
food 35.28%
pills 32.22%
Grand Total 100.00%
Table 7
As can be observed in the table above, the choice of preference of the form in which the customers would
like to consume the product is almost equally spread among the three products. 32.5% of the customers
prefer consuming the products in beverage form, 35.28% refer consuming the product as food while
32.22% prefer consuming the product in a pill form.
h) Descriptive statistics for the level of confidence of results after using the products
summary statistics for confidence
Mean 3.297222222
Standard Error 0.069329214
Median 4
Mode 4
Standard Deviation 1.315429352
Sample Variance 1.730354379
Count 360
Table 8
The table above shows a descriptive statistics of the level of confidence that the customers had on the
results after using the products. The rate of confidence on a likert scale was such that 1 represented least
confident while 5 represented most confident. Therefore having a mean confidence value of 3.3 shows
that the confidence level of the customers was above average as far as the results were concerned after
using the products. This is supported by the mode value (4) which is usually the most repeated number in
a set of data. This is to mean that most of the customers gave a confidence rate of 4 which is almost equal
to most confident.

Market research survey
12
i) Graph of gender and product type preference
F M
13.61% 12.78%
17.78%
15.00%
21.39%
19.44%
Product like and gender
Cosmeceuticals Nutraceuticals Nutricosmetics
Figure 1
The graph above analyses the product type preference by gender. From the overall percentage preference
between the two genders, it can be observed that there are not much preference differences in product
type between the two genders. For example, 12.78% males prefer cosmoceuticals while 13.61% of
females prefer the same. 17.78% of females prefer nutraceuticals while 15% of their female counterparts
prefer the same.
3.0 Recommendations
⊘ This is a preview!⊘
Do you want full access?
Subscribe today to unlock all pages.

Trusted by 1+ million students worldwide
1 out of 14
Related Documents

Your All-in-One AI-Powered Toolkit for Academic Success.
+13062052269
info@desklib.com
Available 24*7 on WhatsApp / Email
Unlock your academic potential
Copyright © 2020–2025 A2Z Services. All Rights Reserved. Developed and managed by ZUCOL.