Analyzing Health Development Data in East Asia & Pacific Region

Verified

Added on  2020/06/04

|19
|2668
|116
Project
AI Summary
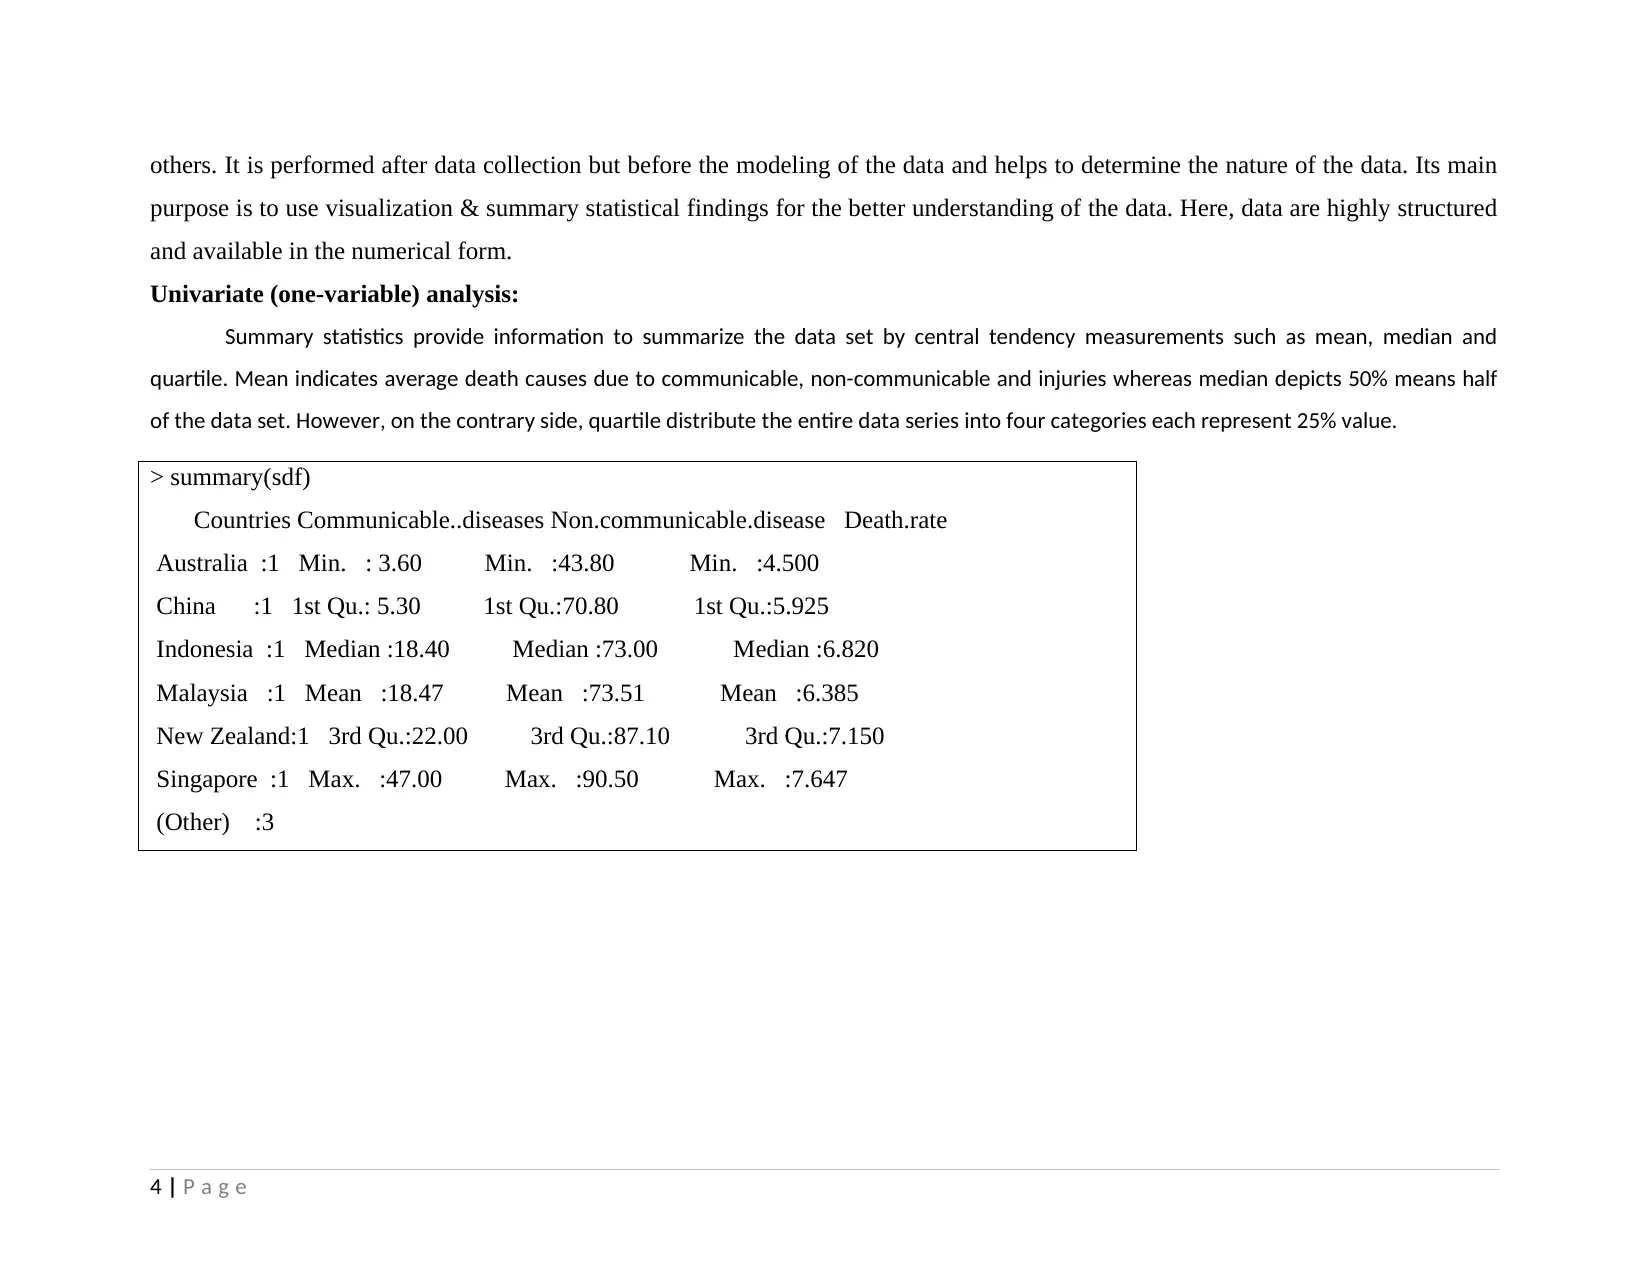
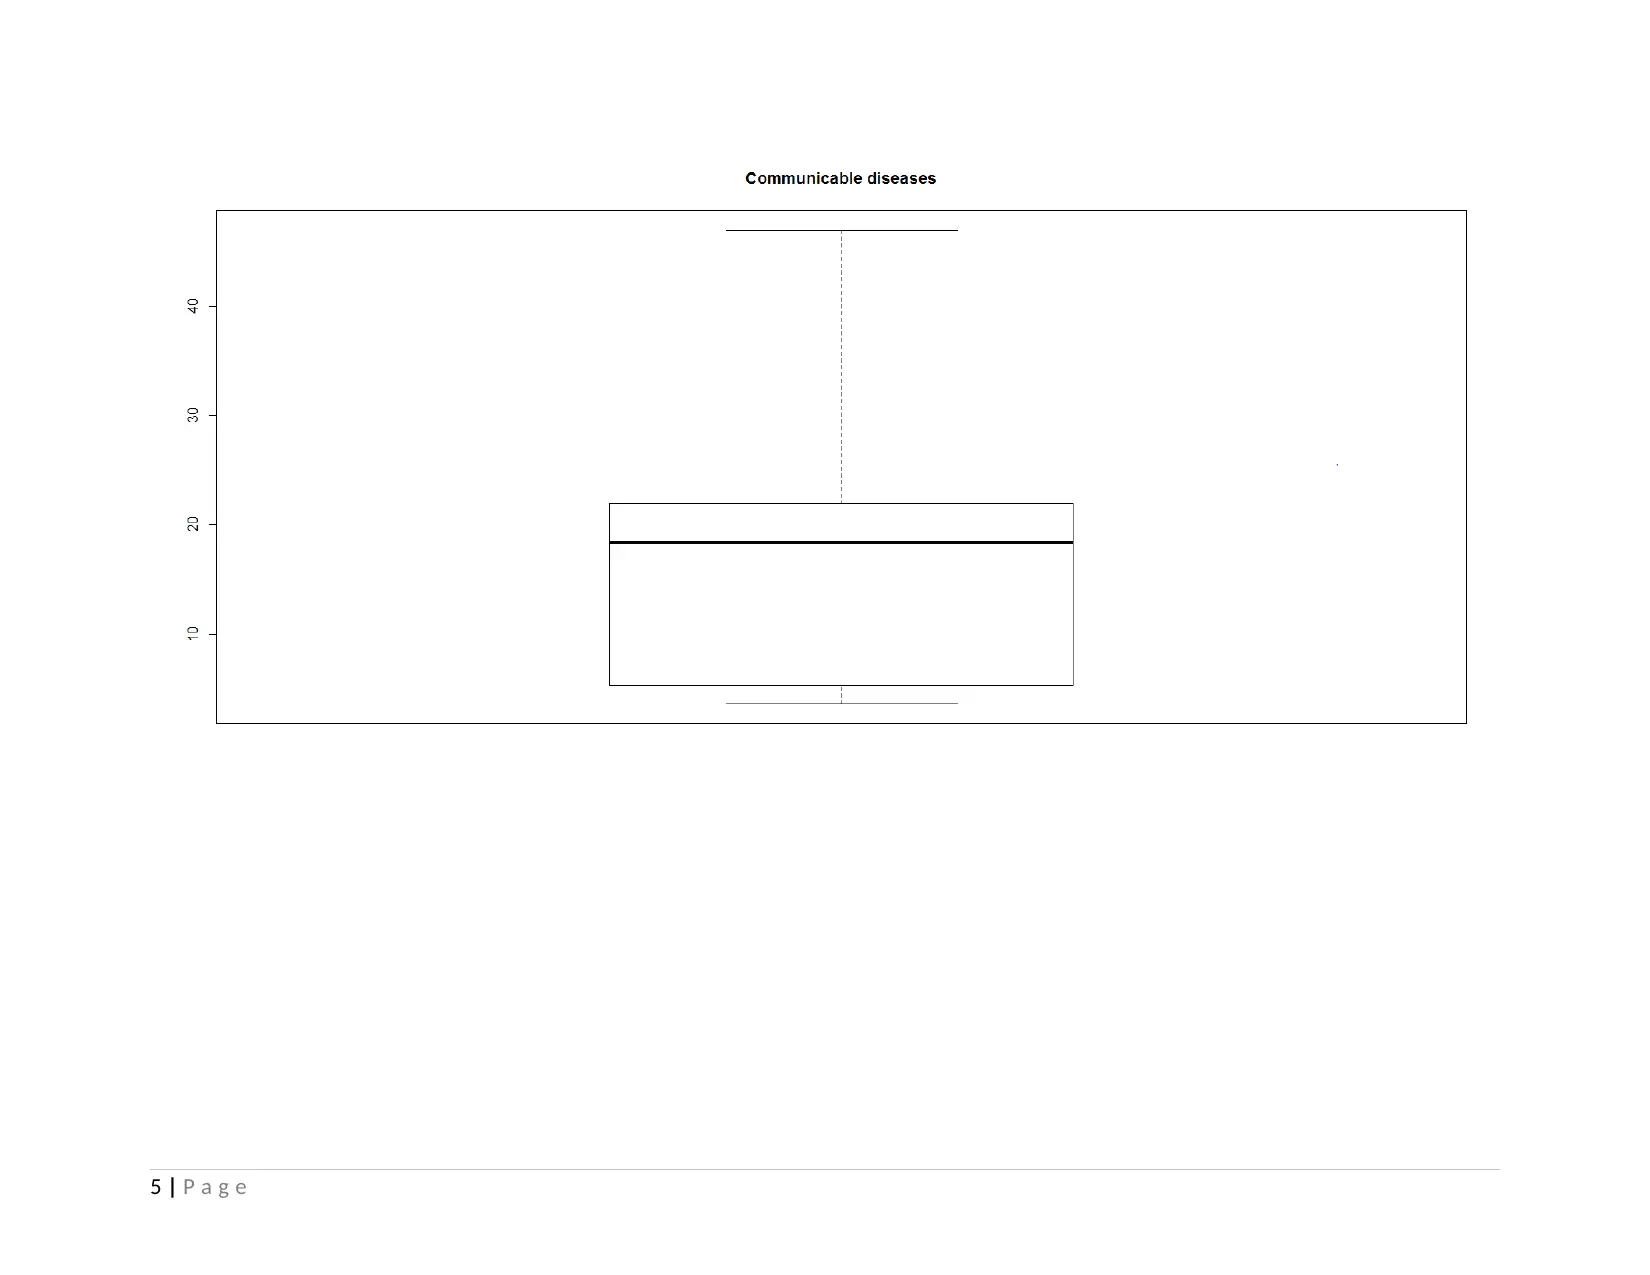
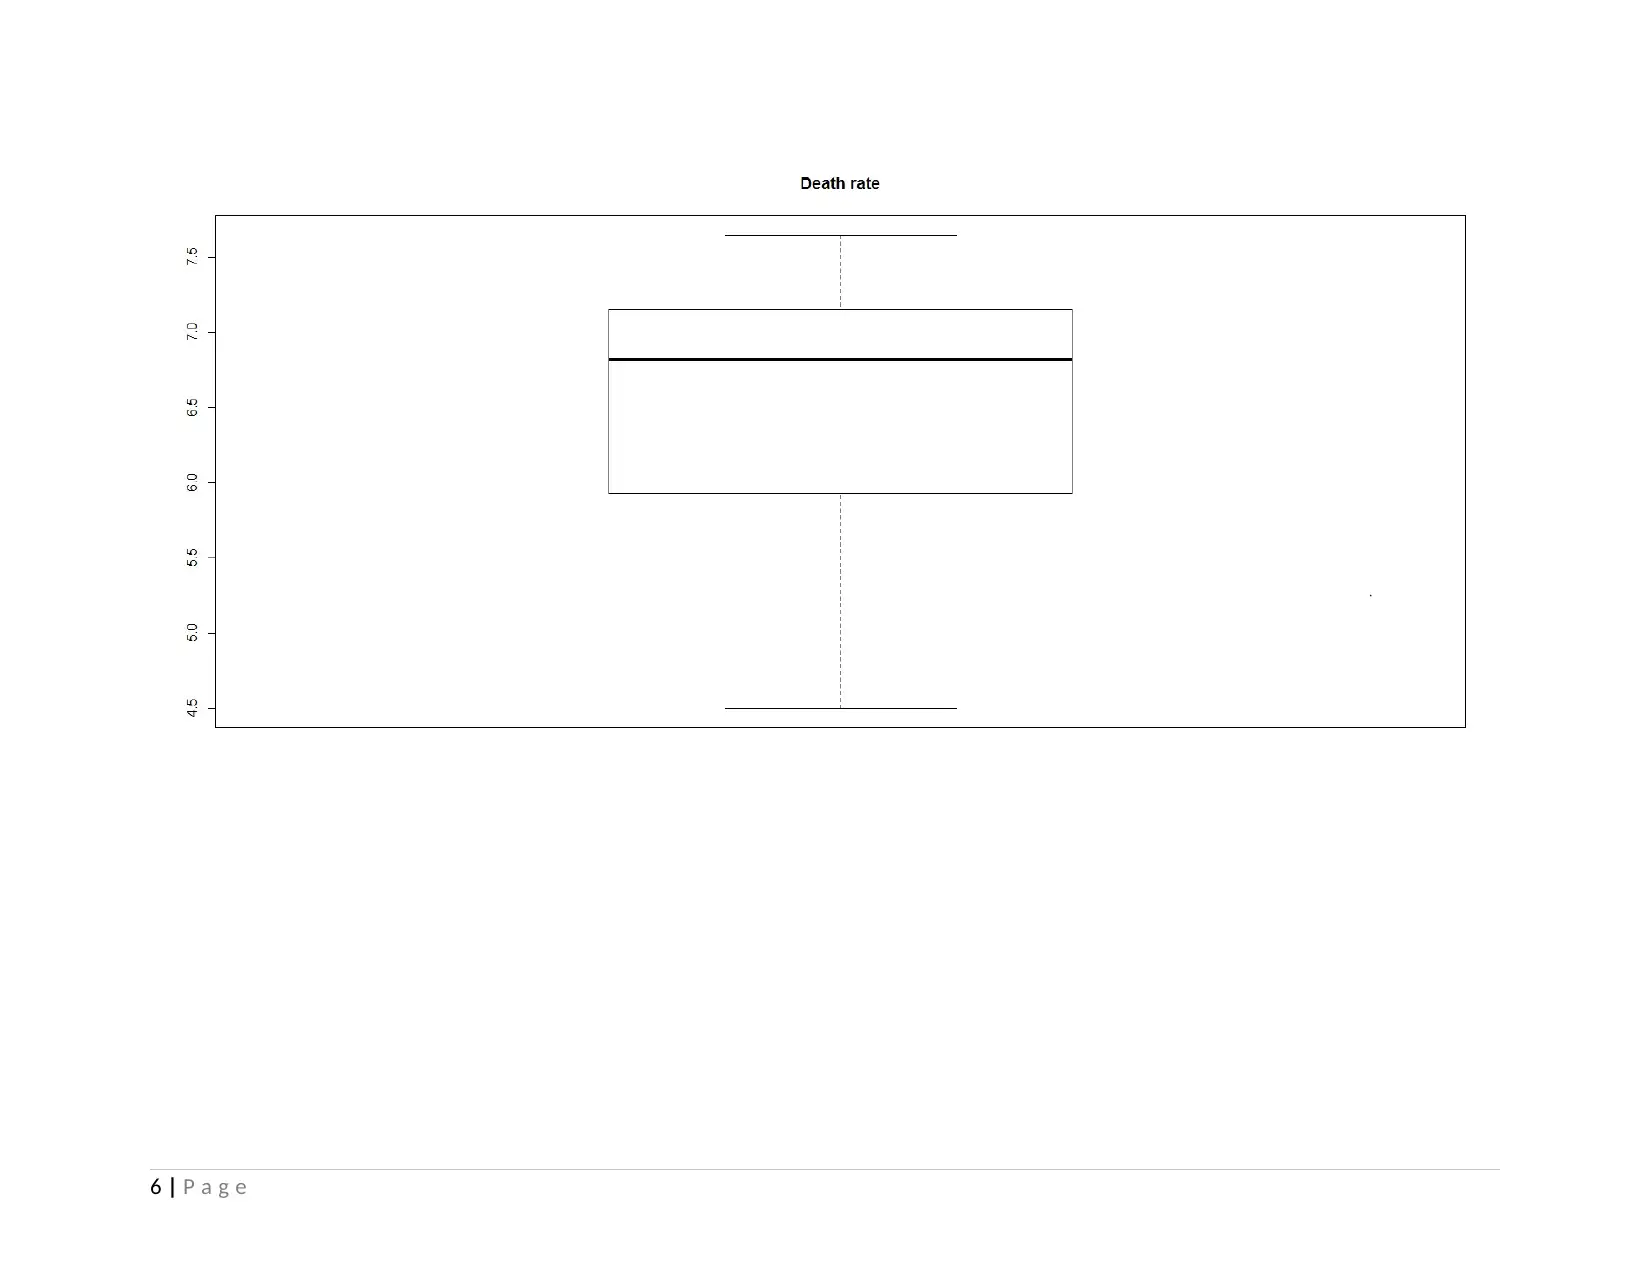
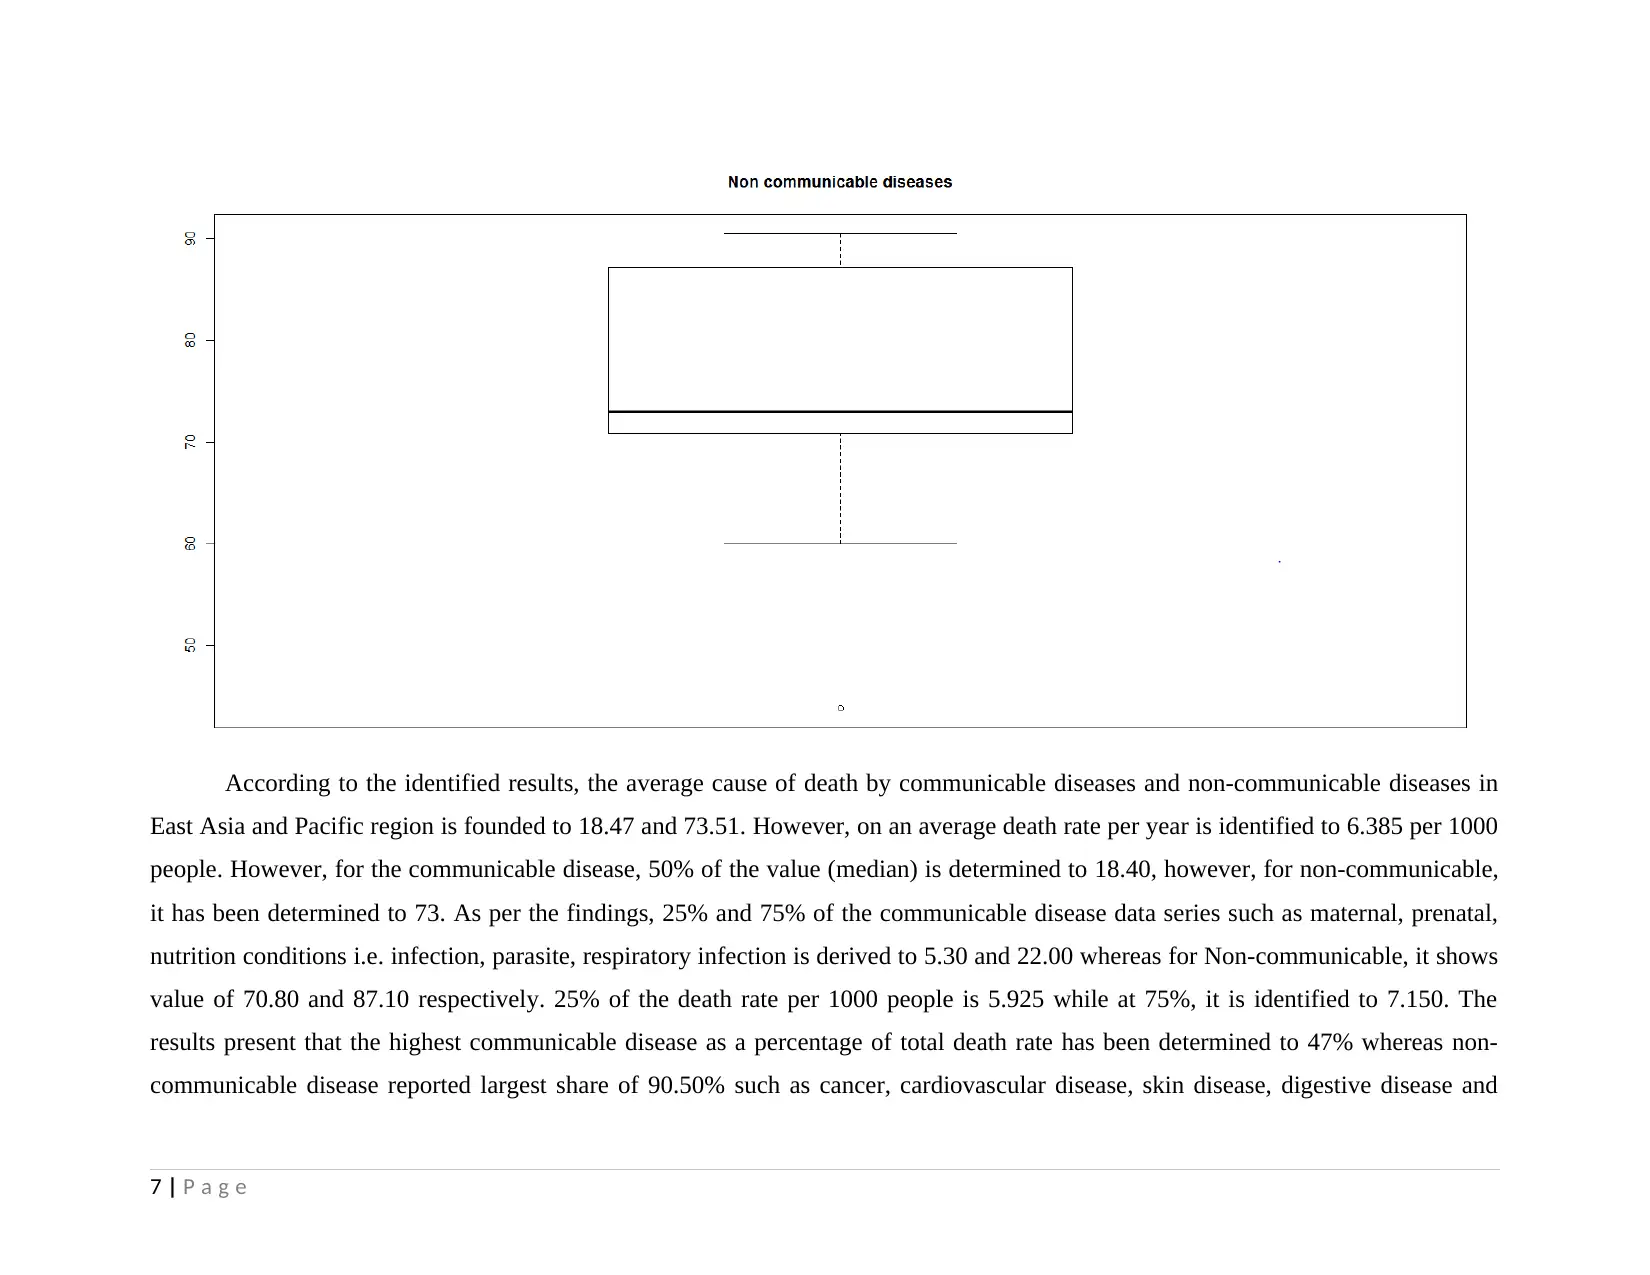
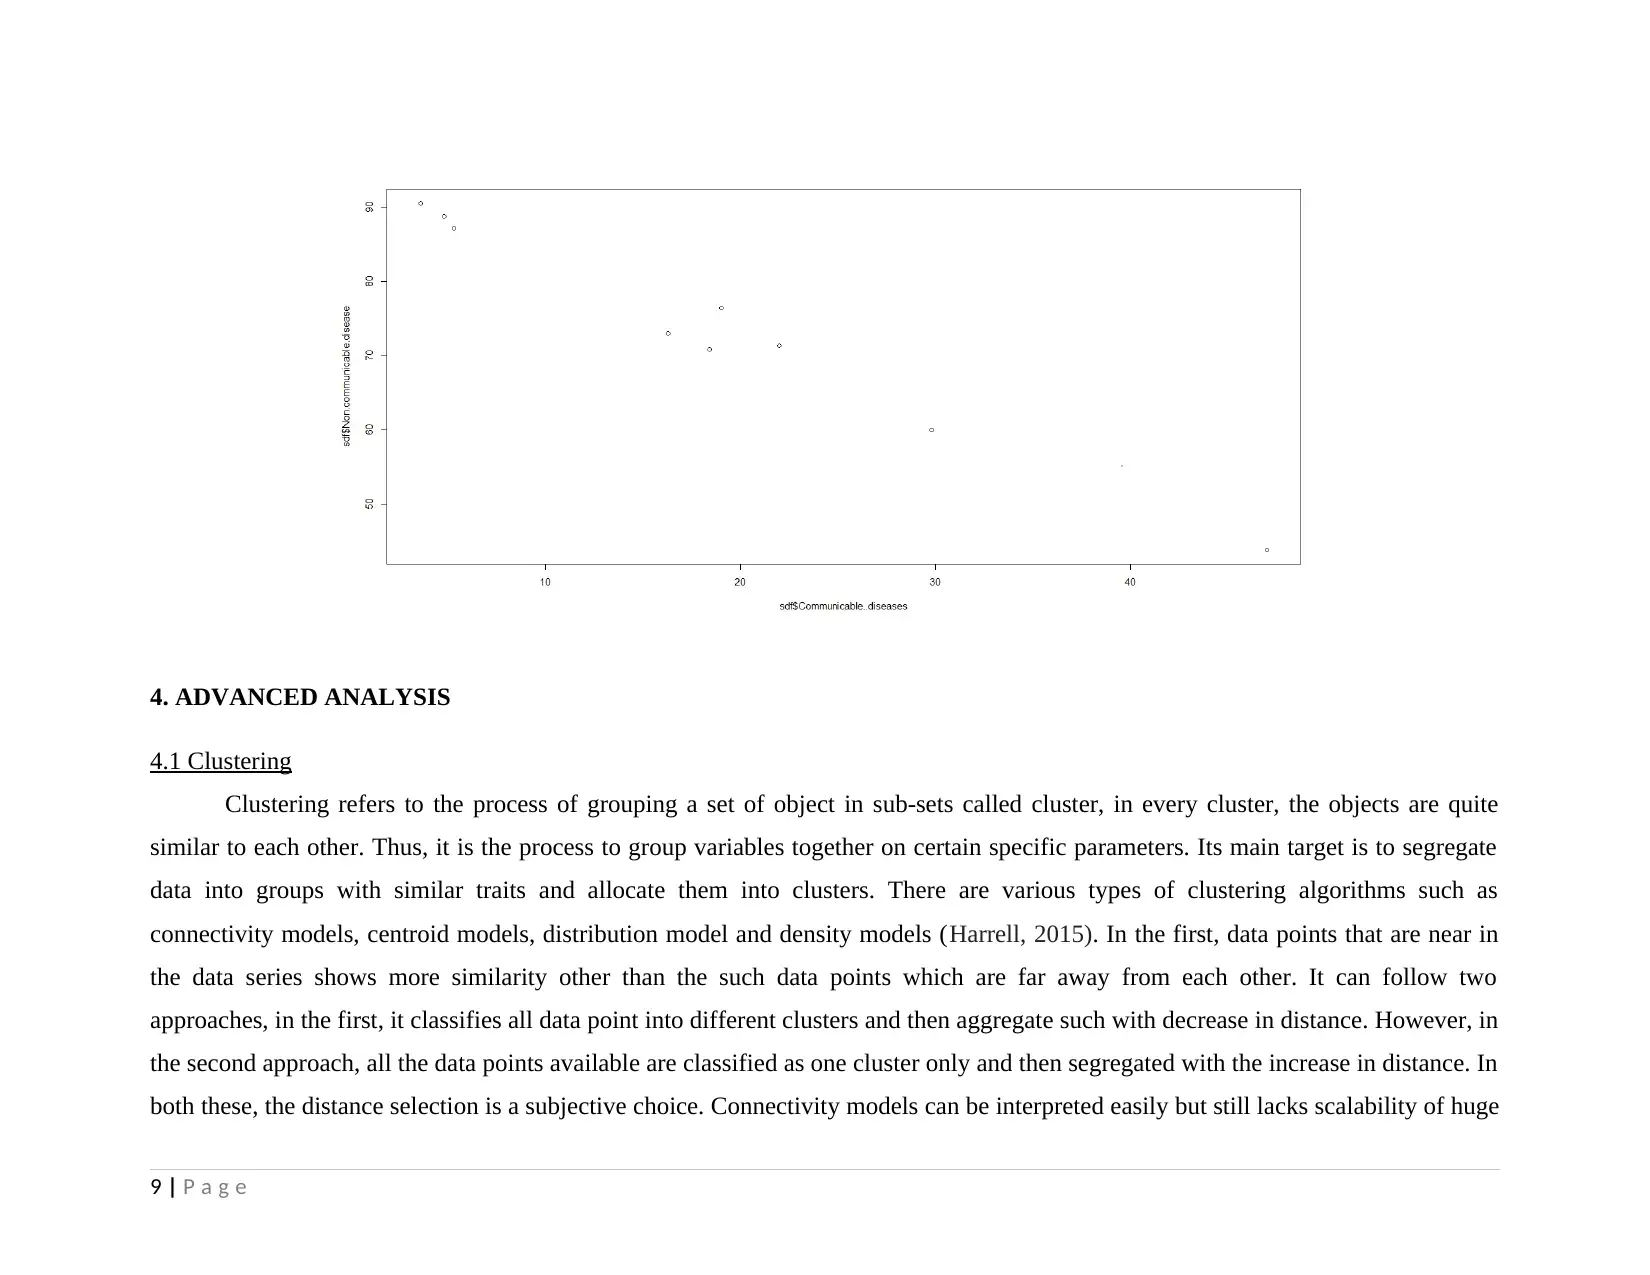
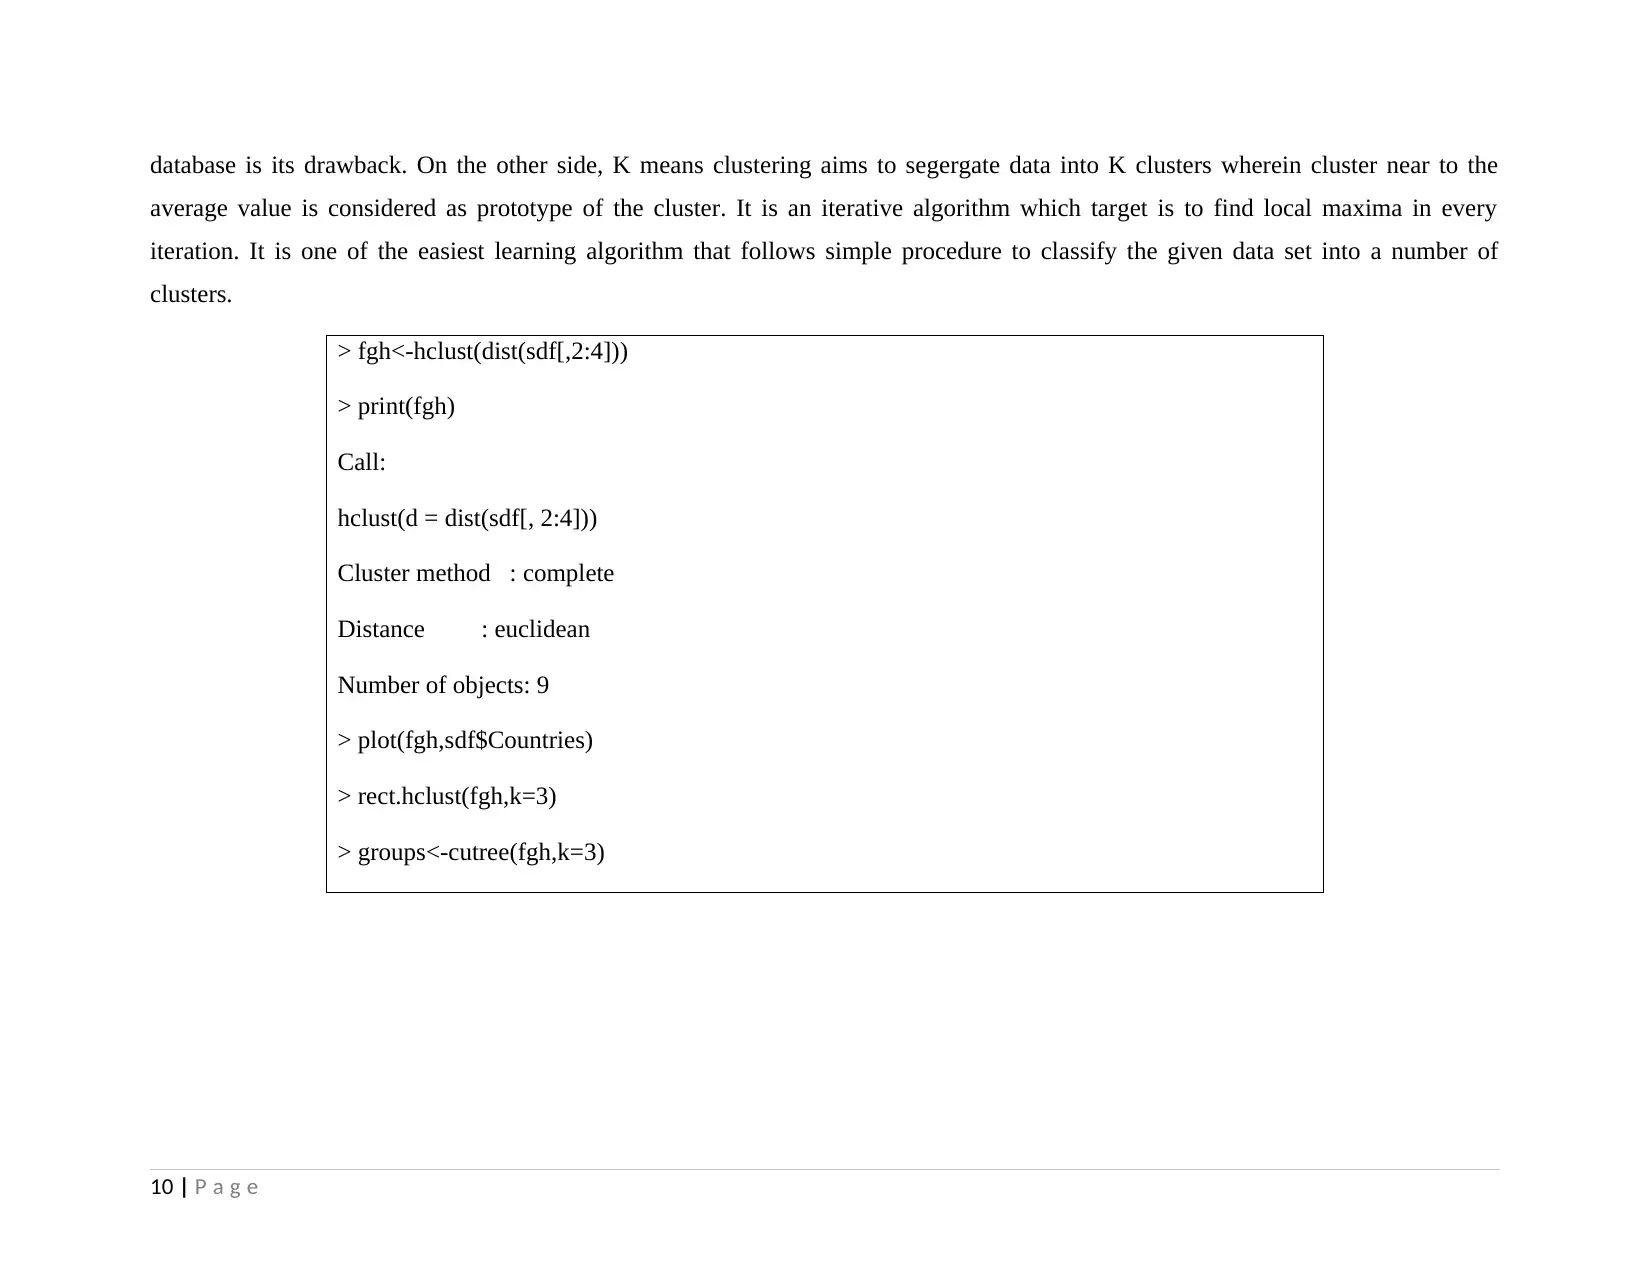
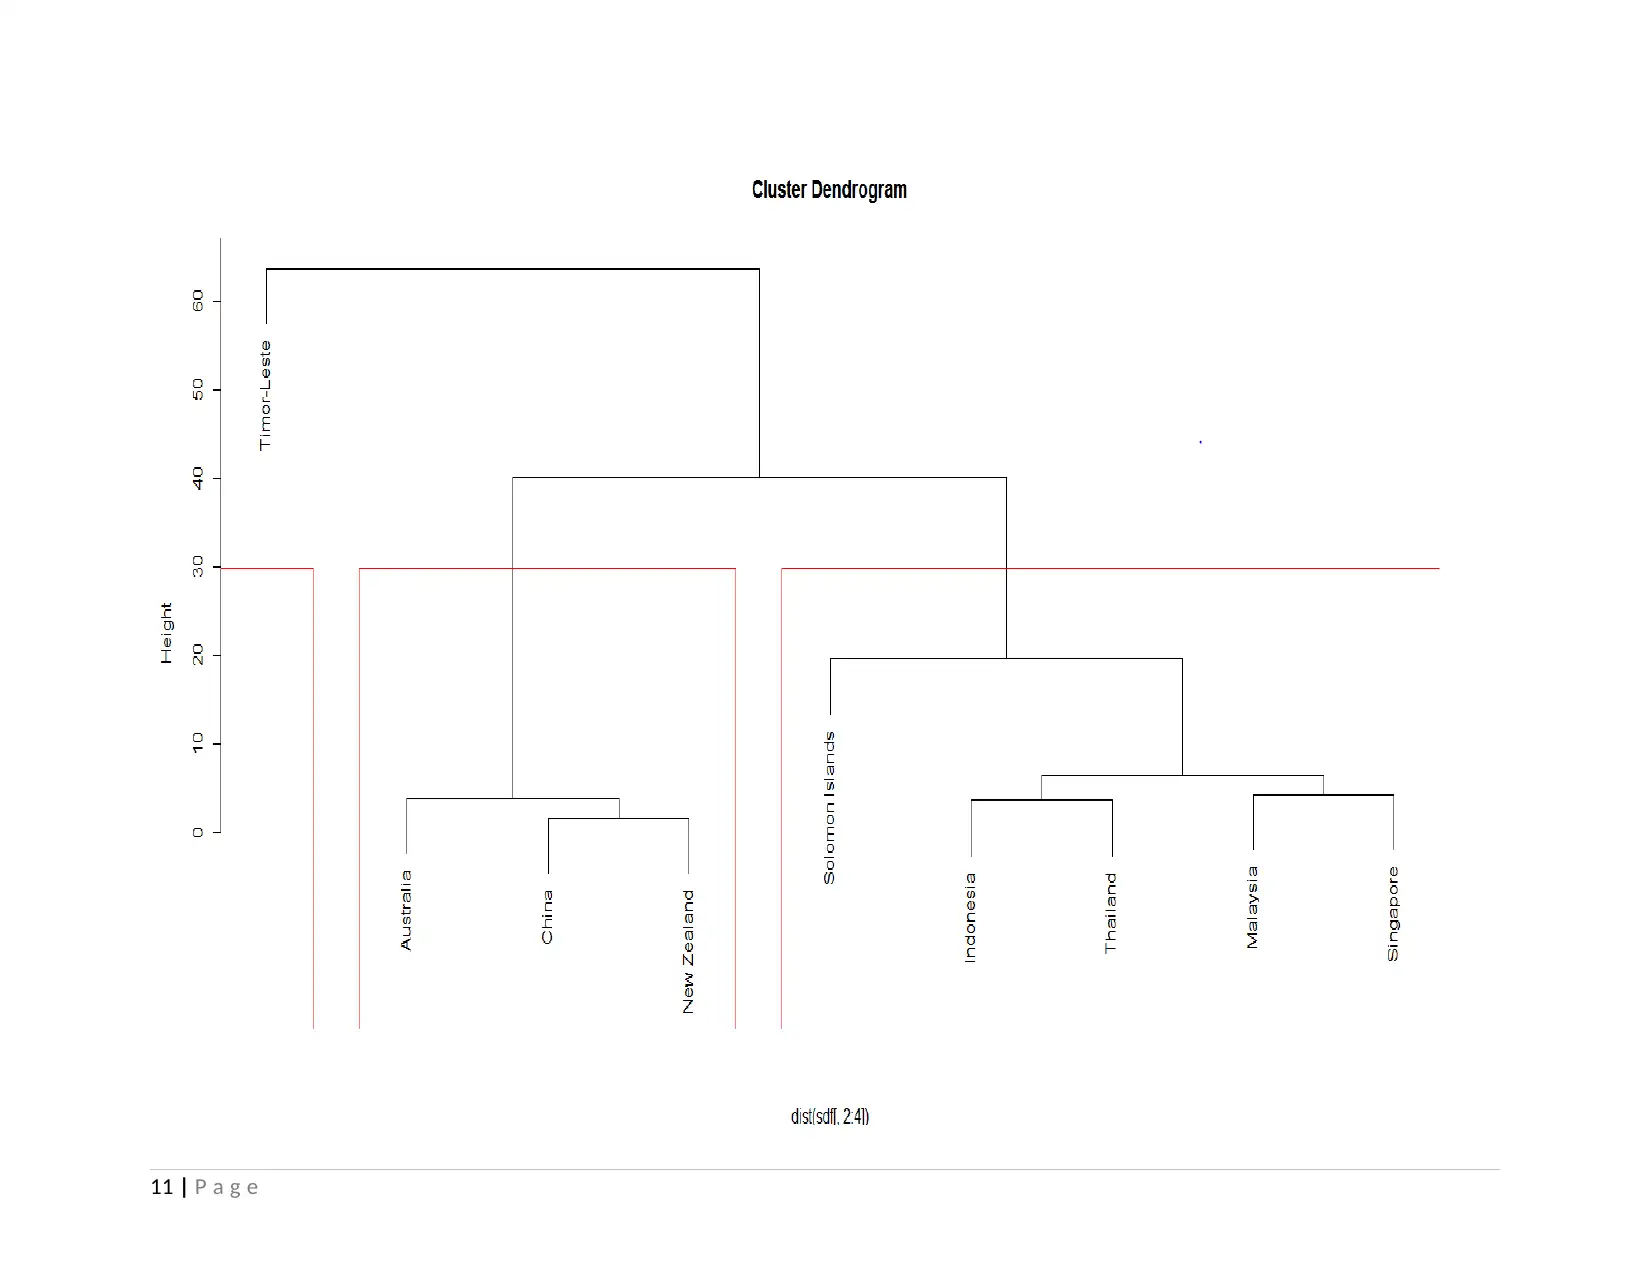
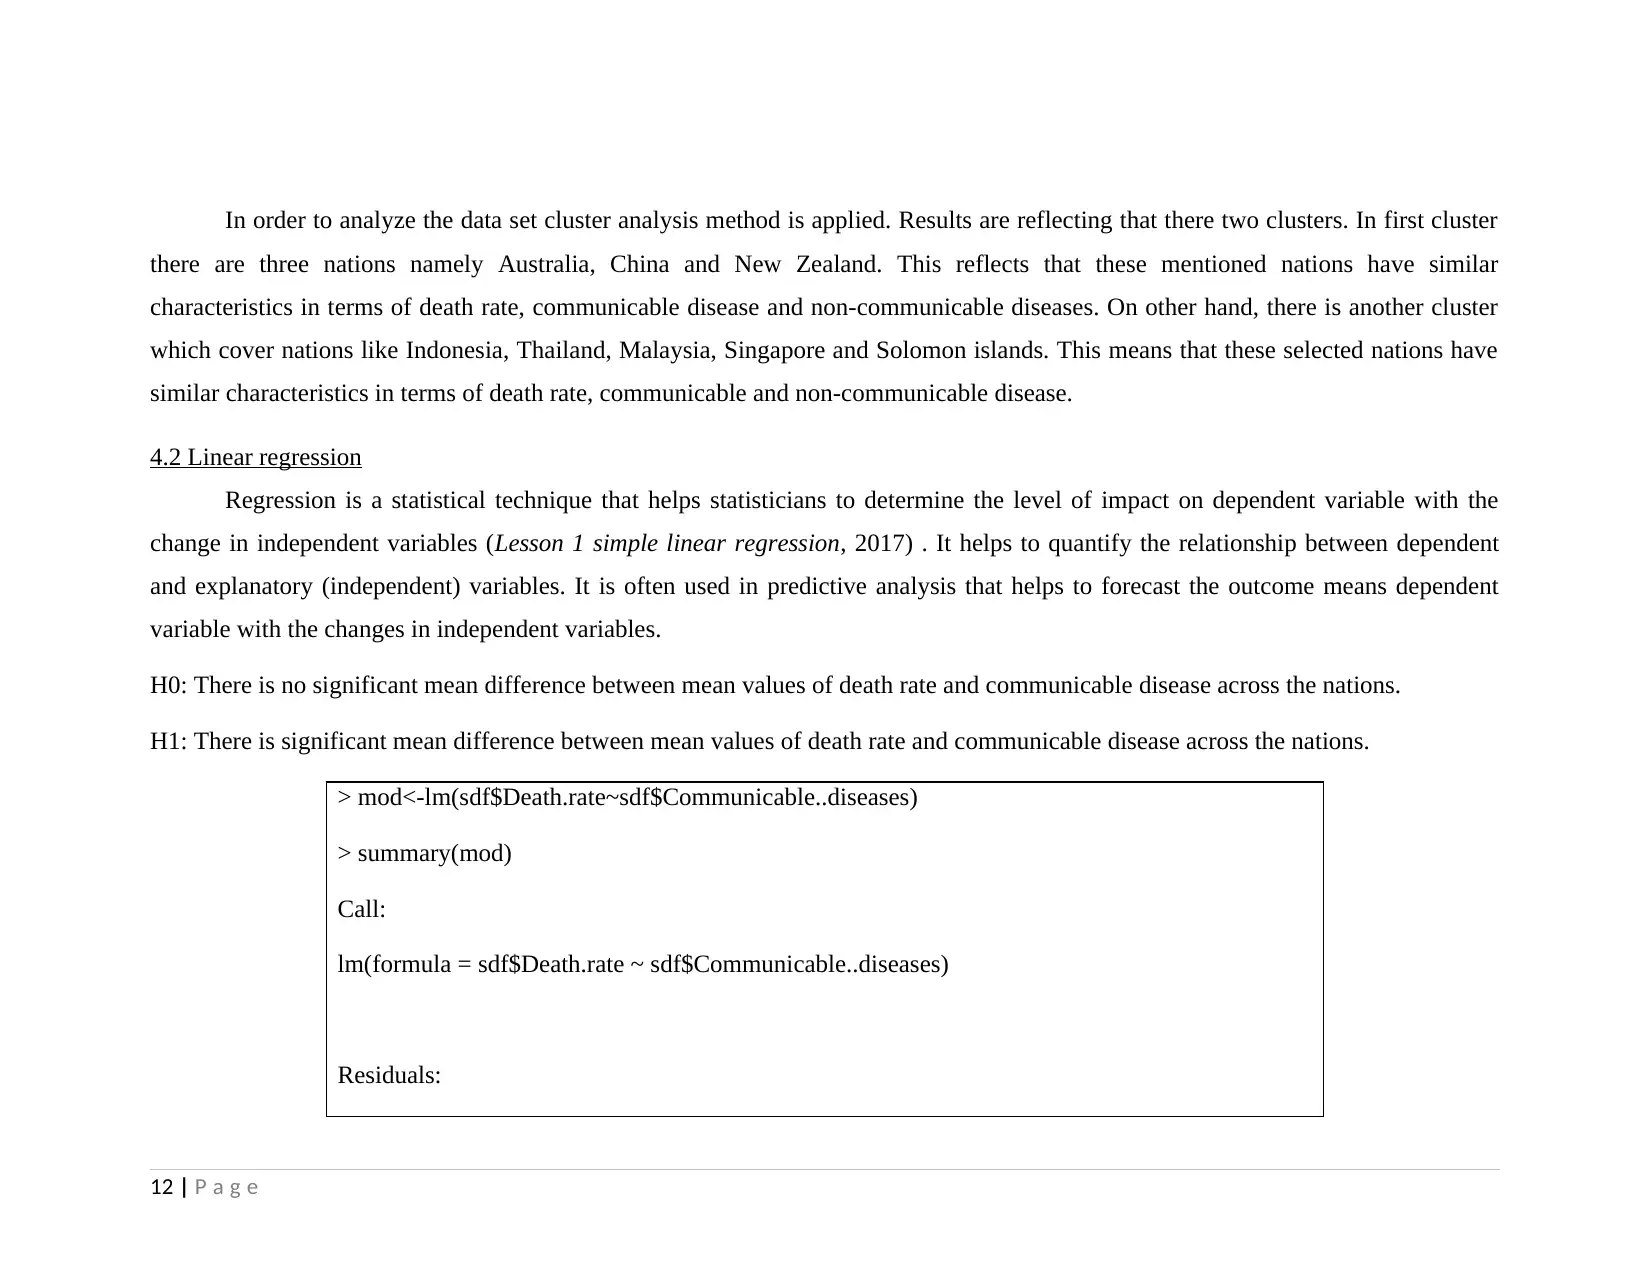
This project analyzes health and population statistics from the World Bank for countries in East Asia and the Pacific from 2001 to 2015. The project examines datasets including birth rates, death rates, immunization, and other health indicators across ten countries: Australia, China, Indonesia, Malaysia, New Zealand, Palau, Singapore, Solomon Islands, Thailand, and Timor-Leste. The analysis begins with exploratory data analysis (EDA), employing summary statistics, and graphical representations to understand the data's characteristics. Bivariate analysis is performed using correlation and covariance to determine relationships between variables like death rates and communicable/non-communicable diseases. Advanced analysis techniques, including clustering and linear regression, are then applied to identify patterns and quantify relationships. Clustering groups countries with similar health profiles, while linear regression assesses the impact of communicable and non-communicable diseases on death rates. The study concludes that death rates are not significantly affected by communicable and non-communicable diseases and suggests that healthcare strategies can be tailored for countries that share similar characteristics. The student faced challenges in data organization and R code execution, which were overcome using Excel and further study.
Document Page
DATA ANALYSIS
tabler-icon-diamond-filled.svg

Paraphrase This Document

Need a fresh take? Get an instant paraphrase of this document with our AI Paraphraser
Document Page
TABLE OF CONTENTS
1. INTRODUCTION................................................................................................................................................................................................... 3
2. DATA SETUP......................................................................................................................................................................................................... 3
3. EXPLORATORY DATA ANALYSIS....................................................................................................................................................................3
4. ADVANCED ANALYSIS...................................................................................................................................................................................... 9
4.1 Clustering........................................................................................................................................................................................................... 9
4.2 Linear regression.............................................................................................................................................................................................. 12
5. CONCLUSION...................................................................................................................................................................................................... 17
6. REFLECTION....................................................................................................................................................................................................... 17
REFERENCES.......................................................................................................................................................................................................... 18
2 | P a g e
Document Page
1. INTRODUCTION
Improving health of the people is the central goal of the Millennium Development and every country’s government makes
policies and legislations for promoting the health benefits to the people. The current project aims at analyzing the data regarding
health development on countries in East Asia & Pacific. The required data set for the Health & Population Statistics has been obtained
from World Bank from the year 2001 to 2015. It will be examine through suitable statistical tests for exploratory data analysis and
advanced analysis i.e. clustering & linear regression as well. The potential audiences researchers, governmental agencies and business
representatives will be able to make better decisions for promoting health care needs of the people so as to improve their quality of the
life.
2. DATA SETUP
In order to derive interesting and significant information, the data about health nutrition and population statistics of different
countries have been acquired through World Bank. It contains essential informatio regarding of the people i.e. birth rate, death rate,
immunization, life expectancy, alchol consumption, mortality rate, fertility rate & others. The present assignment aims at examining
the health status of the people in 10 countries includes Australia, China, Indonesia, Malaysia, New Zeland, Palau, Singapore, Solomon
Island, Thailand and Timor-Leste.
3. EXPLORATORY DATA ANALYSIS
Exploratory data analysis (EDA) is a technique wherein the given statistical information is summarized and analyzed using
visual methods and techniques. EDA is primarily aims at identifying the main characteristics of the data beyond hypothesis testing or
formal modeling and helps statisticians to explore the dataset. There are number of graphical illustrations that can be made for such
analysis i.e. Histogram, box plots, Multi-vari chart, run chart, scatter plot, pareto diagram, multilinear PCA, stem and leaf plot and
3 | P a g e
Document Page
others. It is performed after data collection but before the modeling of the data and helps to determine the nature of the data. Its main
purpose is to use visualization & summary statistical findings for the better understanding of the data. Here, data are highly structured
and available in the numerical form.
Univariate (one-variable) analysis:
Summary statistics provide information to summarize the data set by central tendency measurements such as mean, median and
quartile. Mean indicates average death causes due to communicable, non-communicable and injuries whereas median depicts 50% means half
of the data set. However, on the contrary side, quartile distribute the entire data series into four categories each represent 25% value.
> summary(sdf)
Countries Communicable..diseases Non.communicable.disease Death.rate
Australia :1 Min. : 3.60 Min. :43.80 Min. :4.500
China :1 1st Qu.: 5.30 1st Qu.:70.80 1st Qu.:5.925
Indonesia :1 Median :18.40 Median :73.00 Median :6.820
Malaysia :1 Mean :18.47 Mean :73.51 Mean :6.385
New Zealand:1 3rd Qu.:22.00 3rd Qu.:87.10 3rd Qu.:7.150
Singapore :1 Max. :47.00 Max. :90.50 Max. :7.647
(Other) :3
4 | P a g e
tabler-icon-diamond-filled.svg

Paraphrase This Document

Need a fresh take? Get an instant paraphrase of this document with our AI Paraphraser
Document Page
5 | P a g e
Document Page
6 | P a g e
Document Page
According to the identified results, the average cause of death by communicable diseases and non-communicable diseases in
East Asia and Pacific region is founded to 18.47 and 73.51. However, on an average death rate per year is identified to 6.385 per 1000
people. However, for the communicable disease, 50% of the value (median) is determined to 18.40, however, for non-communicable,
it has been determined to 73. As per the findings, 25% and 75% of the communicable disease data series such as maternal, prenatal,
nutrition conditions i.e. infection, parasite, respiratory infection is derived to 5.30 and 22.00 whereas for Non-communicable, it shows
value of 70.80 and 87.10 respectively. 25% of the death rate per 1000 people is 5.925 while at 75%, it is identified to 7.150. The
results present that the highest communicable disease as a percentage of total death rate has been determined to 47% whereas non-
communicable disease reported largest share of 90.50% such as cancer, cardiovascular disease, skin disease, digestive disease and
7 | P a g e
tabler-icon-diamond-filled.svg

Paraphrase This Document

Need a fresh take? Get an instant paraphrase of this document with our AI Paraphraser
Document Page
others. Among all the 10 countries, the highest death rate over the last 15 years has been identified to 7.647 reported a death of 8
people over per 1000 population
Two variable (Bivariate) analysis:
> cor(sdf$Death.rate,sdf$Communicable..diseases)
[1] -0.05100118
> cor(sdf$Death.rate,sdf$Non.communicable.disease)
[1] 0.02559977
> cov(sdf$Death.rate,sdf$Communicable..diseases)
[1] -0.7698292
> cov(sdf$Death.rate,sdf$Non.communicable.disease)
[1] 0.4164472
Correlation indicates relationship between two variables ranges between 0 to 1 (Hair and et.al., 2010). Positive values indicates
that change in one variable will bring positive change into other variable or vice-versa. According to the findings, correlation between
communicable diseases and death rate is founded to be negative to -0.05 which indicates that communicable diseases bring adverse
change in death rate. However, non-communicable diseases reflects positive correlation of 0.0255 which indicates weak relationship
because it is below 0.25. It may be due to the effect of other factors or death causes due to injuries. Covariance reflects variability of
two variable and results presents co-variance between death rate and communicable & non-communicable diseases at -0.769 and
0.416 that indicates negative change in death rate with high causes of communicable diseases whereas with the rising non-
communicable diseases, death rate rises.
8 | P a g e
Document Page
4. ADVANCED ANALYSIS
4.1 Clustering
Clustering refers to the process of grouping a set of object in sub-sets called cluster, in every cluster, the objects are quite
similar to each other. Thus, it is the process to group variables together on certain specific parameters. Its main target is to segregate
data into groups with similar traits and allocate them into clusters. There are various types of clustering algorithms such as
connectivity models, centroid models, distribution model and density models (Harrell, 2015). In the first, data points that are near in
the data series shows more similarity other than the such data points which are far away from each other. It can follow two
approaches, in the first, it classifies all data point into different clusters and then aggregate such with decrease in distance. However, in
the second approach, all the data points available are classified as one cluster only and then segregated with the increase in distance. In
both these, the distance selection is a subjective choice. Connectivity models can be interpreted easily but still lacks scalability of huge
9 | P a g e
Document Page
database is its drawback. On the other side, K means clustering aims to segergate data into K clusters wherein cluster near to the
average value is considered as prototype of the cluster. It is an iterative algorithm which target is to find local maxima in every
iteration. It is one of the easiest learning algorithm that follows simple procedure to classify the given data set into a number of
clusters.
> fgh<-hclust(dist(sdf[,2:4]))
> print(fgh)
Call:
hclust(d = dist(sdf[, 2:4]))
Cluster method : complete
Distance : euclidean
Number of objects: 9
> plot(fgh,sdf$Countries)
> rect.hclust(fgh,k=3)
> groups<-cutree(fgh,k=3)
10 | P a g e
tabler-icon-diamond-filled.svg

Paraphrase This Document

Need a fresh take? Get an instant paraphrase of this document with our AI Paraphraser
Document Page
11 | P a g e
Document Page
In order to analyze the data set cluster analysis method is applied. Results are reflecting that there two clusters. In first cluster
there are three nations namely Australia, China and New Zealand. This reflects that these mentioned nations have similar
characteristics in terms of death rate, communicable disease and non-communicable diseases. On other hand, there is another cluster
which cover nations like Indonesia, Thailand, Malaysia, Singapore and Solomon islands. This means that these selected nations have
similar characteristics in terms of death rate, communicable and non-communicable disease.
4.2 Linear regression
Regression is a statistical technique that helps statisticians to determine the level of impact on dependent variable with the
change in independent variables (Lesson 1 simple linear regression, 2017) . It helps to quantify the relationship between dependent
and explanatory (independent) variables. It is often used in predictive analysis that helps to forecast the outcome means dependent
variable with the changes in independent variables.
H0: There is no significant mean difference between mean values of death rate and communicable disease across the nations.
H1: There is significant mean difference between mean values of death rate and communicable disease across the nations.
> mod<-lm(sdf$Death.rate~sdf$Communicable..diseases)
> summary(mod)
Call:
lm(formula = sdf$Death.rate ~ sdf$Communicable..diseases)
Residuals:
12 | P a g e
chevron_up_icon
1 out of 19
circle_padding
hide_on_mobile
zoom_out_icon
[object Object]