Data Analysis of Health: Lifestyle Factors Impact on Health Conditions

Verified

Added on  2023/06/14

|8
|1043
|455
Report
AI Summary
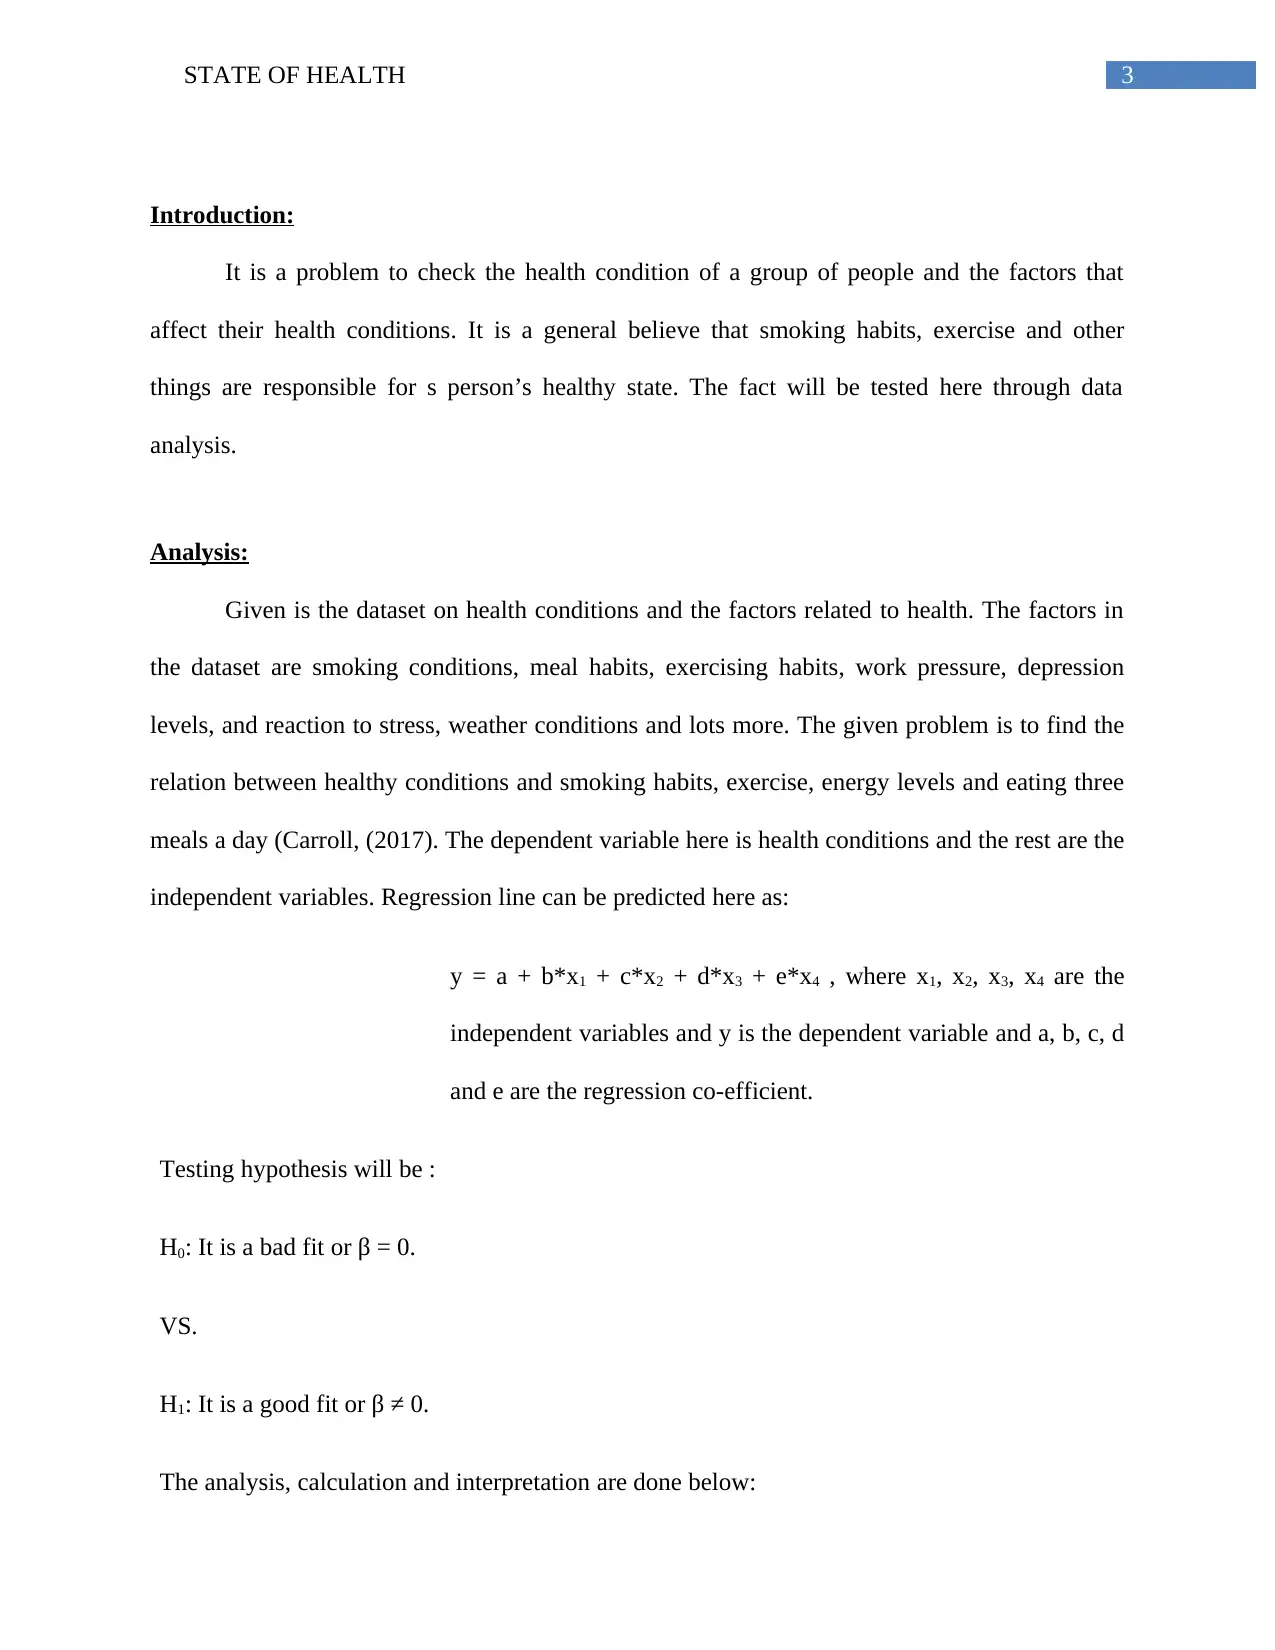
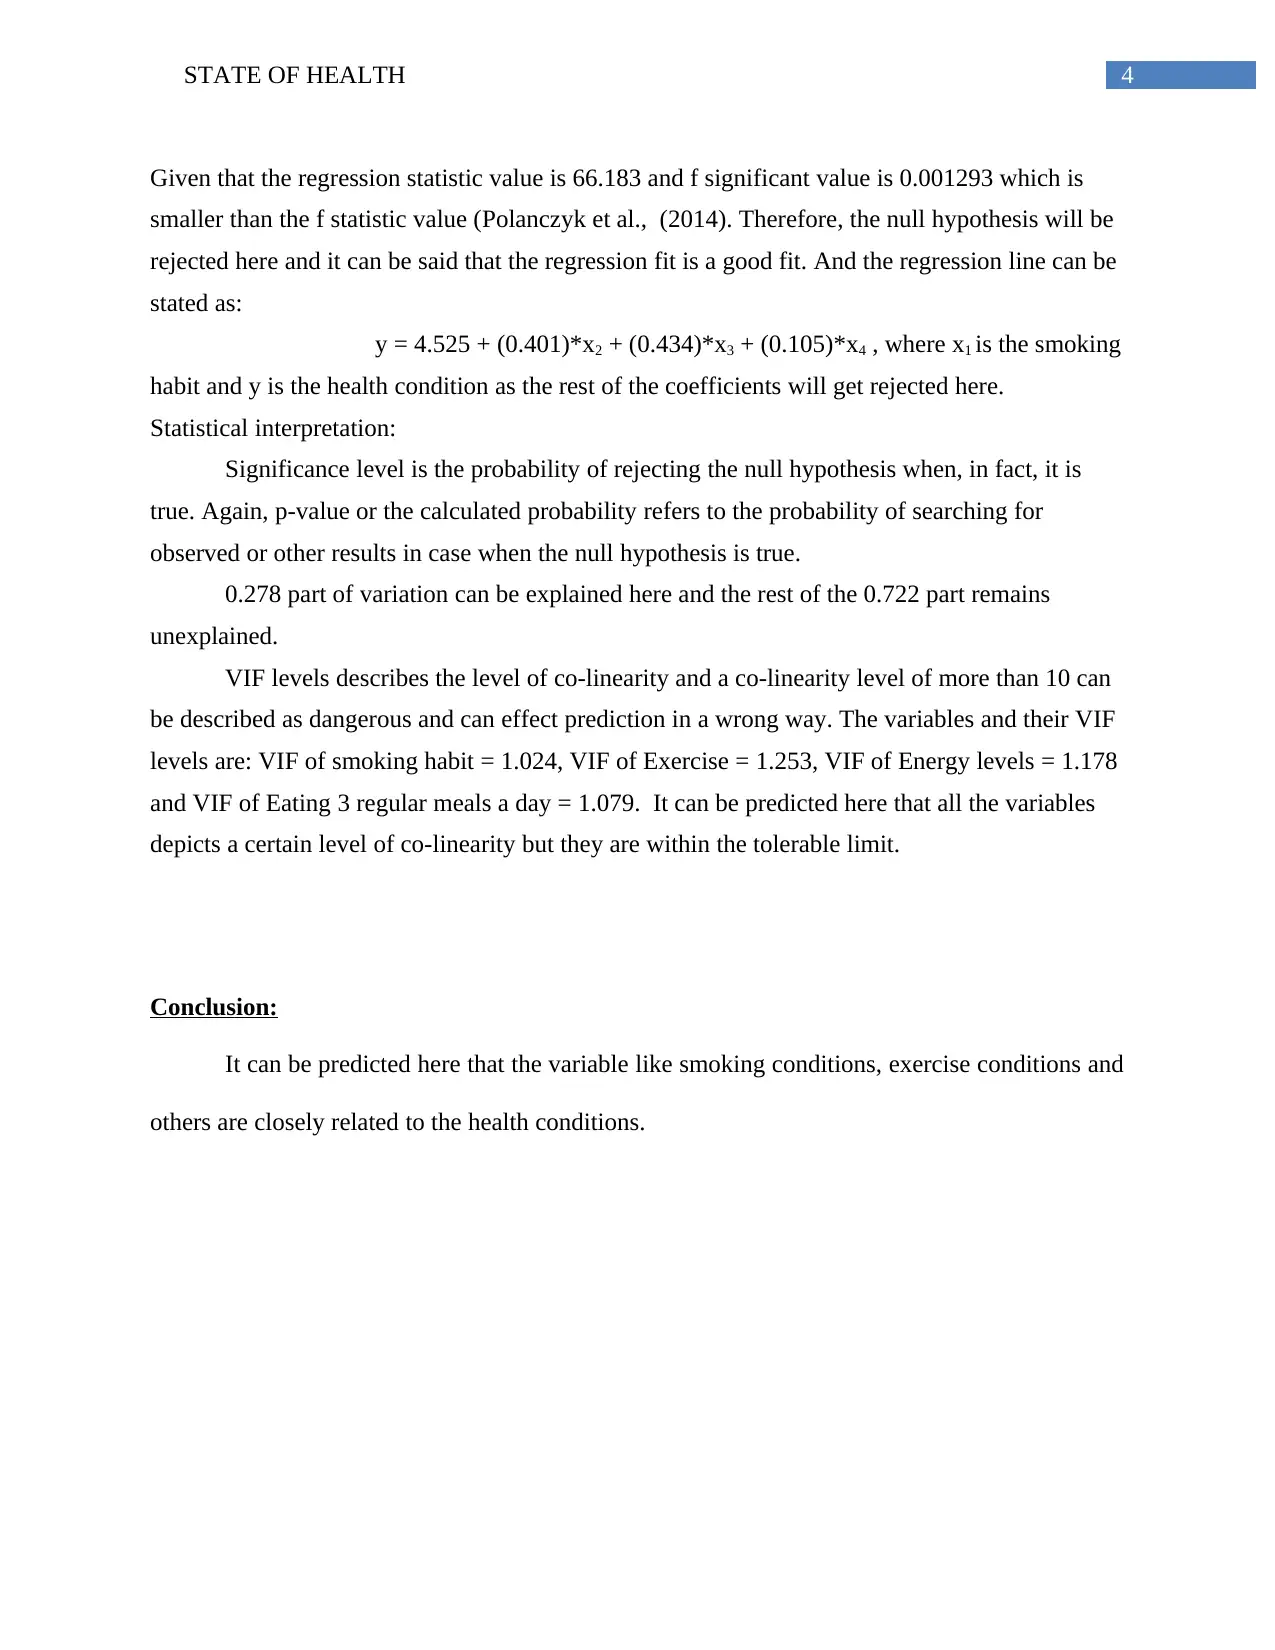
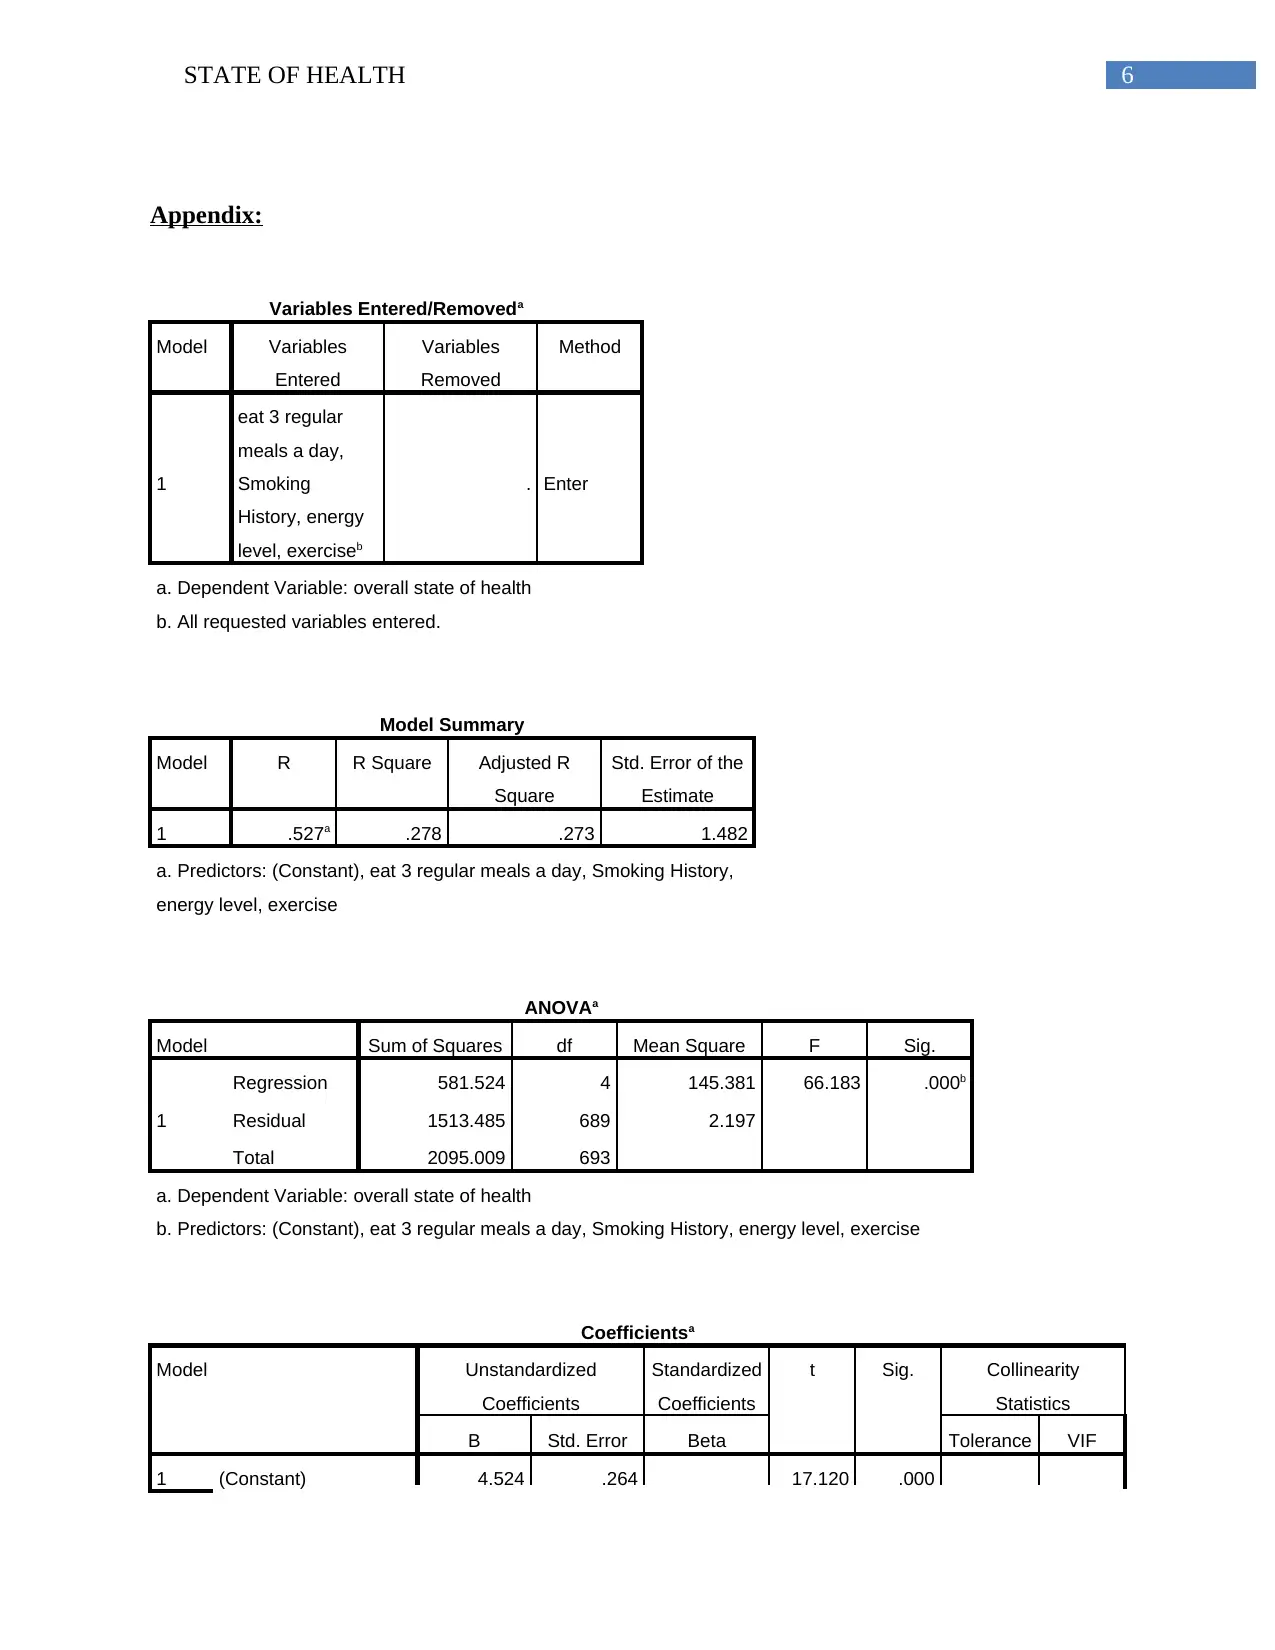
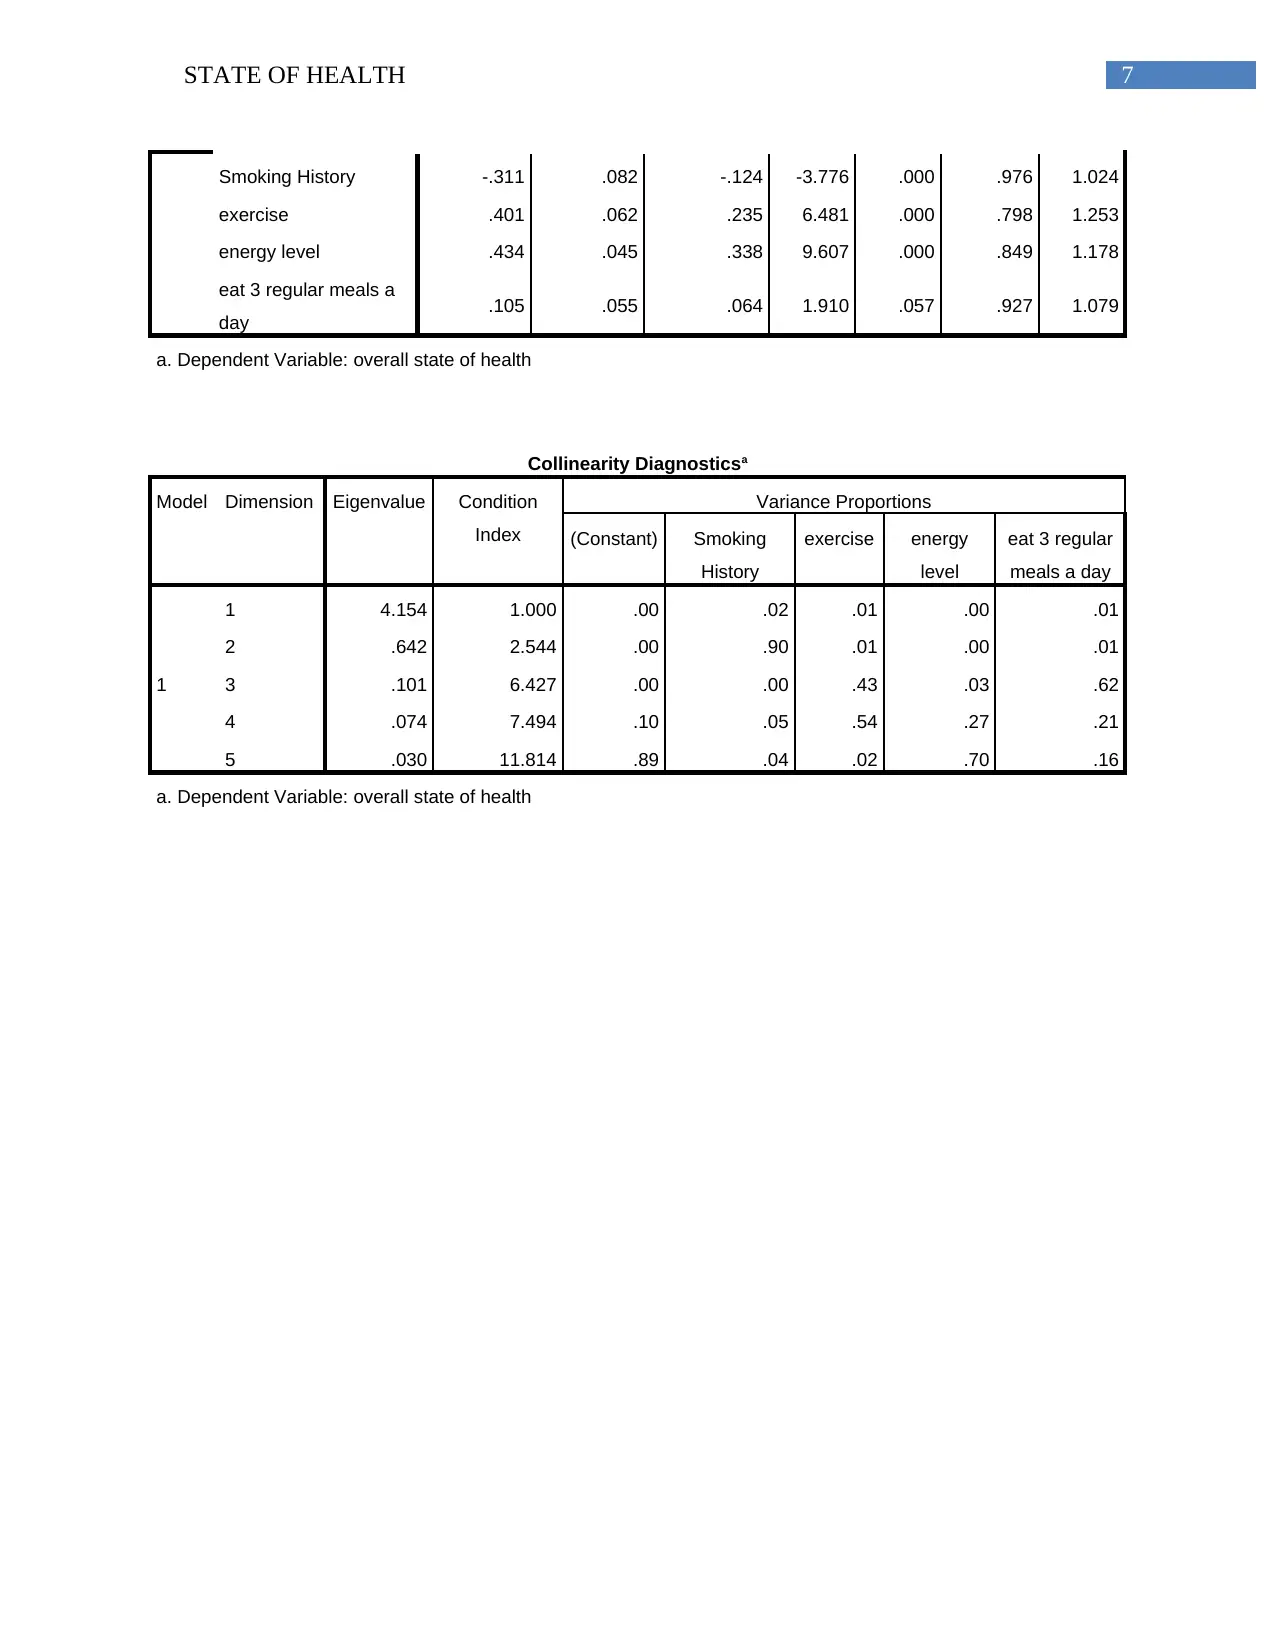
This report explores the correlation between health conditions and various lifestyle factors such as smoking habits, exercise frequency, energy levels, and dietary habits. The analysis employs regression techniques to determine the impact of these independent variables on overall health. The findings indicate that smoking habits, exercise, and energy levels are significantly related to health conditions. The regression model developed suggests that these factors can be used to predict health outcomes. The report also discusses the statistical significance and collinearity of the variables, providing a comprehensive overview of the data analysis process. The analysis rejects the null hypothesis and concludes that the regression model is a good fit, highlighting the importance of lifestyle choices in determining health status. Desklib provides access to similar reports and solved assignments for students.
Document Page
Running head: STATE OF HEALTH
STATE OF HEALTH
Name of the student:
Name of the university:
Author’s note:
tabler-icon-diamond-filled.svg

Paraphrase This Document

Need a fresh take? Get an instant paraphrase of this document with our AI Paraphraser
Document Page
1STATE OF HEALTH
Executive summary:
It is a problem to check the health condition of a group of people and the factors that affect their
health conditions. The fact will be tested here through data analysis. It can be predicted here that
the variable like smoking conditions, exercise conditions and others are closely related to the
health conditions.
Document Page
2STATE OF HEALTH
Table of Contents
Introduction:....................................................................................................................................2
Analysis:..........................................................................................................................................2
Conclusion:......................................................................................................................................3
References:......................................................................................................................................4
Appendix:........................................................................................................................................5
Document Page
3STATE OF HEALTH
Introduction:
It is a problem to check the health condition of a group of people and the factors that
affect their health conditions. It is a general believe that smoking habits, exercise and other
things are responsible for s person’s healthy state. The fact will be tested here through data
analysis.
Analysis:
Given is the dataset on health conditions and the factors related to health. The factors in
the dataset are smoking conditions, meal habits, exercising habits, work pressure, depression
levels, and reaction to stress, weather conditions and lots more. The given problem is to find the
relation between healthy conditions and smoking habits, exercise, energy levels and eating three
meals a day (Carroll, (2017). The dependent variable here is health conditions and the rest are the
independent variables. Regression line can be predicted here as:
y = a + b*x1 + c*x2 + d*x3 + e*x4 , where x1, x2, x3, x4 are the
independent variables and y is the dependent variable and a, b, c, d
and e are the regression co-efficient.
Testing hypothesis will be :
H0: It is a bad fit or β = 0.
VS.
H1: It is a good fit or β ≠ 0.
The analysis, calculation and interpretation are done below:
tabler-icon-diamond-filled.svg

Paraphrase This Document

Need a fresh take? Get an instant paraphrase of this document with our AI Paraphraser
Document Page
4STATE OF HEALTH
Given that the regression statistic value is 66.183 and f significant value is 0.001293 which is
smaller than the f statistic value (Polanczyk et al., (2014). Therefore, the null hypothesis will be
rejected here and it can be said that the regression fit is a good fit. And the regression line can be
stated as:
y = 4.525 + (0.401)*x2 + (0.434)*x3 + (0.105)*x4 , where x1 is the smoking
habit and y is the health condition as the rest of the coefficients will get rejected here.
Statistical interpretation:
Significance level is the probability of rejecting the null hypothesis when, in fact, it is
true. Again, p-value or the calculated probability refers to the probability of searching for
observed or other results in case when the null hypothesis is true.
0.278 part of variation can be explained here and the rest of the 0.722 part remains
unexplained.
VIF levels describes the level of co-linearity and a co-linearity level of more than 10 can
be described as dangerous and can effect prediction in a wrong way. The variables and their VIF
levels are: VIF of smoking habit = 1.024, VIF of Exercise = 1.253, VIF of Energy levels = 1.178
and VIF of Eating 3 regular meals a day = 1.079. It can be predicted here that all the variables
depicts a certain level of co-linearity but they are within the tolerable limit.
Conclusion:
It can be predicted here that the variable like smoking conditions, exercise conditions and
others are closely related to the health conditions.
Document Page
5STATE OF HEALTH
References:
Carroll, R. J. (2017). Transformation and weighting in regression. Routledge.
Polanczyk, G. V., Willcutt, E. G., Salum, G. A., Kieling, C., & Rohde, L. A. (2014). ADHD
prevalence estimates across three decades: an updated systematic review and meta-
regression analysis. International journal of epidemiology, 43(2), 434-442.
Document Page
6STATE OF HEALTH
Appendix:
Variables Entered/Removeda
Model Variables
Entered
Variables
Removed
Method
1
eat 3 regular
meals a day,
Smoking
History, energy
level, exerciseb
. Enter
a. Dependent Variable: overall state of health
b. All requested variables entered.
Model Summary
Model R R Square Adjusted R
Square
Std. Error of the
Estimate
1 .527a .278 .273 1.482
a. Predictors: (Constant), eat 3 regular meals a day, Smoking History,
energy level, exercise
ANOVAa
Model Sum of Squares df Mean Square F Sig.
1
Regression 581.524 4 145.381 66.183 .000b
Residual 1513.485 689 2.197
Total 2095.009 693
a. Dependent Variable: overall state of health
b. Predictors: (Constant), eat 3 regular meals a day, Smoking History, energy level, exercise
Coefficientsa
Model Unstandardized
Coefficients
Standardized
Coefficients
t Sig. Collinearity
Statistics
B Std. Error Beta Tolerance VIF
1 (Constant) 4.524 .264 17.120 .000
tabler-icon-diamond-filled.svg

Paraphrase This Document

Need a fresh take? Get an instant paraphrase of this document with our AI Paraphraser
Document Page
7STATE OF HEALTH
Smoking History -.311 .082 -.124 -3.776 .000 .976 1.024
exercise .401 .062 .235 6.481 .000 .798 1.253
energy level .434 .045 .338 9.607 .000 .849 1.178
eat 3 regular meals a
day .105 .055 .064 1.910 .057 .927 1.079
a. Dependent Variable: overall state of health
Collinearity Diagnosticsa
Model Dimension Eigenvalue Condition
Index
Variance Proportions
(Constant) Smoking
History
exercise energy
level
eat 3 regular
meals a day
1
1 4.154 1.000 .00 .02 .01 .00 .01
2 .642 2.544 .00 .90 .01 .00 .01
3 .101 6.427 .00 .00 .43 .03 .62
4 .074 7.494 .10 .05 .54 .27 .21
5 .030 11.814 .89 .04 .02 .70 .16
a. Dependent Variable: overall state of health
chevron_up_icon
1 out of 8
circle_padding
hide_on_mobile
zoom_out_icon
[object Object]