University Health Economics Assignment: 26703, Semester 2, 2020
VerifiedAdded on 2022/09/25
|11
|1306
|19
Homework Assignment
AI Summary
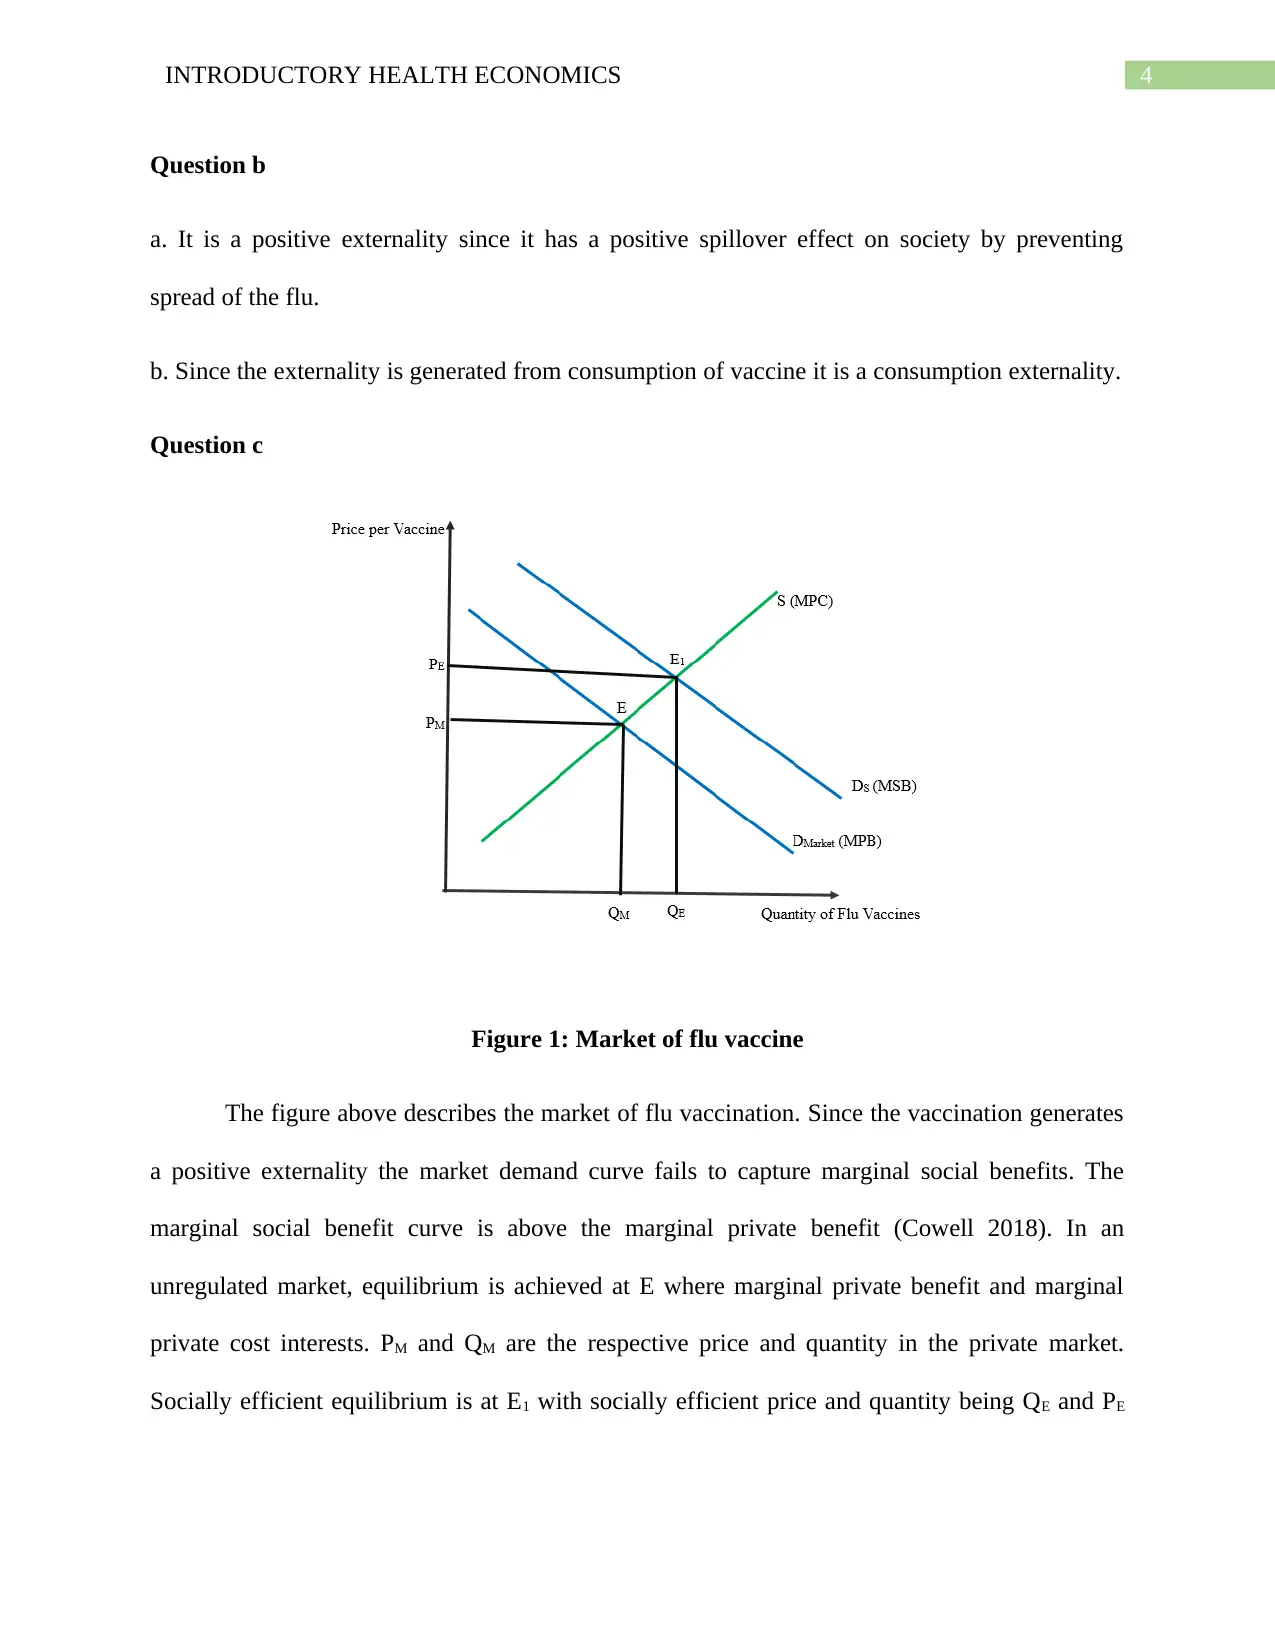
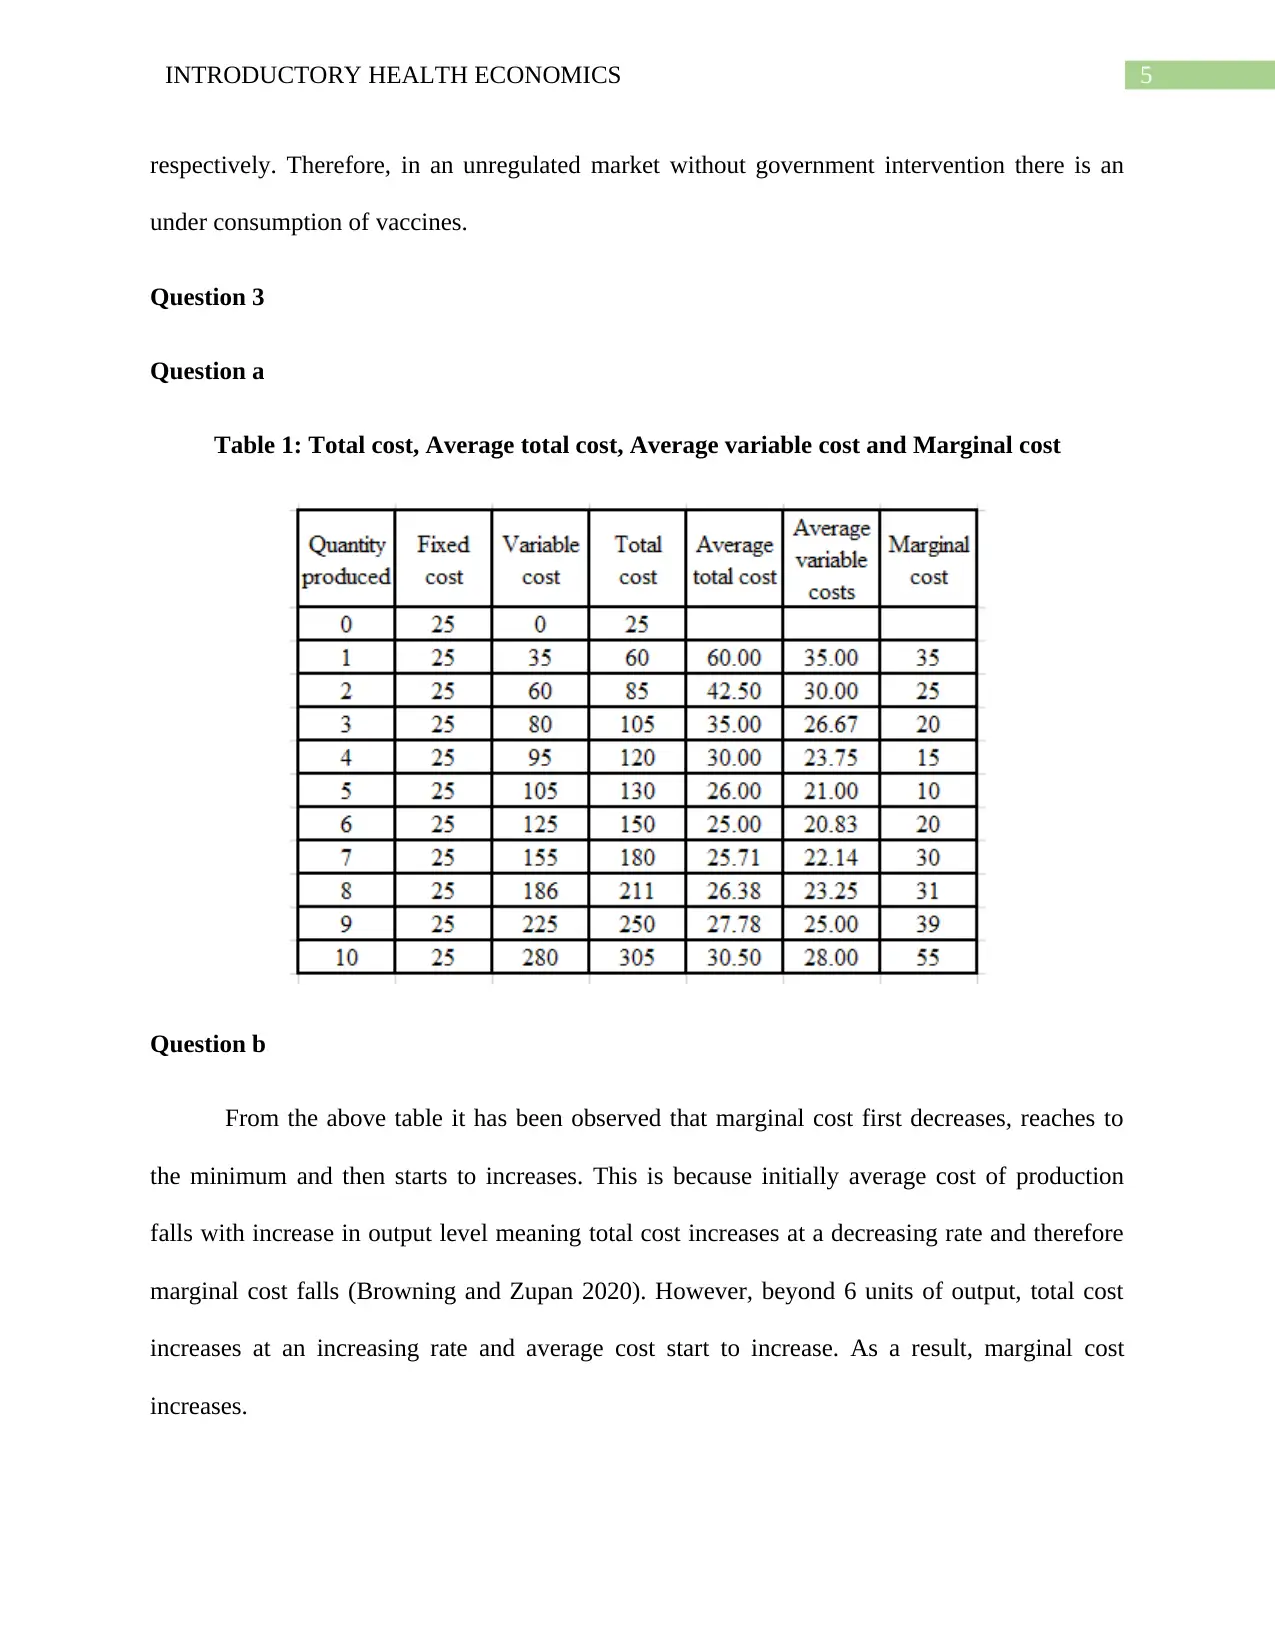
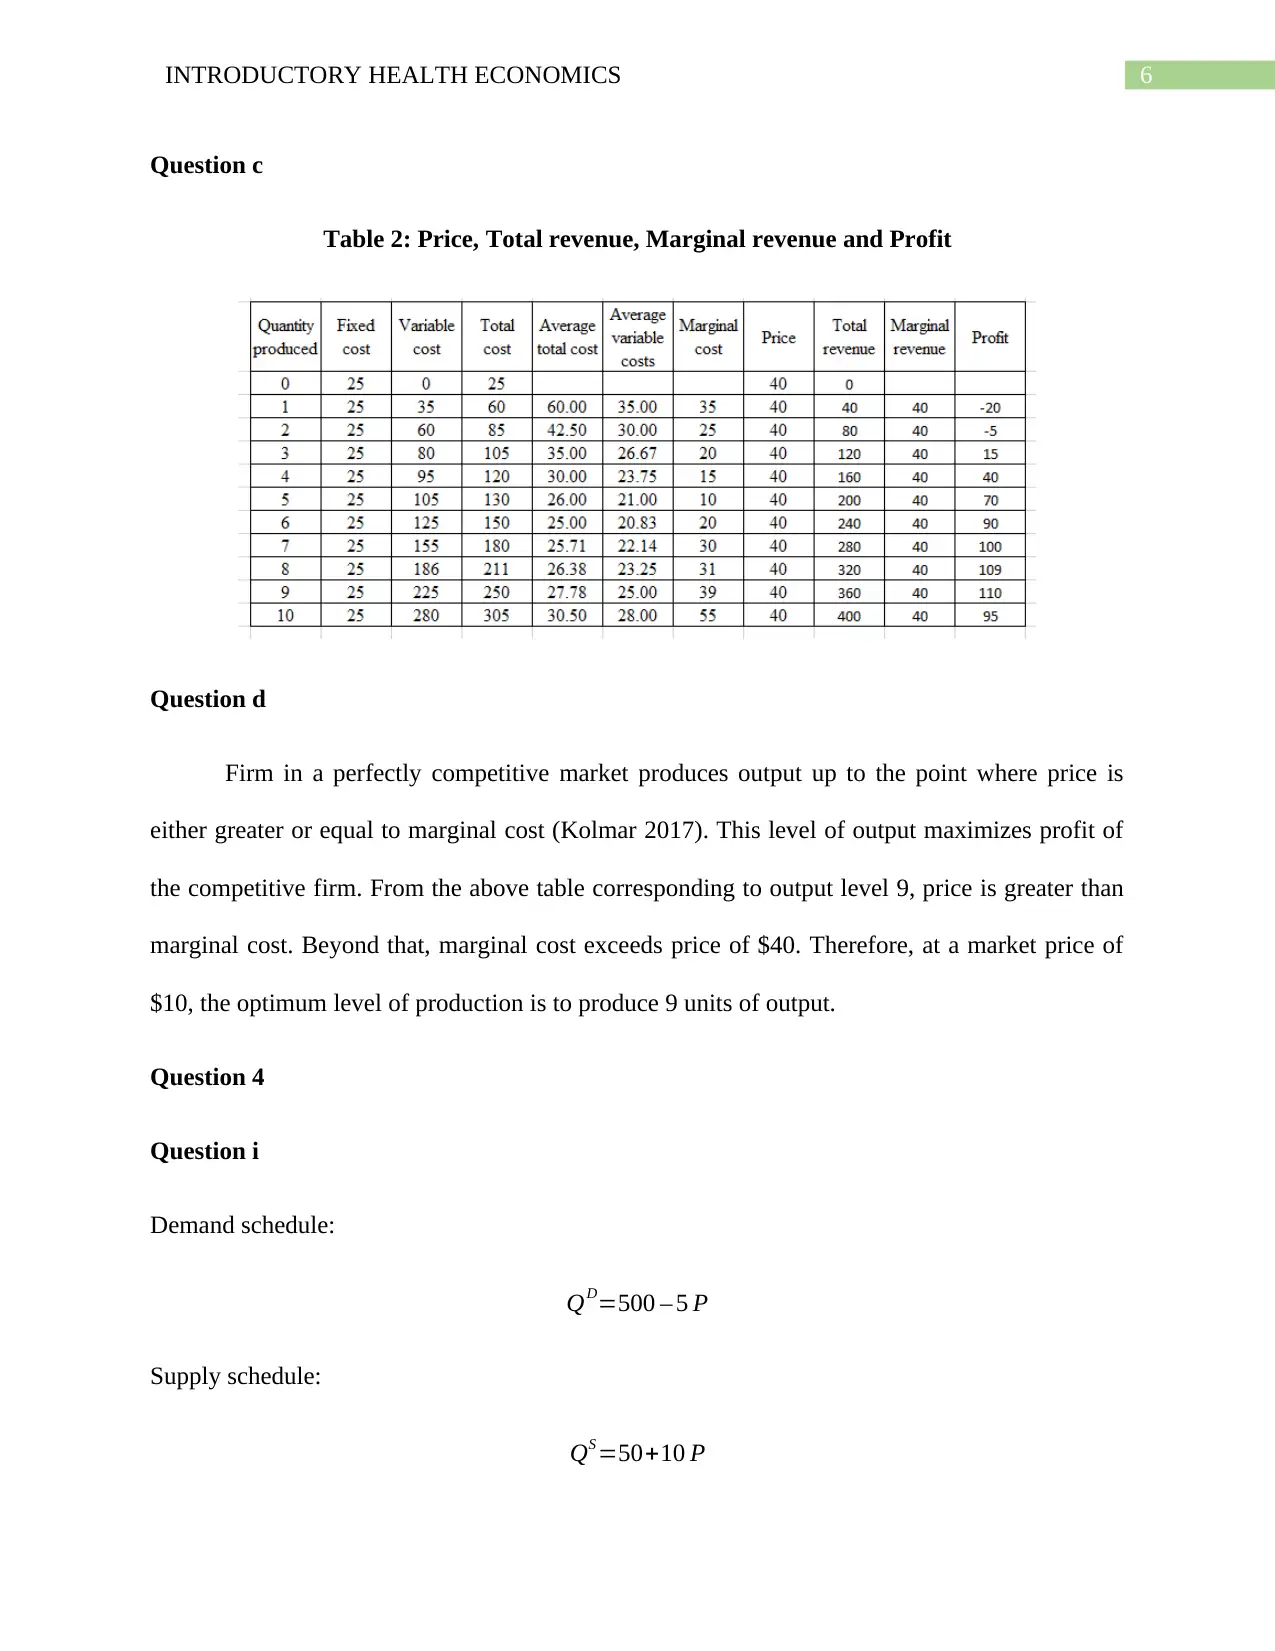
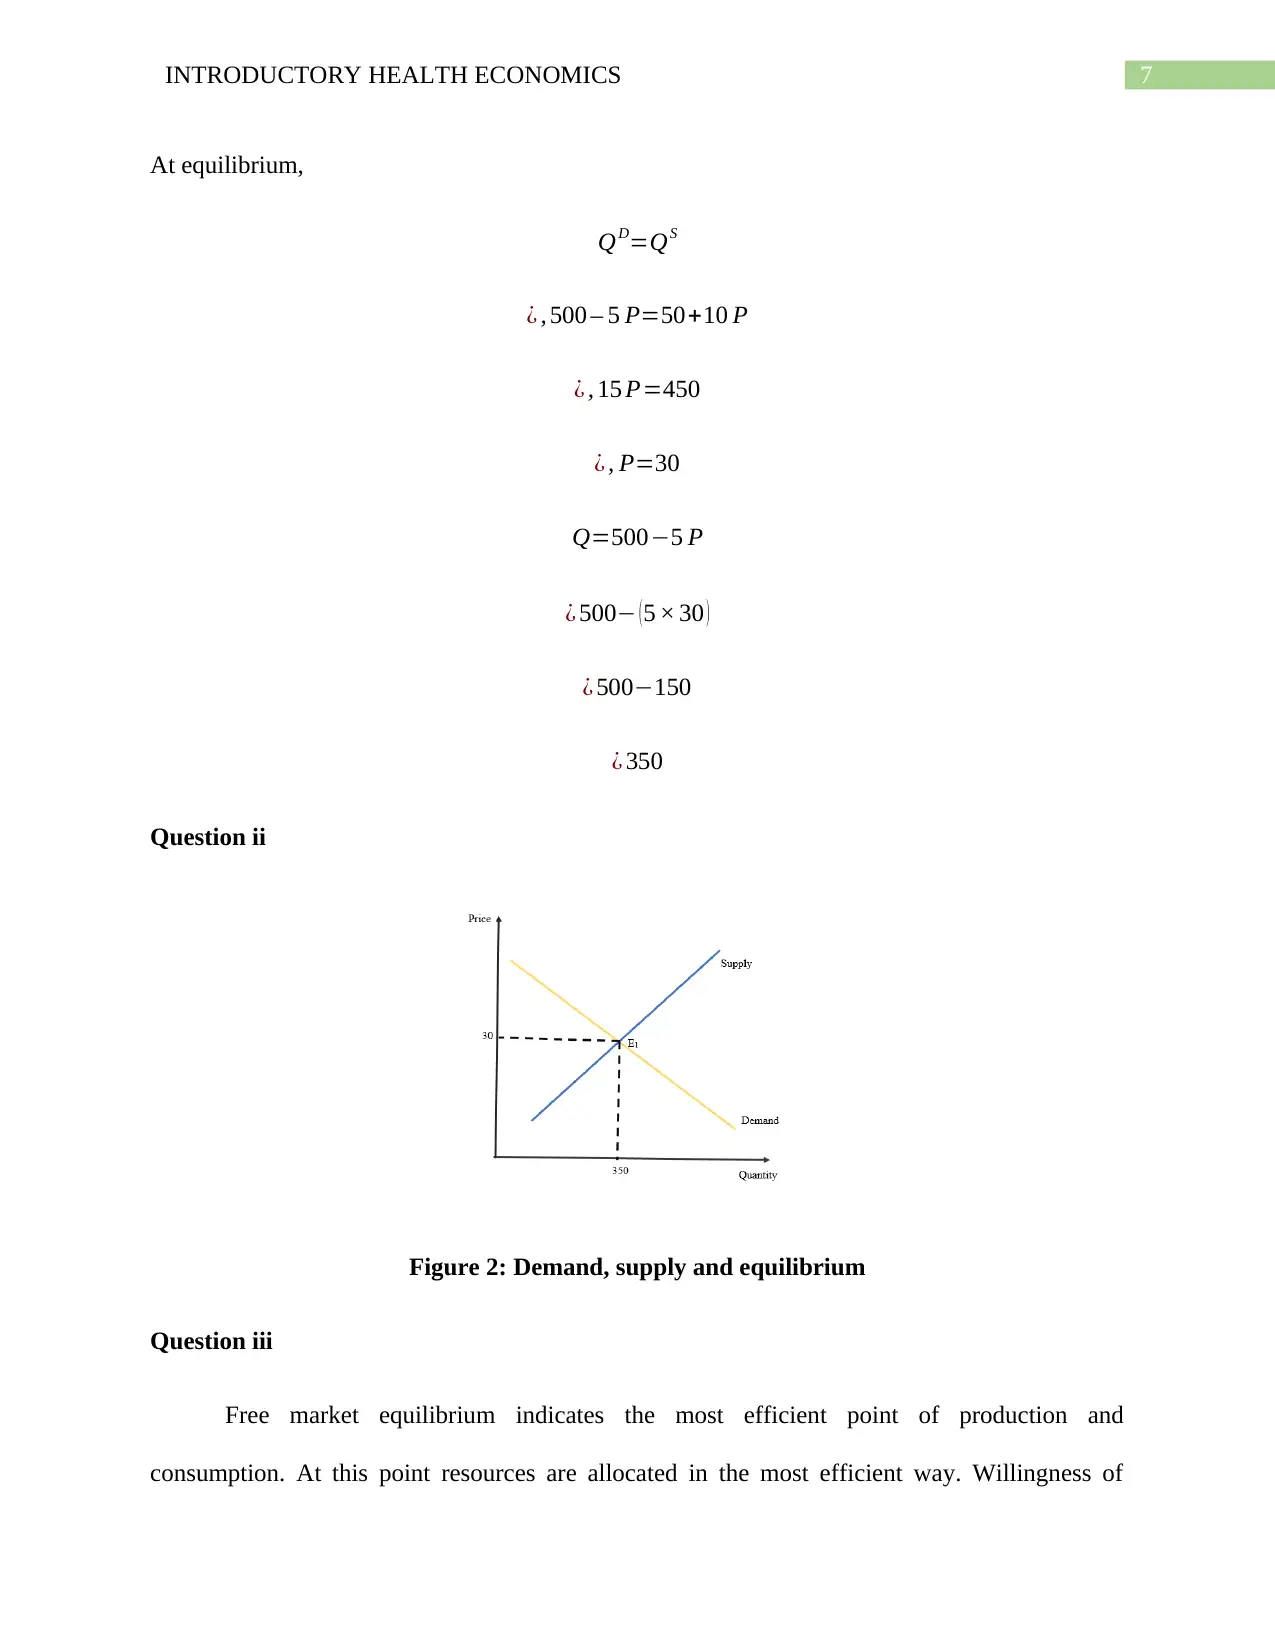
This document presents a comprehensive solution to a health economics assignment, addressing five key questions. The first question analyzes price elasticity of demand for a pharmaceutical product across different income groups, calculating revenue changes with price increases. Question 2 examines positive externalities in flu vaccination, illustrating market inefficiencies and the need for intervention. Question 3 delves into cost structures, including total cost, average cost, marginal cost, and profit maximization in a perfectly competitive market. Question 4 explores demand, supply, and equilibrium, including graphical representations and the efficiency of free markets. Finally, Question 5 discusses supplier-induced demand, its causes, graphical representation, and the resulting welfare losses. The assignment utilizes tables, figures, and references to provide a detailed and well-supported analysis of the concepts.
Contribute Materials
Your contribution can guide someone’s learning journey. Share your
documents today.

Running head: INTRODUCTORY HEALTH ECONOMICS
Introductory Health Economics
Name of the Student
Name of the University
Course ID
Introductory Health Economics
Name of the Student
Name of the University
Course ID
Secure Best Marks with AI Grader
Need help grading? Try our AI Grader for instant feedback on your assignments.

1INTRODUCTORY HEALTH ECONOMICS
Table of Contents
Question 1........................................................................................................................................2
Question a....................................................................................................................................2
Question b....................................................................................................................................2
Question 2........................................................................................................................................3
Question a....................................................................................................................................3
Question b....................................................................................................................................4
Question c....................................................................................................................................4
Question 3........................................................................................................................................5
Question a....................................................................................................................................5
Question b....................................................................................................................................5
Question c....................................................................................................................................6
Question d....................................................................................................................................6
Question 4........................................................................................................................................6
Question i.....................................................................................................................................6
Question ii....................................................................................................................................7
Question iii...................................................................................................................................7
Question 5........................................................................................................................................8
Question a....................................................................................................................................8
Question b....................................................................................................................................8
Question c....................................................................................................................................9
References......................................................................................................................................10

2INTRODUCTORY HEALTH ECONOMICS
Question 1
Question a
Price elasticity of demand for the pharmaceutical product among low income group is -
0.3. Given the elasticity of the low income group, if price of the product increases by 10% then
consumption will be decreased by (0.3*10) = 3% (Kreps 2019). For patients belong to other
income group, given price elasticity of demand is -0.05. Therefore, for this group as price
increases by 10% consumption will be decreased by (0.05*10) = 0.5%.
Question b
If the original price was $10 for low income patients and associated consumption was
100, 000 scripts then revenue from the low income patients was
Revenue=Price× Quantity
¿ $ 10× 100 , 000
¿ $ 1 ,000 , 000
Given that original price for high income patients was $30 and associated consumption
was 200, 000 scripts then revenue earned from high income patient was
Revenue=Price× Quantity
¿ $ 30× 200 , 000
¿ $ 6 , 000 , 000
Therefore, total revenue for the company before the price increases was
Total Revenue=$ 1 ,000 , 000+$ 6 , 000 , 000

3INTRODUCTORY HEALTH ECONOMICS
¿ $ 7 , 000 ,000
If the company increase price by 10%, new price for low income patients will be $11.
Consumption of low income patients will be decreased by 3%. The new consumption for low
income patients is 97, 000 scripts (Besanko and Braeutigam 2020). Therefore, new revenue from
low income patient is
Revenue=$ 11 × 97 , 000
¿ $ 1,067 , 000
The new price for high income patients will be $33. New consumption is 199,000. Therefore,
new revenue from high income patient is
Revenue=$ 33× 199 ,000
¿ $ 6,567 , 000
Total Revenue=$ 1,067 , 000+$ 6,567 , 000
¿ $ 7 , 634 , 000
As a result of 10% increase of price, total revenue of the company will be increased.
Question 2
Question a
Flu vaccination generates a positive externality. When a person takes vaccination against
flu, it not only protects that individual from the disease but also generates a spillover effect in
terms of protecting other individual in the society who may get infected (Mankiw 2020). The
marginal social benefit of flu vaccination is therefore greater than marginal private benefit.
Secure Best Marks with AI Grader
Need help grading? Try our AI Grader for instant feedback on your assignments.

4INTRODUCTORY HEALTH ECONOMICS
Question b
a. It is a positive externality since it has a positive spillover effect on society by preventing
spread of the flu.
b. Since the externality is generated from consumption of vaccine it is a consumption externality.
Question c
Figure 1: Market of flu vaccine
The figure above describes the market of flu vaccination. Since the vaccination generates
a positive externality the market demand curve fails to capture marginal social benefits. The
marginal social benefit curve is above the marginal private benefit (Cowell 2018). In an
unregulated market, equilibrium is achieved at E where marginal private benefit and marginal
private cost interests. PM and QM are the respective price and quantity in the private market.
Socially efficient equilibrium is at E1 with socially efficient price and quantity being QE and PE

5INTRODUCTORY HEALTH ECONOMICS
respectively. Therefore, in an unregulated market without government intervention there is an
under consumption of vaccines.
Question 3
Question a
Table 1: Total cost, Average total cost, Average variable cost and Marginal cost
Question b
From the above table it has been observed that marginal cost first decreases, reaches to
the minimum and then starts to increases. This is because initially average cost of production
falls with increase in output level meaning total cost increases at a decreasing rate and therefore
marginal cost falls (Browning and Zupan 2020). However, beyond 6 units of output, total cost
increases at an increasing rate and average cost start to increase. As a result, marginal cost
increases.

6INTRODUCTORY HEALTH ECONOMICS
Question c
Table 2: Price, Total revenue, Marginal revenue and Profit
Question d
Firm in a perfectly competitive market produces output up to the point where price is
either greater or equal to marginal cost (Kolmar 2017). This level of output maximizes profit of
the competitive firm. From the above table corresponding to output level 9, price is greater than
marginal cost. Beyond that, marginal cost exceeds price of $40. Therefore, at a market price of
$10, the optimum level of production is to produce 9 units of output.
Question 4
Question i
Demand schedule:
QD=500 – 5 P
Supply schedule:
QS =50+10 P
Paraphrase This Document
Need a fresh take? Get an instant paraphrase of this document with our AI Paraphraser

7INTRODUCTORY HEALTH ECONOMICS
At equilibrium,
QD=QS
¿ , 500 – 5 P=50+10 P
¿ , 15 P=450
¿ , P=30
Q=500−5 P
¿ 500− ( 5 × 30 )
¿ 500−150
¿ 350
Question ii
Figure 2: Demand, supply and equilibrium
Question iii
Free market equilibrium indicates the most efficient point of production and
consumption. At this point resources are allocated in the most efficient way. Willingness of

8INTRODUCTORY HEALTH ECONOMICS
buyers at this point exactly matches with willingness of sellers. There exists neither a shortage
nor a surplus in the market. Price in the free market works as an invisible hand to restore the
market equilibrium. Without any external change in demand or supply neither buyers nor sellers
have any incentive to deviate from the equilibrium position (Baumol and Blinder 2015).
Therefore, goods and services in a free market are produced and distributed in the most efficient
way.
Question 5
Question a
Supplier induced demand in economics refers to the ability of supplier to influence
consumer to make a larger demand compared to demand at the Pareto efficient level. This occurs
when there exists information asymmetry between consumers and suppliers (Mochrie 2015).
Suppliers here use the superior information in influence individual demand of consumers
resulting in a welfare loss.
Question b

9INTRODUCTORY HEALTH ECONOMICS
Figure 3: Supplier induced demand
The figure above explains the market with supplier induced demand curve. The actual
supply and demand curve in the market are shown by D and S respectively. Now in the presence
of asymmetry information between buyers and sellers, sellers can influence demand of the
consumers. Suppose supply increases from S to S1. The supplier induced demand curve in the
above figure is shown as Dsid. The new market equilibrium is E1. Because of the supplier induced
demand, demand increases more than the supply. This allows seller to charge a higher price at P1
and sell a larger quantity of Q1.
Question c
Since supplier induced demand is created due to presence of asymmetry information it
leads to welfare loss called deadweight loss to the society. The area of deadweight loss in the
above figure is shown as the area of shaded triangle E1FG.
Secure Best Marks with AI Grader
Need help grading? Try our AI Grader for instant feedback on your assignments.

10INTRODUCTORY HEALTH ECONOMICS
References
Baumol, W.J. and Blinder, A.S., 2015. Microeconomics: Principles and policy. Nelson
Education.
Besanko, D. and Braeutigam, R., 2020. Microeconomics. John Wiley & Sons.
Browning, E.K. and Zupan, M.A., 2020. Microeconomics: Theory and Applications. John Wiley
& Sons.
Cowell, F., 2018. Microeconomics: principles and analysis. Oxford University Press.
Kolmar, M., 2017. Principles of Microeconomics. Springer International Publishing.
Kreps, D.M., 2019. Microeconomics for managers. Princeton University Press.
Mankiw, N.G., 2020. Principles of microeconomics. Cengage Learning.
Mochrie, R., 2015. Intermediate microeconomics. Macmillan International Higher Education.
1 out of 11
Related Documents

Your All-in-One AI-Powered Toolkit for Academic Success.
+13062052269
info@desklib.com
Available 24*7 on WhatsApp / Email
Unlock your academic potential
© 2024 | Zucol Services PVT LTD | All rights reserved.