Health Economics: Market Dynamics and Government Intervention Effects
VerifiedAdded on 2023/06/04
|10
|777
|391
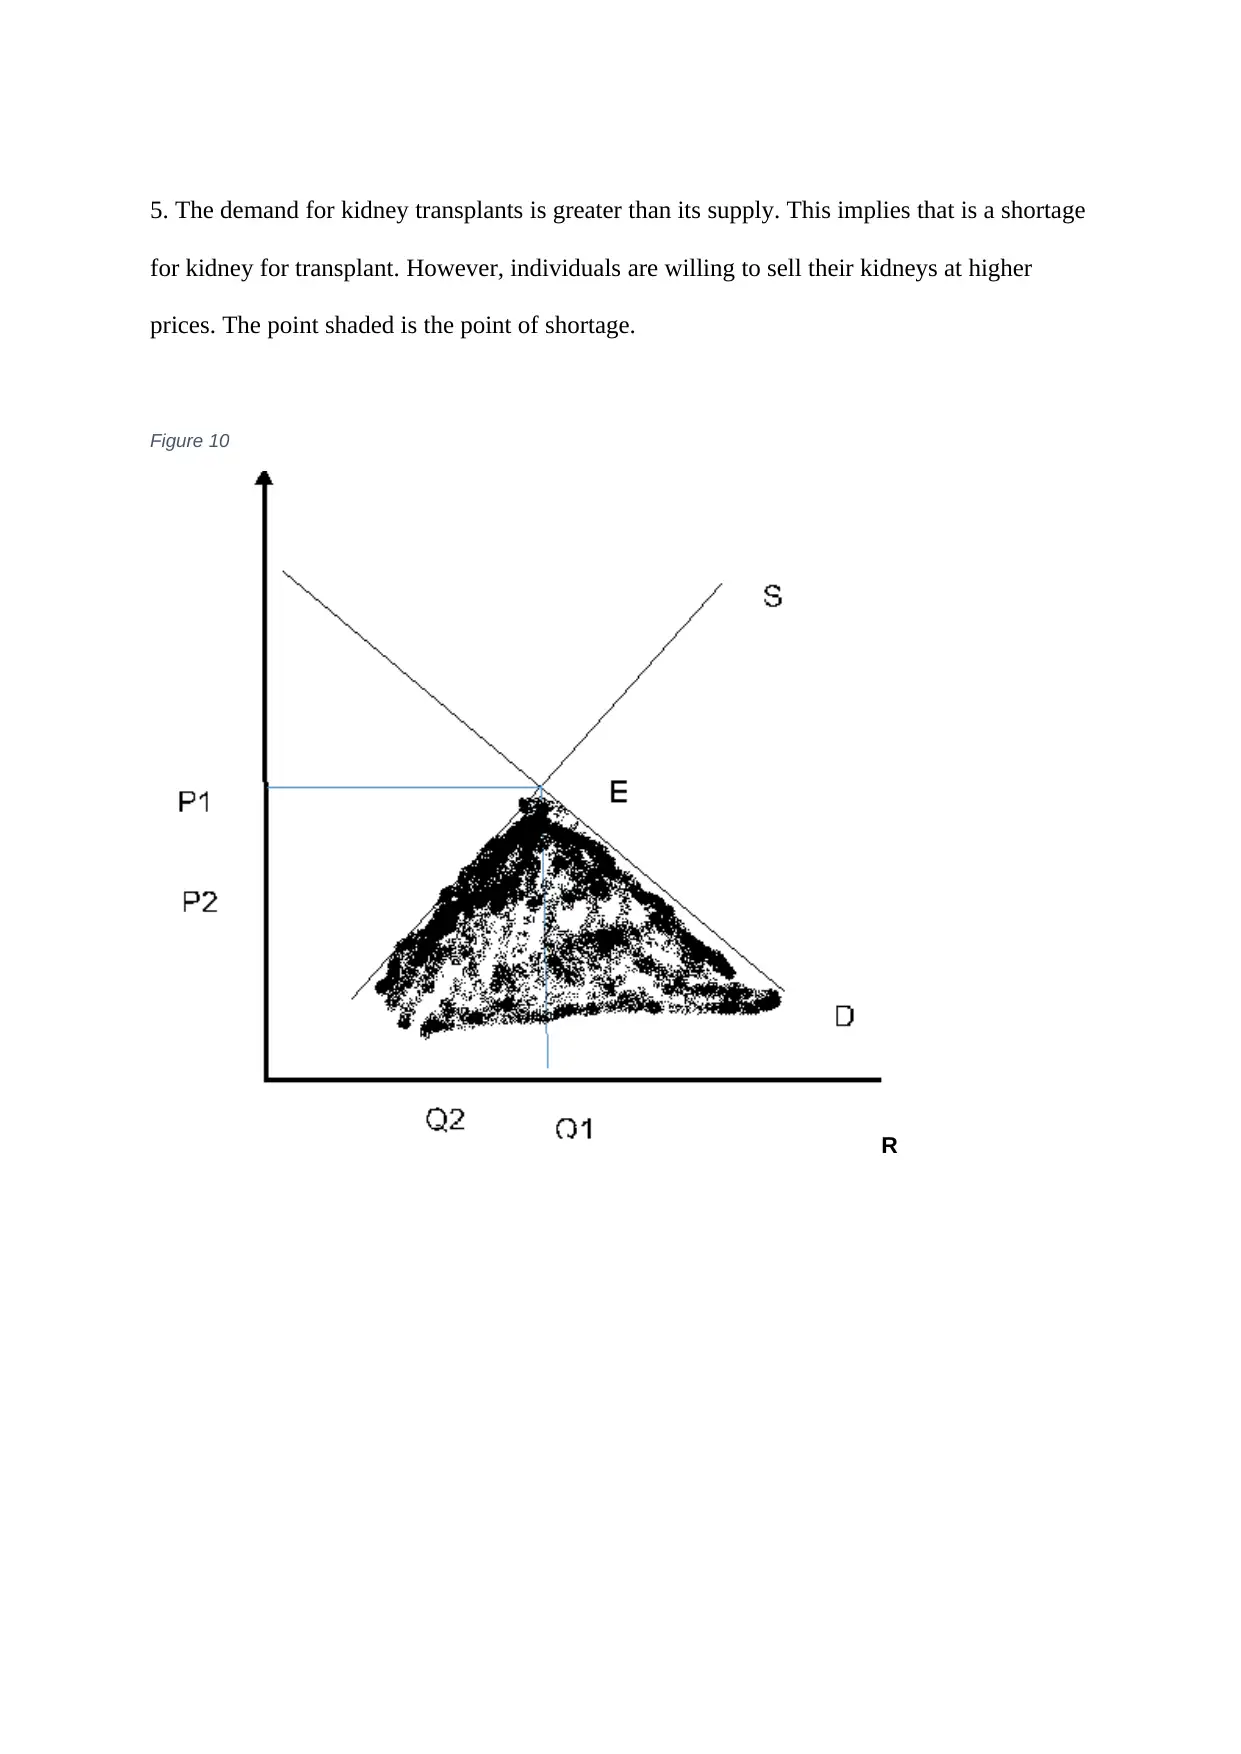
Homework Assignment
AI Summary
This assignment delves into various aspects of health economics, starting with an analysis of consumer utility maximization using indifference curves for alcohol and marijuana consumption, illustrating how changes in penalties (akin to price increases) affect consumer choices. It further examines market equilibrium shifts in the antihistamine and cosmetic surgery markets due to factors like production cost changes and increased disposable income, respectively. The assignment also addresses the impact of mandated tetanus vaccinations and government interventions like price capping on market dynamics, highlighting potential shortages. Finally, it touches upon the kidney transplant market, noting the persistent shortage due to high demand relative to supply. Desklib offers a wealth of similar solved assignments and study resources for students.

1 out of 10
Related Documents


Your All-in-One AI-Powered Toolkit for Academic Success.
+13062052269
info@desklib.com
Available 24*7 on WhatsApp / Email
![[object Object]](/_next/static/media/star-bottom.7253800d.svg)
Copyright © 2020–2026 A2Z Services. All Rights Reserved. Developed and managed by ZUCOL.