Health and Aged Care Funding Models and Financial Analysis Report

Verified

Added on  2023/01/19

|8
|1476
|45
Report
AI Summary
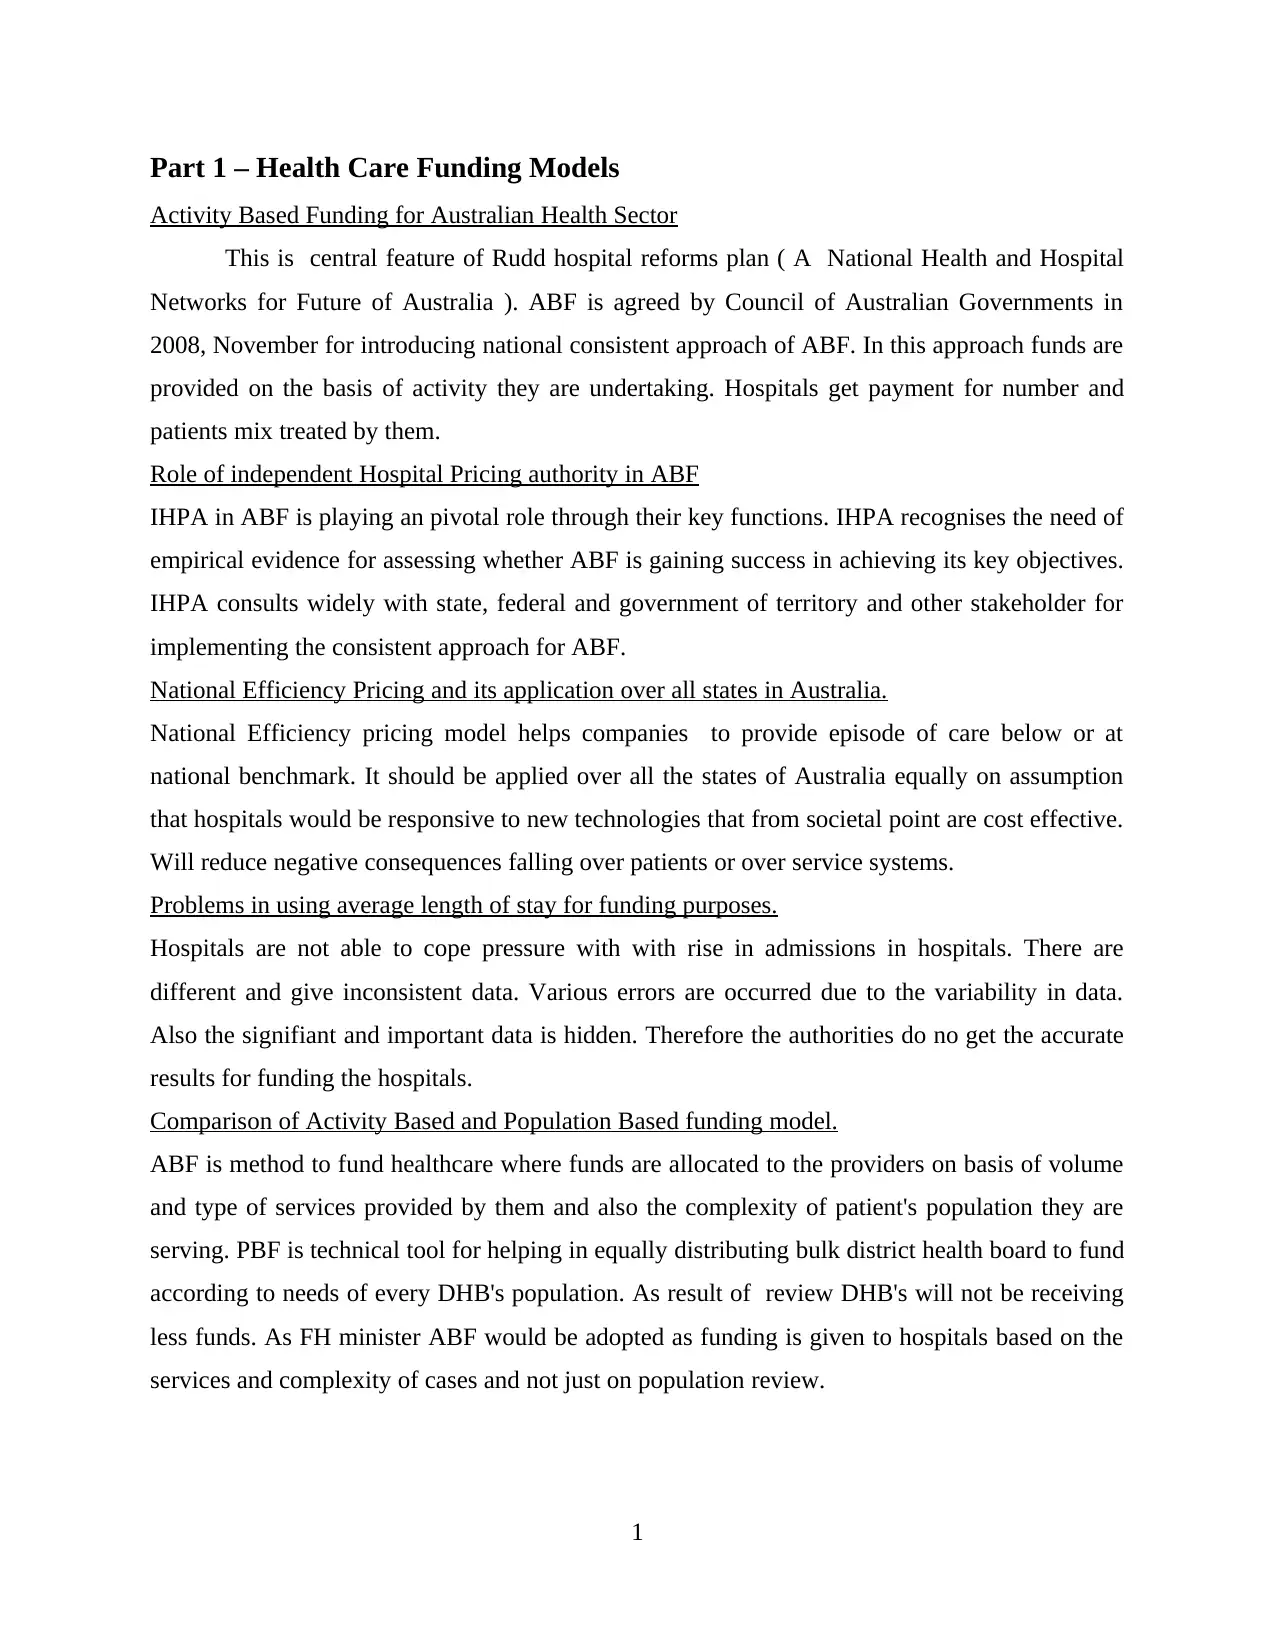
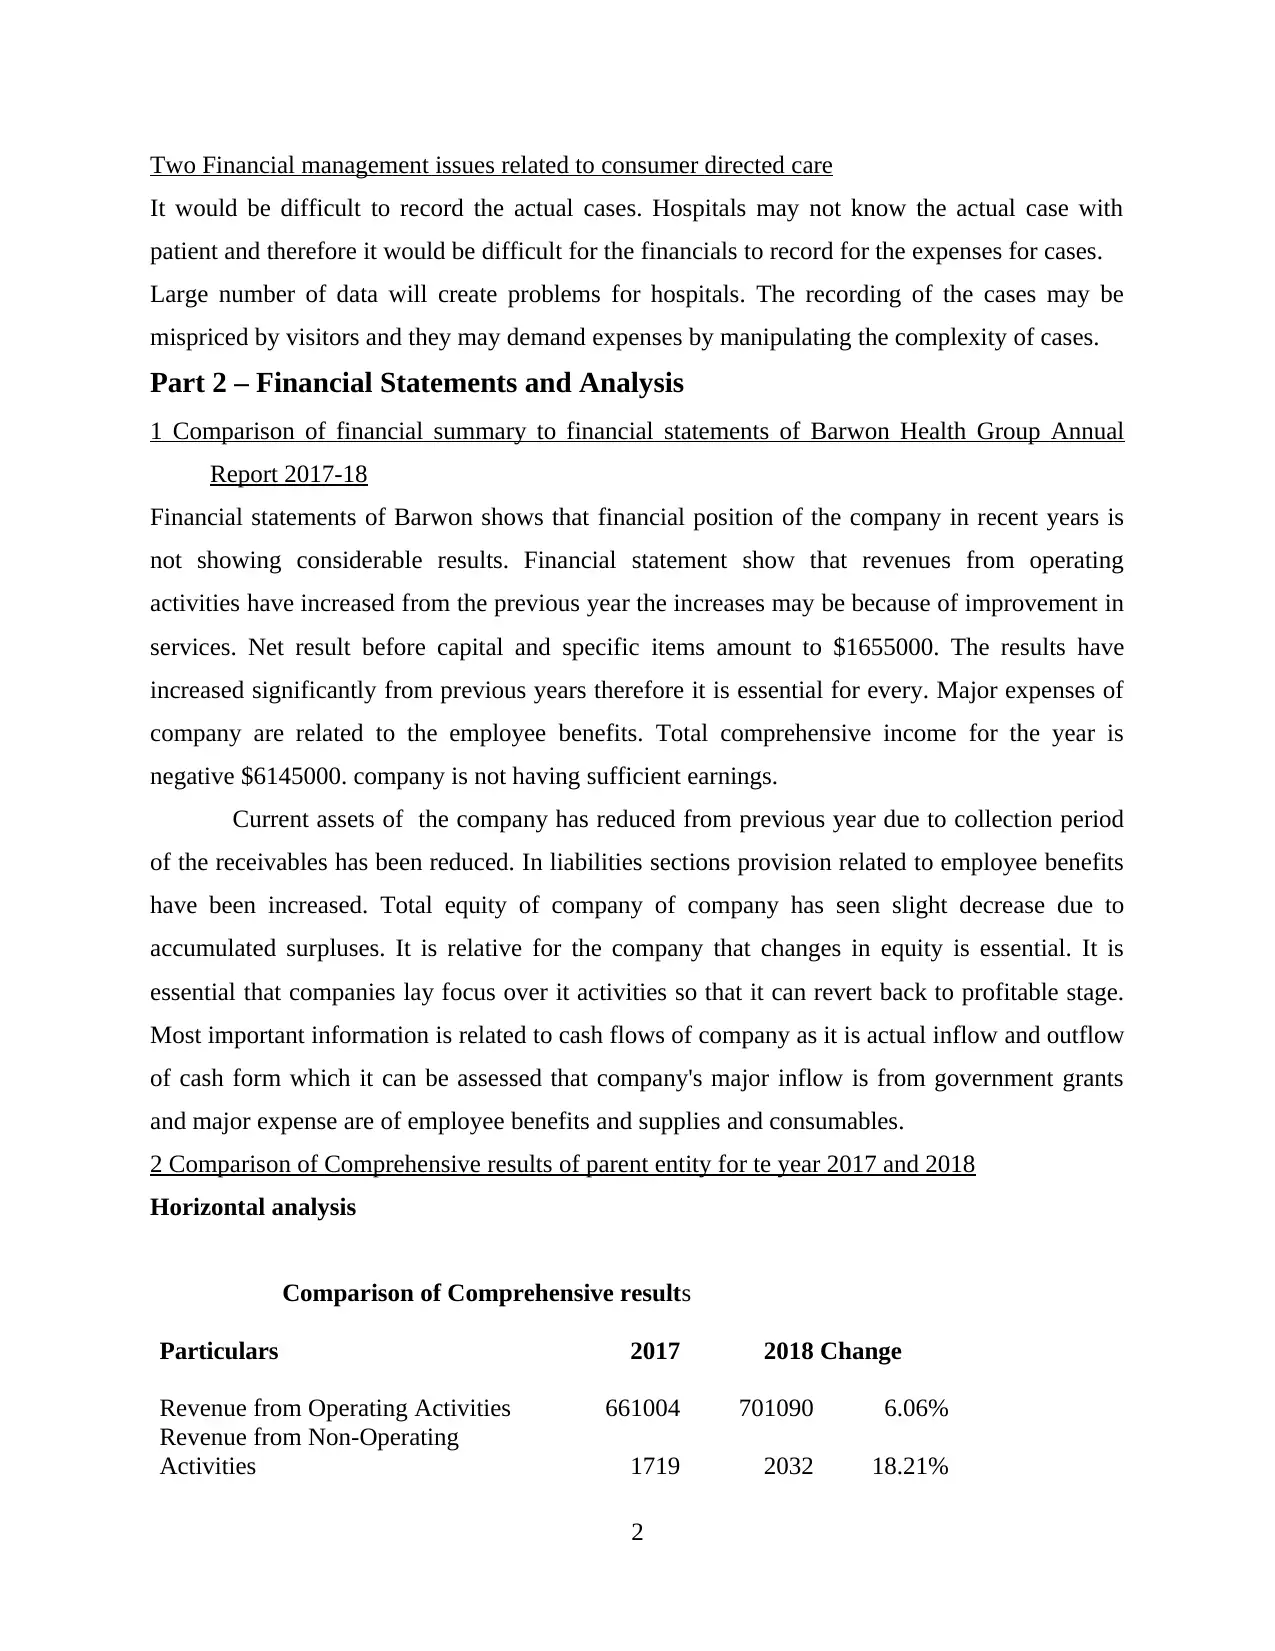
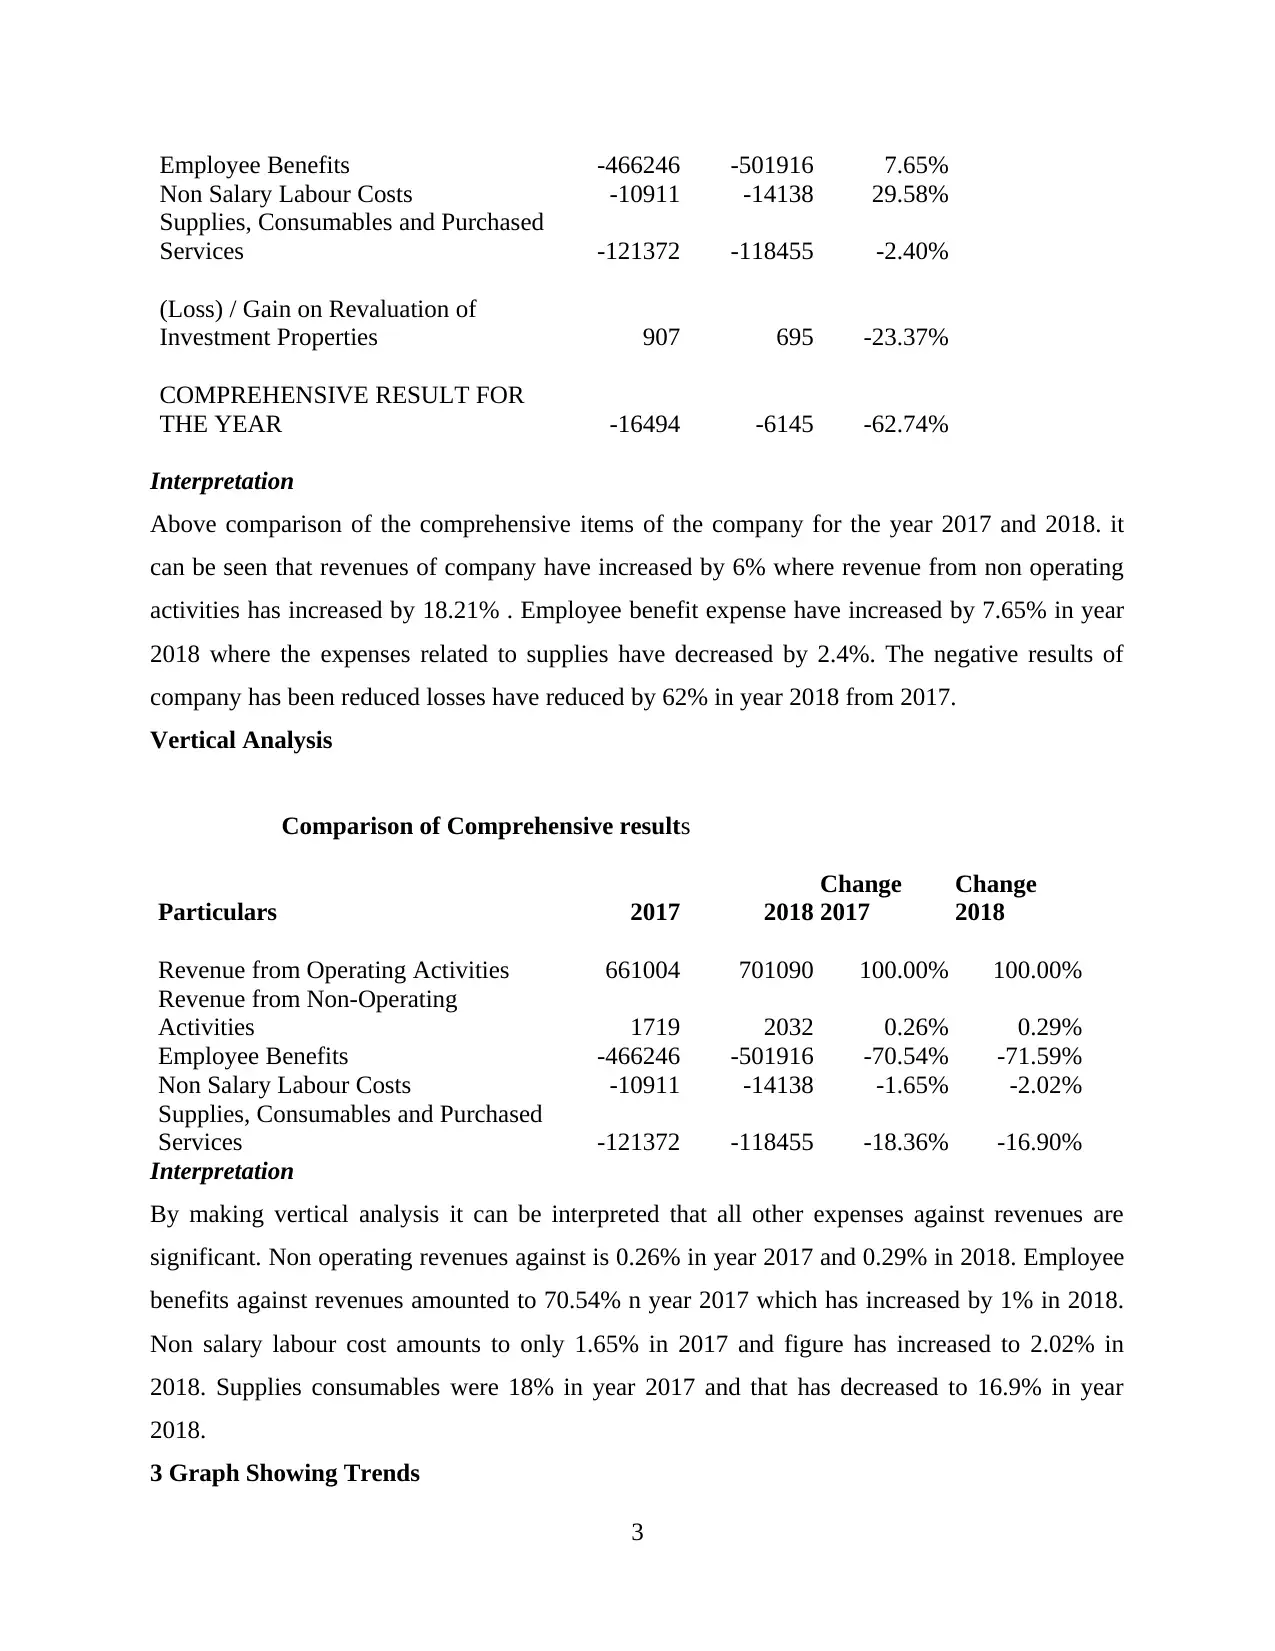
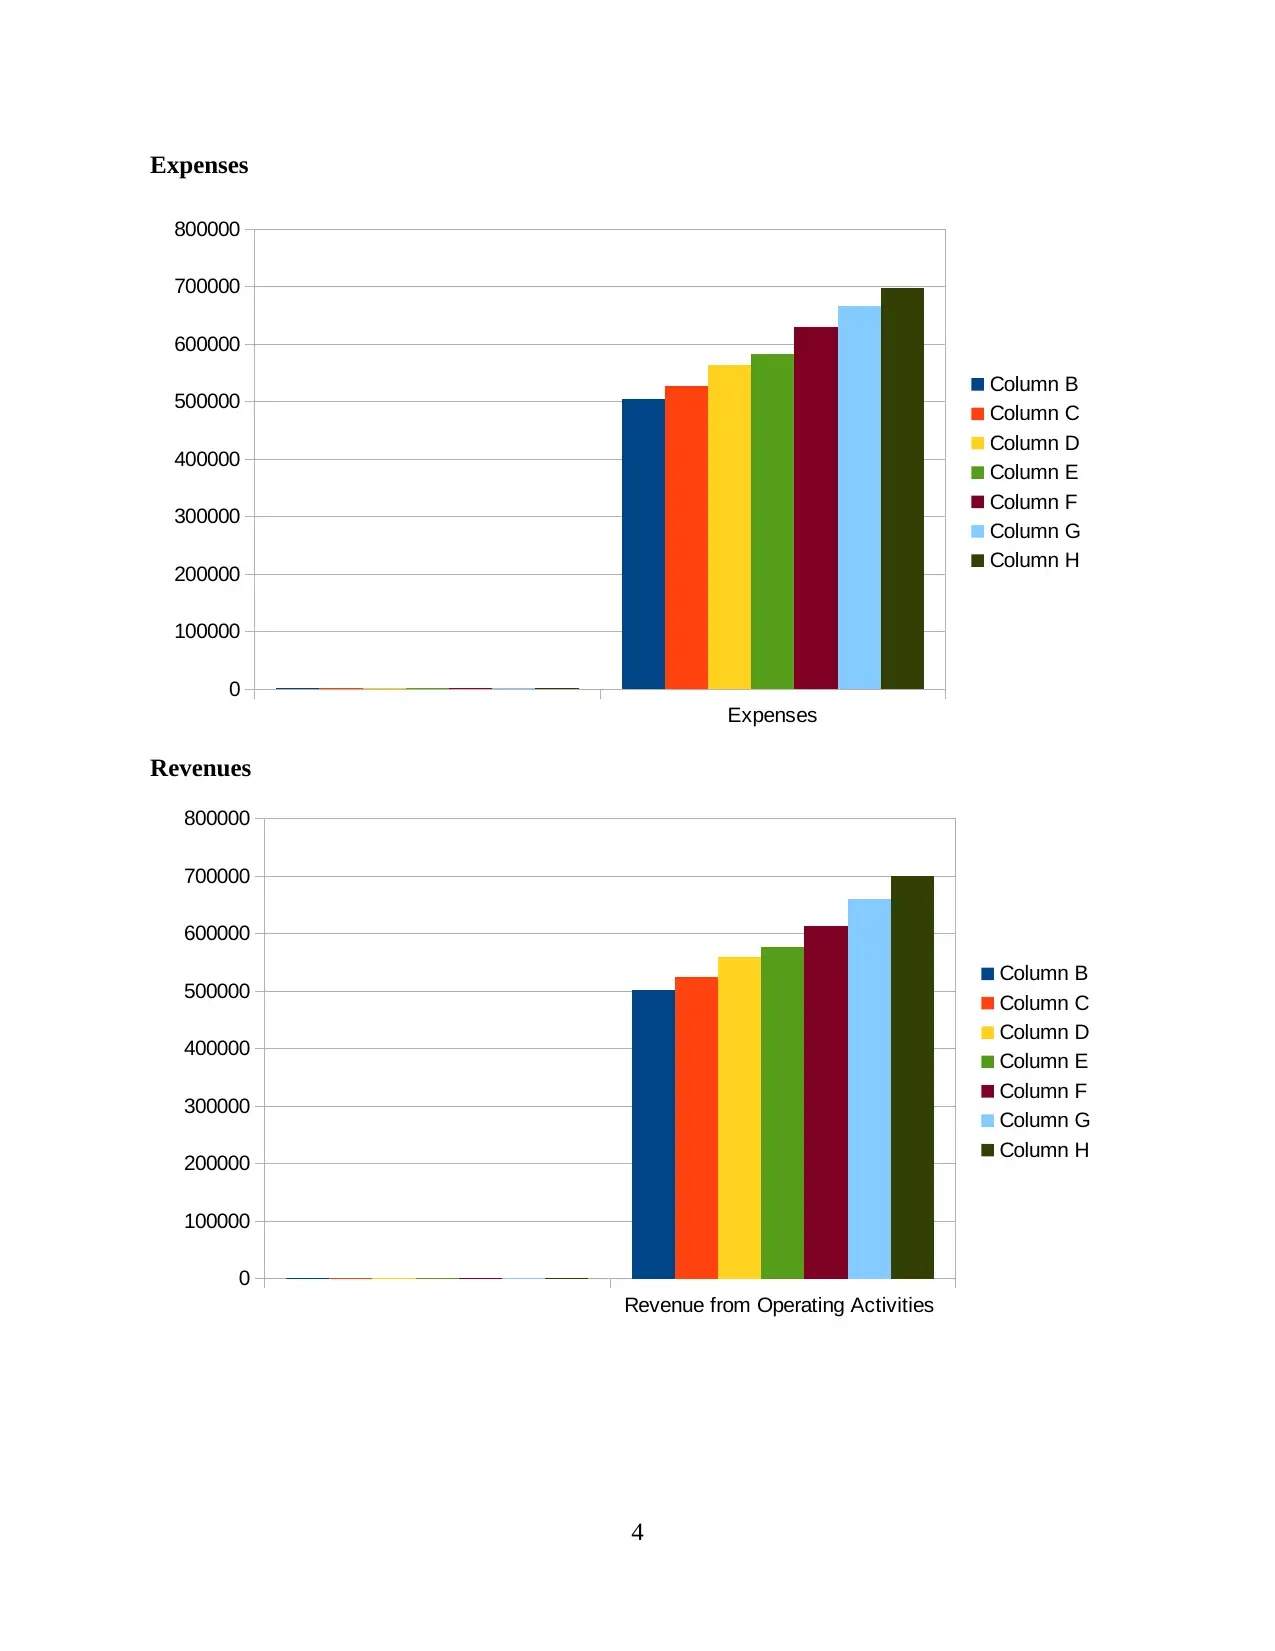
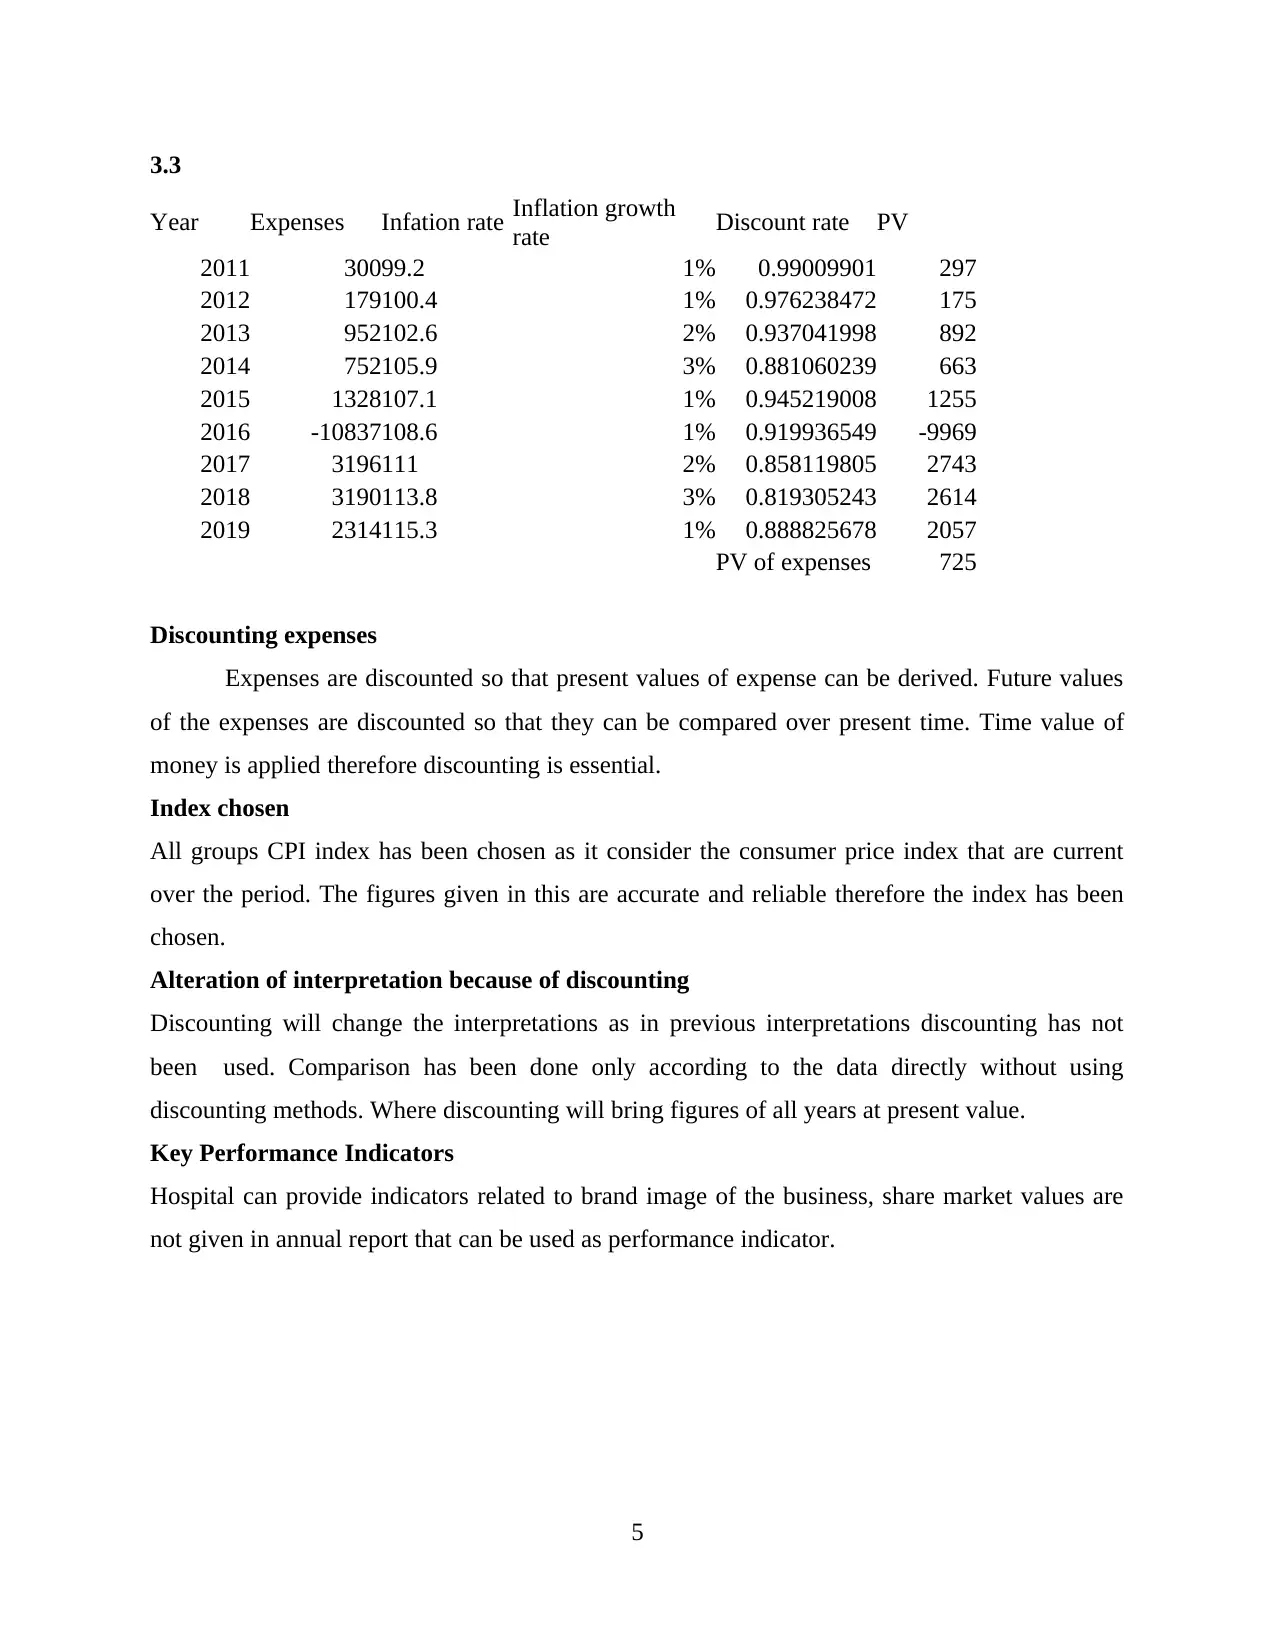
This report provides a comprehensive analysis of health care funding models, focusing on the Activity Based Funding (ABF) model within the Australian health sector. It examines the role of the Independent Hospital Pricing Authority (IHPA) in ABF, national efficiency pricing, and the challenges associated with using average length of stay for funding purposes. The report compares ABF with population-based funding models and identifies financial management issues related to consumer-directed care. Additionally, it delves into the financial statements of the Barwon Health Group, comparing financial summaries to the annual report for 2017-18 and analyzing comprehensive results for 2017 and 2018 using horizontal and vertical analysis, along with graphical representations of trends and discounted expenses. Key Performance Indicators are also discussed, offering a complete financial overview of the healthcare sector.
Document Page
HEALTH AND AGED CARE
FUNDING MODELS AND
FINANCIAL STATEMENTS
ANALYSIS
tabler-icon-diamond-filled.svg

Paraphrase This Document

Need a fresh take? Get an instant paraphrase of this document with our AI Paraphraser
Document Page
TABLE OF CONTENTS
Part 1 – Health Care Funding Models..............................................................................................1
Activity Based Funding for Australian Health Sector.................................................................1
Role of independent Hospital Pricing authority in ABF..............................................................1
National Efficiency Pricing and its application over all states in Australia................................1
Problems in using average length of stay for funding purposes..................................................1
Comparison of Activity Based and Population Based funding model........................................1
Two Financial management issues related to consumer directed care........................................2
Part 2 – Financial Statements and Analysis ....................................................................................2
1 Comparison of financial summary to financial statements of Barwon Health Group Annual
Report 2017-18............................................................................................................................2
2 Comparison of Comprehensive results of parent entity for te year 2017 and 2018.................2
REFERENCES................................................................................................................................6
Document Page
Part 1 – Health Care Funding Models
Activity Based Funding for Australian Health Sector
This is central feature of Rudd hospital reforms plan ( A National Health and Hospital
Networks for Future of Australia ). ABF is agreed by Council of Australian Governments in
2008, November for introducing national consistent approach of ABF. In this approach funds are
provided on the basis of activity they are undertaking. Hospitals get payment for number and
patients mix treated by them.
Role of independent Hospital Pricing authority in ABF
IHPA in ABF is playing an pivotal role through their key functions. IHPA recognises the need of
empirical evidence for assessing whether ABF is gaining success in achieving its key objectives.
IHPA consults widely with state, federal and government of territory and other stakeholder for
implementing the consistent approach for ABF.
National Efficiency Pricing and its application over all states in Australia.
National Efficiency pricing model helps companies to provide episode of care below or at
national benchmark. It should be applied over all the states of Australia equally on assumption
that hospitals would be responsive to new technologies that from societal point are cost effective.
Will reduce negative consequences falling over patients or over service systems.
Problems in using average length of stay for funding purposes.
Hospitals are not able to cope pressure with with rise in admissions in hospitals. There are
different and give inconsistent data. Various errors are occurred due to the variability in data.
Also the signifiant and important data is hidden. Therefore the authorities do no get the accurate
results for funding the hospitals.
Comparison of Activity Based and Population Based funding model.
ABF is method to fund healthcare where funds are allocated to the providers on basis of volume
and type of services provided by them and also the complexity of patient's population they are
serving. PBF is technical tool for helping in equally distributing bulk district health board to fund
according to needs of every DHB's population. As result of review DHB's will not be receiving
less funds. As FH minister ABF would be adopted as funding is given to hospitals based on the
services and complexity of cases and not just on population review.
1
Document Page
Two Financial management issues related to consumer directed care
It would be difficult to record the actual cases. Hospitals may not know the actual case with
patient and therefore it would be difficult for the financials to record for the expenses for cases.
Large number of data will create problems for hospitals. The recording of the cases may be
mispriced by visitors and they may demand expenses by manipulating the complexity of cases.
Part 2 – Financial Statements and Analysis
1 Comparison of financial summary to financial statements of Barwon Health Group Annual
Report 2017-18
Financial statements of Barwon shows that financial position of the company in recent years is
not showing considerable results. Financial statement show that revenues from operating
activities have increased from the previous year the increases may be because of improvement in
services. Net result before capital and specific items amount to $1655000. The results have
increased significantly from previous years therefore it is essential for every. Major expenses of
company are related to the employee benefits. Total comprehensive income for the year is
negative $6145000. company is not having sufficient earnings.
Current assets of the company has reduced from previous year due to collection period
of the receivables has been reduced. In liabilities sections provision related to employee benefits
have been increased. Total equity of company of company has seen slight decrease due to
accumulated surpluses. It is relative for the company that changes in equity is essential. It is
essential that companies lay focus over it activities so that it can revert back to profitable stage.
Most important information is related to cash flows of company as it is actual inflow and outflow
of cash form which it can be assessed that company's major inflow is from government grants
and major expense are of employee benefits and supplies and consumables.
2 Comparison of Comprehensive results of parent entity for te year 2017 and 2018
Horizontal analysis
Comparison of Comprehensive results
Particulars 2017 2018 Change
Revenue from Operating Activities 661004 701090 6.06%
Revenue from Non-Operating
Activities 1719 2032 18.21%
2
tabler-icon-diamond-filled.svg

Paraphrase This Document

Need a fresh take? Get an instant paraphrase of this document with our AI Paraphraser
Document Page
Employee Benefits -466246 -501916 7.65%
Non Salary Labour Costs -10911 -14138 29.58%
Supplies, Consumables and Purchased
Services -121372 -118455 -2.40%
(Loss) / Gain on Revaluation of
Investment Properties 907 695 -23.37%
COMPREHENSIVE RESULT FOR
THE YEAR -16494 -6145 -62.74%
Interpretation
Above comparison of the comprehensive items of the company for the year 2017 and 2018. it
can be seen that revenues of company have increased by 6% where revenue from non operating
activities has increased by 18.21% . Employee benefit expense have increased by 7.65% in year
2018 where the expenses related to supplies have decreased by 2.4%. The negative results of
company has been reduced losses have reduced by 62% in year 2018 from 2017.
Vertical Analysis
Comparison of Comprehensive results
Particulars 2017 2018
Change
2017
Change
2018
Revenue from Operating Activities 661004 701090 100.00% 100.00%
Revenue from Non-Operating
Activities 1719 2032 0.26% 0.29%
Employee Benefits -466246 -501916 -70.54% -71.59%
Non Salary Labour Costs -10911 -14138 -1.65% -2.02%
Supplies, Consumables and Purchased
Services -121372 -118455 -18.36% -16.90%
Interpretation
By making vertical analysis it can be interpreted that all other expenses against revenues are
significant. Non operating revenues against is 0.26% in year 2017 and 0.29% in 2018. Employee
benefits against revenues amounted to 70.54% n year 2017 which has increased by 1% in 2018.
Non salary labour cost amounts to only 1.65% in 2017 and figure has increased to 2.02% in
2018. Supplies consumables were 18% in year 2017 and that has decreased to 16.9% in year
2018.
3 Graph Showing Trends
3
Document Page
Expenses
Revenues
4
Expenses
0
100000
200000
300000
400000
500000
600000
700000
800000
Column B
Column C
Column D
Column E
Column F
Column G
Column H
Revenue from Operating Activities
0
100000
200000
300000
400000
500000
600000
700000
800000
Column B
Column C
Column D
Column E
Column F
Column G
Column H
Document Page
3.3
Year Expenses Infation rate Inflation growth
rate Discount rate PV
2011 30099.2 1% 0.99009901 297
2012 179100.4 1% 0.976238472 175
2013 952102.6 2% 0.937041998 892
2014 752105.9 3% 0.881060239 663
2015 1328107.1 1% 0.945219008 1255
2016 -10837108.6 1% 0.919936549 -9969
2017 3196111 2% 0.858119805 2743
2018 3190113.8 3% 0.819305243 2614
2019 2314115.3 1% 0.888825678 2057
PV of expenses 725
Discounting expenses
Expenses are discounted so that present values of expense can be derived. Future values
of the expenses are discounted so that they can be compared over present time. Time value of
money is applied therefore discounting is essential.
Index chosen
All groups CPI index has been chosen as it consider the consumer price index that are current
over the period. The figures given in this are accurate and reliable therefore the index has been
chosen.
Alteration of interpretation because of discounting
Discounting will change the interpretations as in previous interpretations discounting has not
been used. Comparison has been done only according to the data directly without using
discounting methods. Where discounting will bring figures of all years at present value.
Key Performance Indicators
Hospital can provide indicators related to brand image of the business, share market values are
not given in annual report that can be used as performance indicator.
5
tabler-icon-diamond-filled.svg

Paraphrase This Document

Need a fresh take? Get an instant paraphrase of this document with our AI Paraphraser
Document Page
6
chevron_up_icon
1 out of 8
circle_padding
hide_on_mobile
zoom_out_icon
[object Object]