Health Inequality Report: Socioeconomic Factors in Victoria
VerifiedAdded on 2021/04/21
|12
|2528
|64
Report
AI Summary
This report provides an in-depth analysis of health inequalities within the Victoria region of Australia, examining the impact of various factors on health outcomes. It highlights key disparities related to chronic diseases such as diabetes, lifestyle choices including smoking and alcohol consumption, socioeconomic inequalities, and geographical location. The report uses statistical data and charts to illustrate the differences in health outcomes across different demographic groups, including age, gender, income levels, and place of residence. It explores how factors like access to healthcare, education, and employment influence health, and it identifies the need for interventions to address these inequities. The report references multiple sources and statistical data to support its findings, emphasizing the importance of considering these factors to improve public health outcomes and promote health equity. The analysis covers the prevalence of diseases like hypertension, obesity, and cancer, and also addresses the impact of lifestyle choices such as smoking, alcohol consumption, and physical exercise. The report emphasizes the need for interventions to address these inequities and improve public health outcomes.
Running head: HEALTH INEQUALITY REPORT 1
Health Inequality Report
Name
Institutional Affiliation
Health Inequality Report
Name
Institutional Affiliation
Paraphrase This Document
Need a fresh take? Get an instant paraphrase of this document with our AI Paraphraser
HEALTH INEQUALITY REPORT 2
Health Inequality Report
Introduction
Inequalities and inequities in health are caused by many things, key among them
being social standing, race and ethnicity, and geographical location. Health inequality is the
reason why even though life expectancy is high and gets better with new medical research
discoveries, average life expectancy of a wealthy person would be more than that of a poorer
person. Mortality of children under the age of five years is also affected (Davey-Smith, Hart,
& Montgomery, 1997). A health equity audit should be done to compare the level of medical
care received by different demographic groups and areas so as to identify loopholes in health
care provision that may cause poor health to some people. Since different demographics go
through different immediate environments and physical activities every day, the likelihood of
getting health complications is not the same for each individual (Davey-Smith, Hart, &
Montgomery, 1997). Some alcohol consumers are under a larger threat of getting alcohol-
induced injury than others. Others who live in more cramped quarters ar This report will
highlight four major health inequalities in the Victoria which is a region that has both a rural
and a cosmopolitan are with reference to chronic diseases, lifestyles like smoking and alcohol
consumption, social disparities, hypertension, obesity and physical exercise.
Health equity refers to the absence of systematic or avoidable disparities in health
susceptible to a different group of infections, between groups of people, whether these groups
are defined socially, economically, geographically or demographically (Department of Health
, 2011).
Health inequities are the differences in health outcomes and their risk factors between social
groups that are socially produced, systematic in their distribution, avoidable, unfair and
unjust (Department of Health , 2011). Health inequities are differences in health status
HEALTH INEQUALITY REPORT 3
between population groups that are socially produced, systematic in their unequal distribution
across the population, avoidable and unfair.
Health inequalities
1. Age and Gender. 5.9% of women with an income below $40000 were underweight as
compared to 2% of men under the same conditions (Graham, 2002). Women also when
employed and well educated were significantly less obese and had a larger percentage
with a normal BMI than men with similar conditions. More males, in general, were obese.
Men who did not complete high school or were unemployed undertook less physical
activity as compared to all Victorian men (Victorian Department of Health , 2012).
More women than men reported high or very high levels of psychological distress, mostly
between the ages of 55-64 for males and 18-24 and 65-74 for women. Men who reported
experiencing depression either did not consume alcohol, were diagnosed with hypertension,
or had two or more chronic diseases (Victorian Department of Health , 2012). On the other
hand, women who were current smokers and had two or more chronic diseases were more
likely to give a poor self-reported health status and were more depressed.
Prevalence of diseases like hypertension was more in men than in women. Type 2
diabetes, which is a chronic disease associated with obesity and careless weight gain together
with hereditary factors, occurs more in individuals over the age of 50. Type 1 diabetes occurs
from the body not producing insulin and is contacted by people under the age of 30
(Victorian Department of Health , 2012). It is also called juvenile offset diabetes and has no
cure yet despite numerous research.
⊘ This is a preview!⊘
Do you want full access?
Subscribe today to unlock all pages.
Trusted by 1+ million students worldwide
HEALTH INEQUALITY REPORT 4
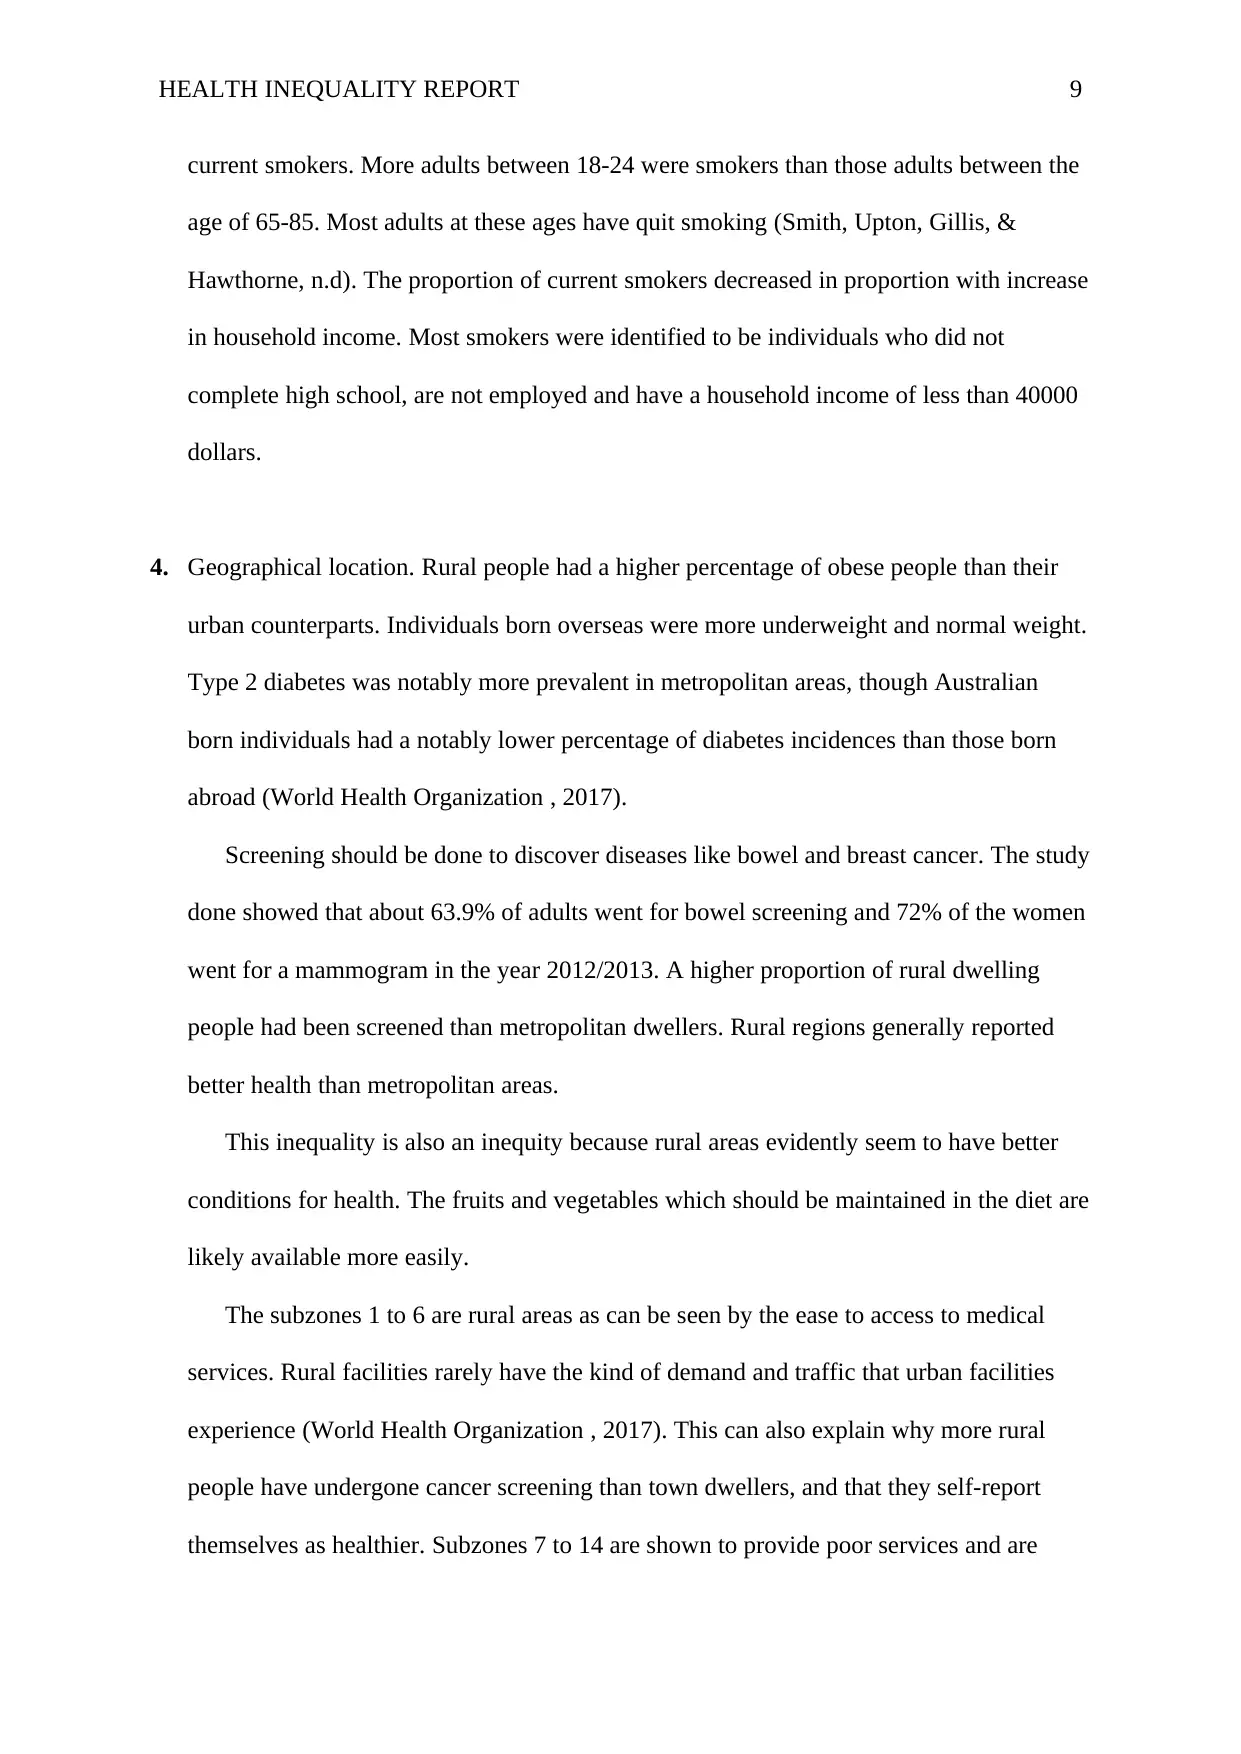
Subzone 01
Subzone 02
Subzone 03
Subzone 04
Subzone 05
Subzone 06
Subzone 07
Subzone 08
Subzone 09
Subzone 10
Subzone 11
Subzone 12
Subzone 13
Subzone 14
Subzone 15
0
1,000
2,000
3,000
4,000
5,000
6,000
7,000
8,000
224 273 336 259 551 673
1,537
3,200
1,960
3,808
3,014
3,9704,206
6,980
5,129
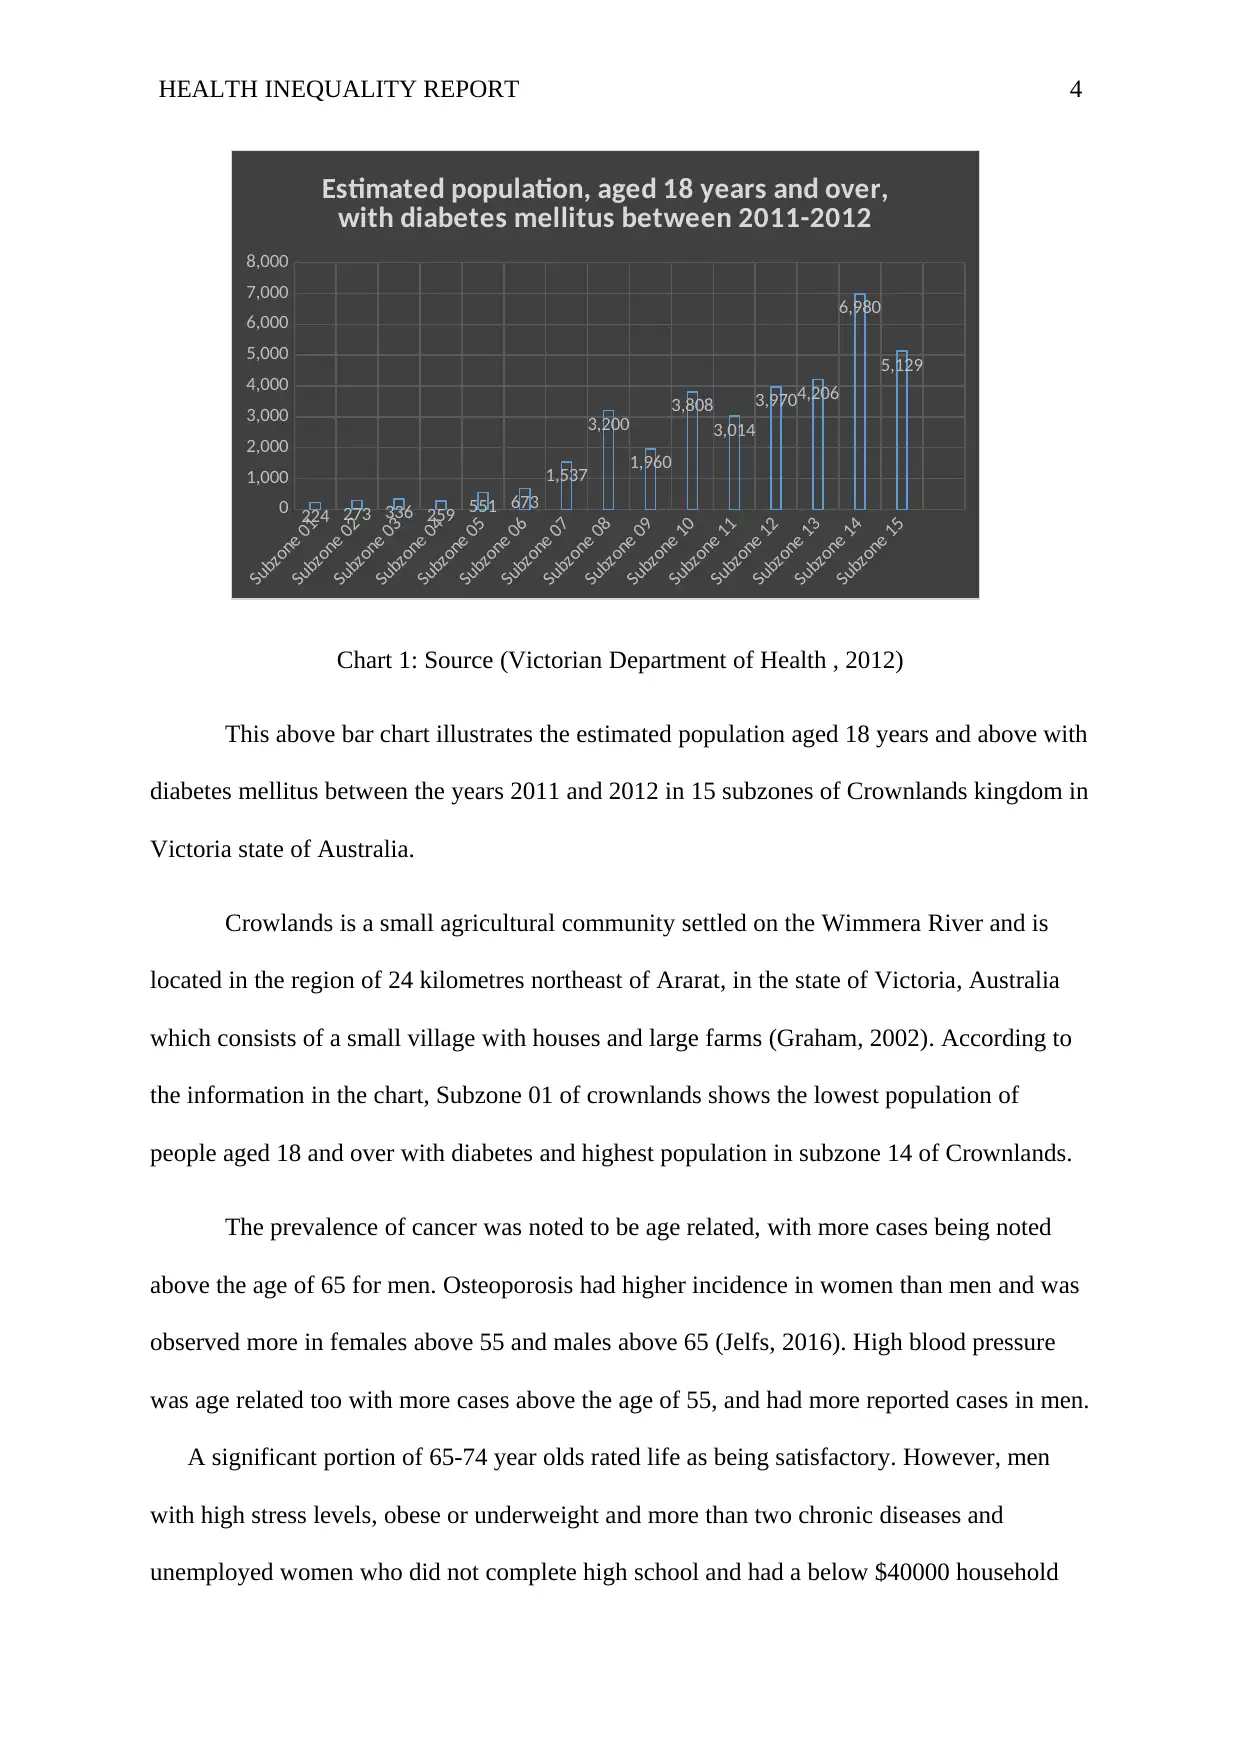
Estimated population, aged 18 years and over,
with diabetes mellitus between 2011-2012
Chart 1: Source (Victorian Department of Health , 2012)
This above bar chart illustrates the estimated population aged 18 years and above with
diabetes mellitus between the years 2011 and 2012 in 15 subzones of Crownlands kingdom in
Victoria state of Australia.
Crowlands is a small agricultural community settled on the Wimmera River and is
located in the region of 24 kilometres northeast of Ararat, in the state of Victoria, Australia
which consists of a small village with houses and large farms (Graham, 2002). According to
the information in the chart, Subzone 01 of crownlands shows the lowest population of
people aged 18 and over with diabetes and highest population in subzone 14 of Crownlands.
The prevalence of cancer was noted to be age related, with more cases being noted
above the age of 65 for men. Osteoporosis had higher incidence in women than men and was
observed more in females above 55 and males above 65 (Jelfs, 2016). High blood pressure
was age related too with more cases above the age of 55, and had more reported cases in men.
A significant portion of 65-74 year olds rated life as being satisfactory. However, men
with high stress levels, obese or underweight and more than two chronic diseases and
unemployed women who did not complete high school and had a below $40000 household
Subzone 01
Subzone 02
Subzone 03
Subzone 04
Subzone 05
Subzone 06
Subzone 07
Subzone 08
Subzone 09
Subzone 10
Subzone 11
Subzone 12
Subzone 13
Subzone 14
Subzone 15
0
1,000
2,000
3,000
4,000
5,000
6,000
7,000
8,000
224 273 336 259 551 673
1,537
3,200
1,960
3,808
3,014
3,9704,206
6,980
5,129
Estimated population, aged 18 years and over,
with diabetes mellitus between 2011-2012
Chart 1: Source (Victorian Department of Health , 2012)
This above bar chart illustrates the estimated population aged 18 years and above with
diabetes mellitus between the years 2011 and 2012 in 15 subzones of Crownlands kingdom in
Victoria state of Australia.
Crowlands is a small agricultural community settled on the Wimmera River and is
located in the region of 24 kilometres northeast of Ararat, in the state of Victoria, Australia
which consists of a small village with houses and large farms (Graham, 2002). According to
the information in the chart, Subzone 01 of crownlands shows the lowest population of
people aged 18 and over with diabetes and highest population in subzone 14 of Crownlands.
The prevalence of cancer was noted to be age related, with more cases being noted
above the age of 65 for men. Osteoporosis had higher incidence in women than men and was
observed more in females above 55 and males above 65 (Jelfs, 2016). High blood pressure
was age related too with more cases above the age of 55, and had more reported cases in men.
A significant portion of 65-74 year olds rated life as being satisfactory. However, men
with high stress levels, obese or underweight and more than two chronic diseases and
unemployed women who did not complete high school and had a below $40000 household
Paraphrase This Document
Need a fresh take? Get an instant paraphrase of this document with our AI Paraphraser
HEALTH INEQUALITY REPORT 5
income self-reported their health as poor (Kristenson, 2006). Adults between 18-34 mostly
reported their health as good and excellent. Women reported their health as good and
excellent more times than men.
2. Socioeconomic inequalities. Adults with a total annual income of less than 40000 dollars
had higher incidences of obesity. It is also worth noting that this same demographic did
not consume recommended amounts of fruits and vegetables, and covered less or no
hours of physical exercise (Marmot & Bell, 2013). This was also the case for people who
were not in the job circulation, while the employed had a significantly larger percentage
of pre-obesity cases. A significantly large percentage of women whose education reached
tertiary level had a normal body mass index (BMI), and this demographic also had the
lowest percentage of obese people (Marmot & Bell, 2013). This trend is also observed
with women whose household income exceeded 100000 dollars. It is noted that people
with lower incomes and education levels or not in a labour force were more likely to be
depressed. The statistics from the study indicate that men who did not complete school,
were unemployed, not in a labour force and a household income below $40000 were
more depressed (Ostlin, 2002). Incidence of diabetes also decreased with increase in
household income for both men and women.
It was reported that a higher percentage of people who took screening tests had a
household incomes of between 40000-100000 dollars.
This inequality can be considered an inequity since only some people can access some
beneficial things like screening, and since mental health is associated with a semblance of
financial stability. Subzones 1 to 6 on the chart are seen to be inhabited by financially
HEALTH INEQUALITY REPORT 6
able individuals because most of them can afford to get medical services (Pearce,
Mitchell, & Shortt, 2015).
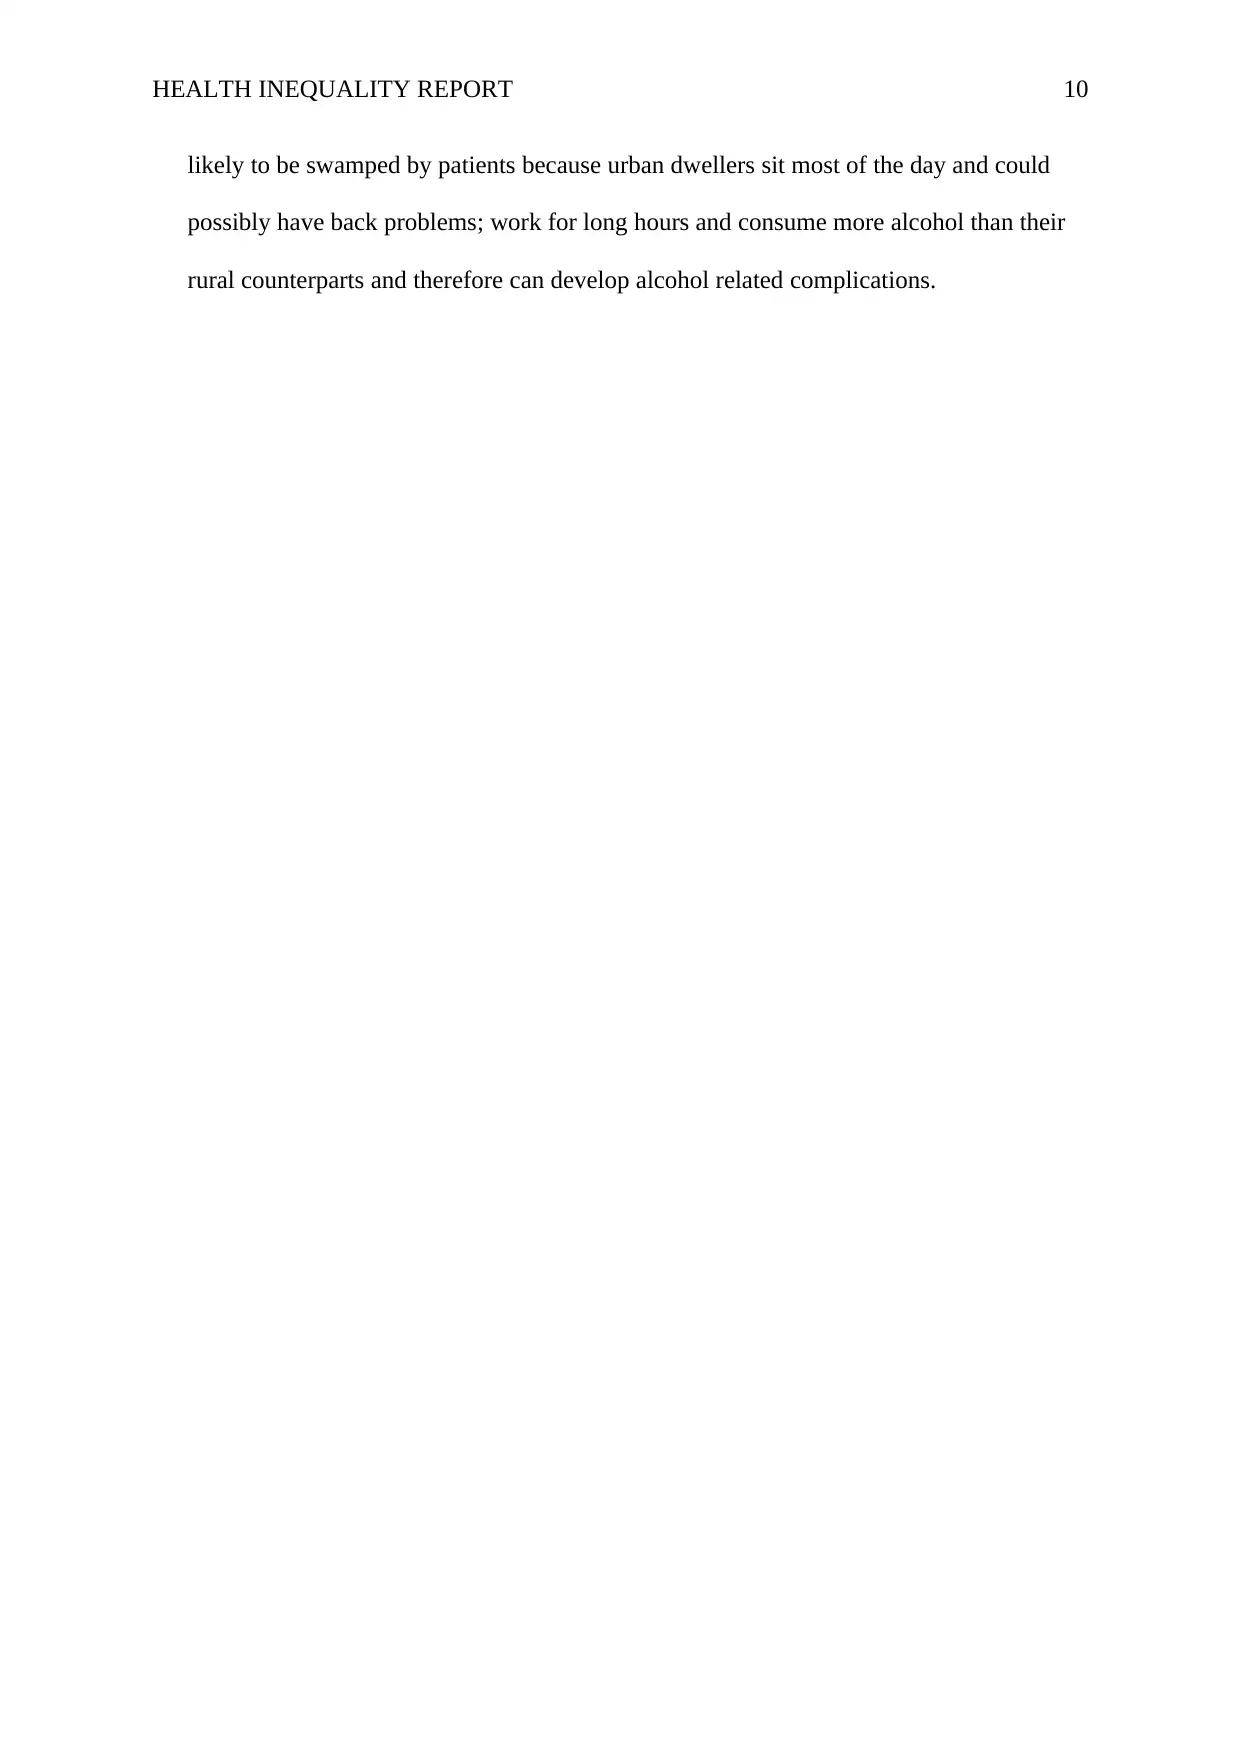
Subzone 07
Subzone 13
Subzone 10
Subzone 09
Subzone 08
Subzone 06
Subzone 05
Subzone 11
Subzone 04
Subzone 15
Subzone 14
Subzone 01
Subzone 02
Subzone 12
Subzone 03
0
5,000
10,000
15,000
20,000
25,000
Persons aged 18 years and over who delayed medical
consultation because they could not afford it (modelled
estimates) 2010
Number ASR per 100
Chart 2: Source (Department of Health , 2011)
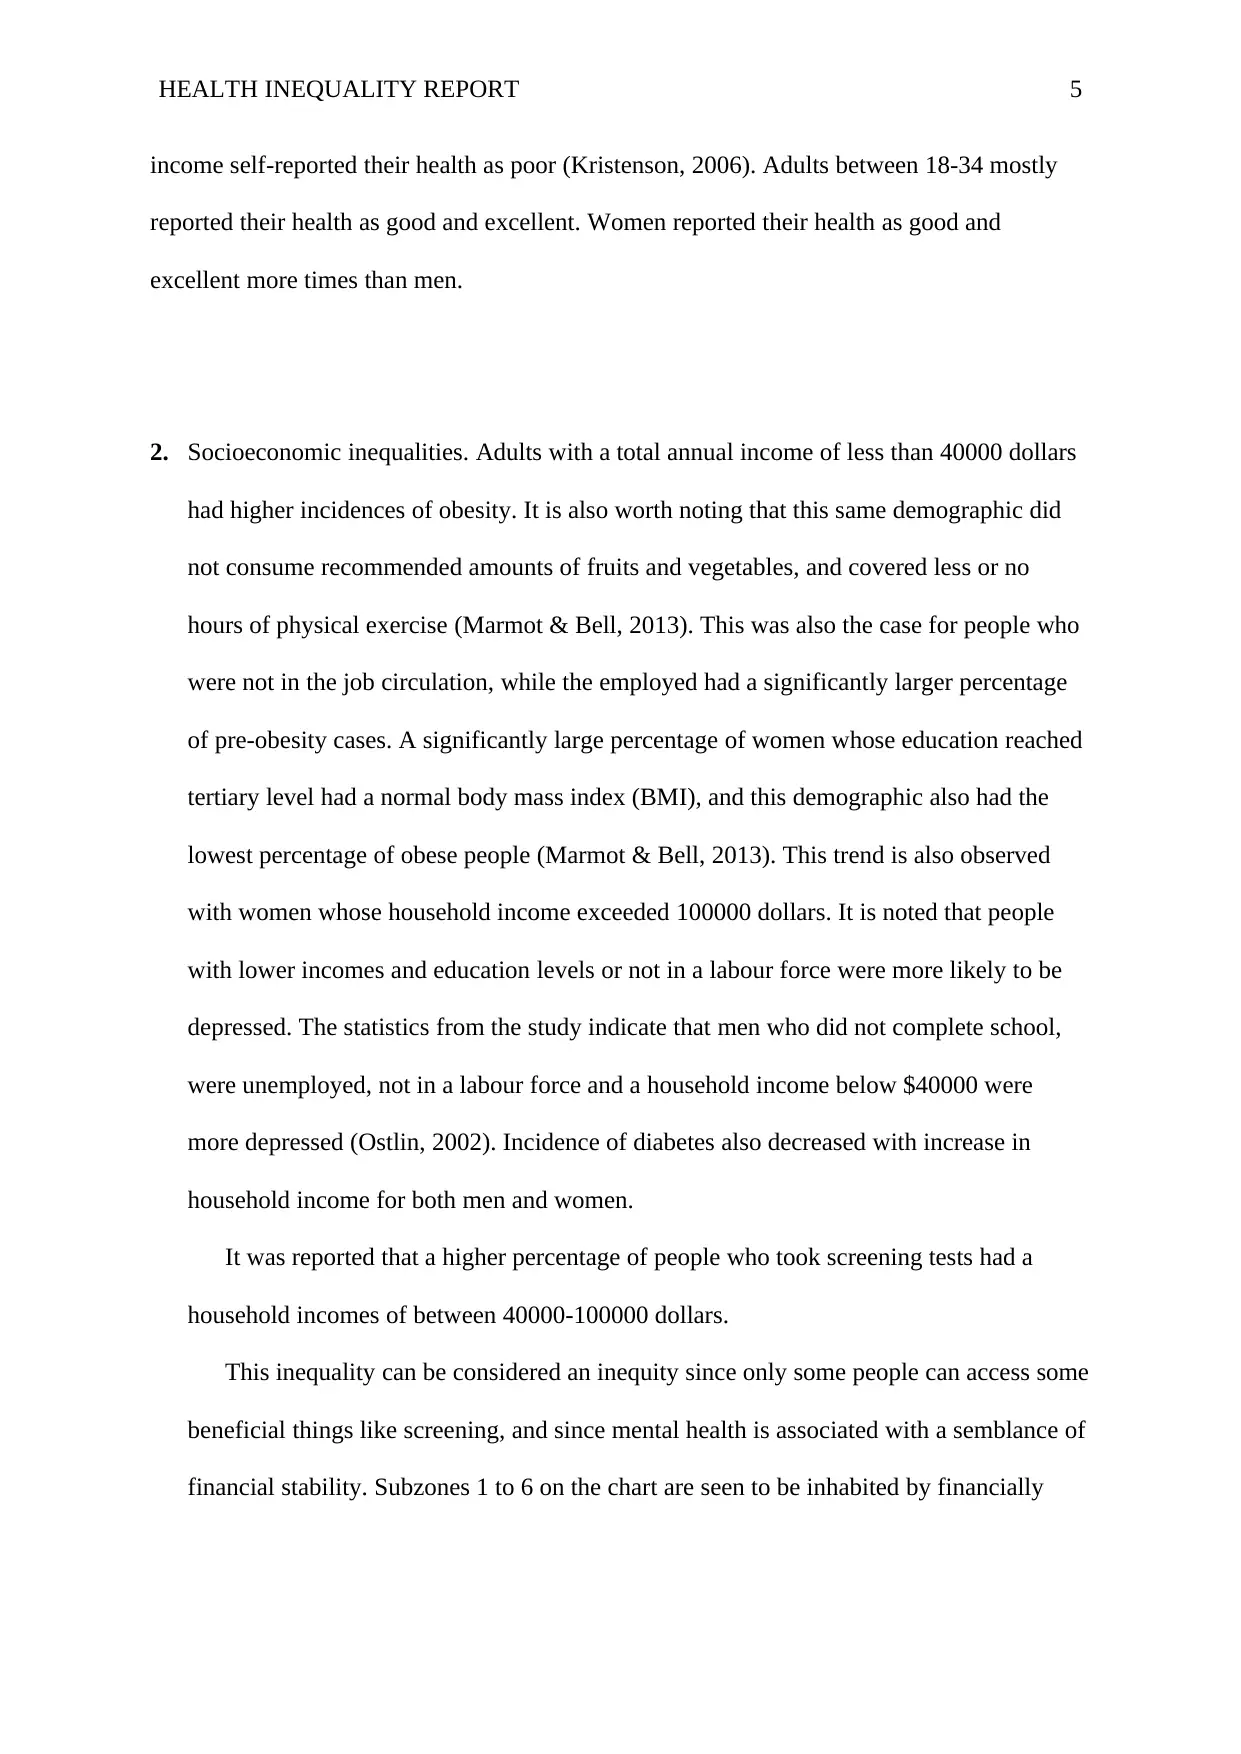
Bar chart 2, represent the number of people aged 18 years and above who has delayed
medical consultations due to inability to afford in the year 2010. As per the chart, there had
been more people in subzone 14 who could not afford to have medical consultations and
lesser number of people in subzone 01 respectively.
By looking at bar chart 1 & 2 we, can come to a conclusion that the population with
diabetes mellitus in subzone 1 was low because, they were able to afford medical
consultations whereas the people in subzone 14 presented with more number of diabetes
cases since they had extremely poor affordability for medical consultations.
able individuals because most of them can afford to get medical services (Pearce,
Mitchell, & Shortt, 2015).
Subzone 07
Subzone 13
Subzone 10
Subzone 09
Subzone 08
Subzone 06
Subzone 05
Subzone 11
Subzone 04
Subzone 15
Subzone 14
Subzone 01
Subzone 02
Subzone 12
Subzone 03
0
5,000
10,000
15,000
20,000
25,000
Persons aged 18 years and over who delayed medical
consultation because they could not afford it (modelled
estimates) 2010
Number ASR per 100
Chart 2: Source (Department of Health , 2011)
Bar chart 2, represent the number of people aged 18 years and above who has delayed
medical consultations due to inability to afford in the year 2010. As per the chart, there had
been more people in subzone 14 who could not afford to have medical consultations and
lesser number of people in subzone 01 respectively.
By looking at bar chart 1 & 2 we, can come to a conclusion that the population with
diabetes mellitus in subzone 1 was low because, they were able to afford medical
consultations whereas the people in subzone 14 presented with more number of diabetes
cases since they had extremely poor affordability for medical consultations.
⊘ This is a preview!⊘
Do you want full access?
Subscribe today to unlock all pages.
Trusted by 1+ million students worldwide
HEALTH INEQUALITY REPORT 7
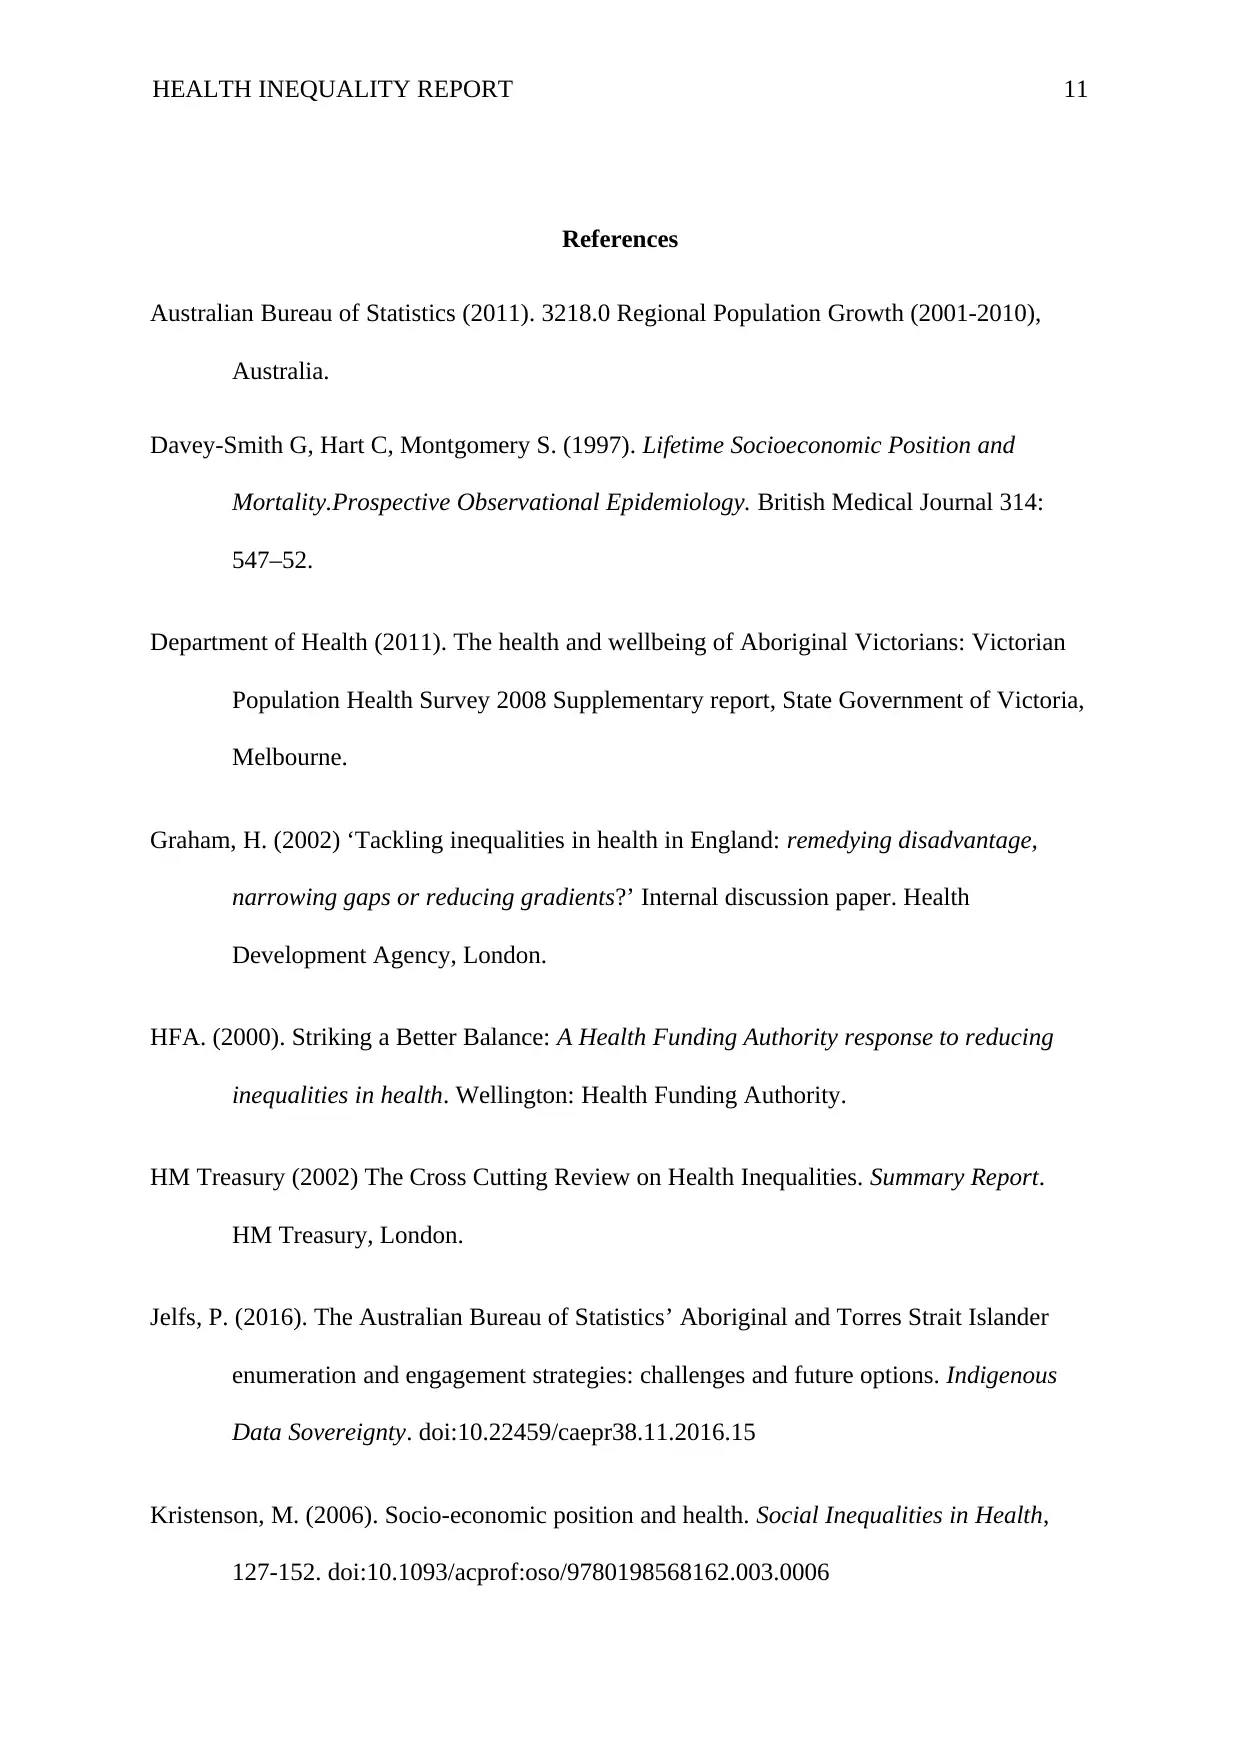
0
2,000
4,000
6,000
8,000
10,000
12,000
14,000
16,000
18,000
9,807
6,014
1,469
15,40814,959
7,540
2,048547
8,157
14,413
849 591
7,963
4,127
711
Persons aged 18 years and over who delayed purchasing
prescribed medication because they could not afford it
(modelled estimates) 2010
Number
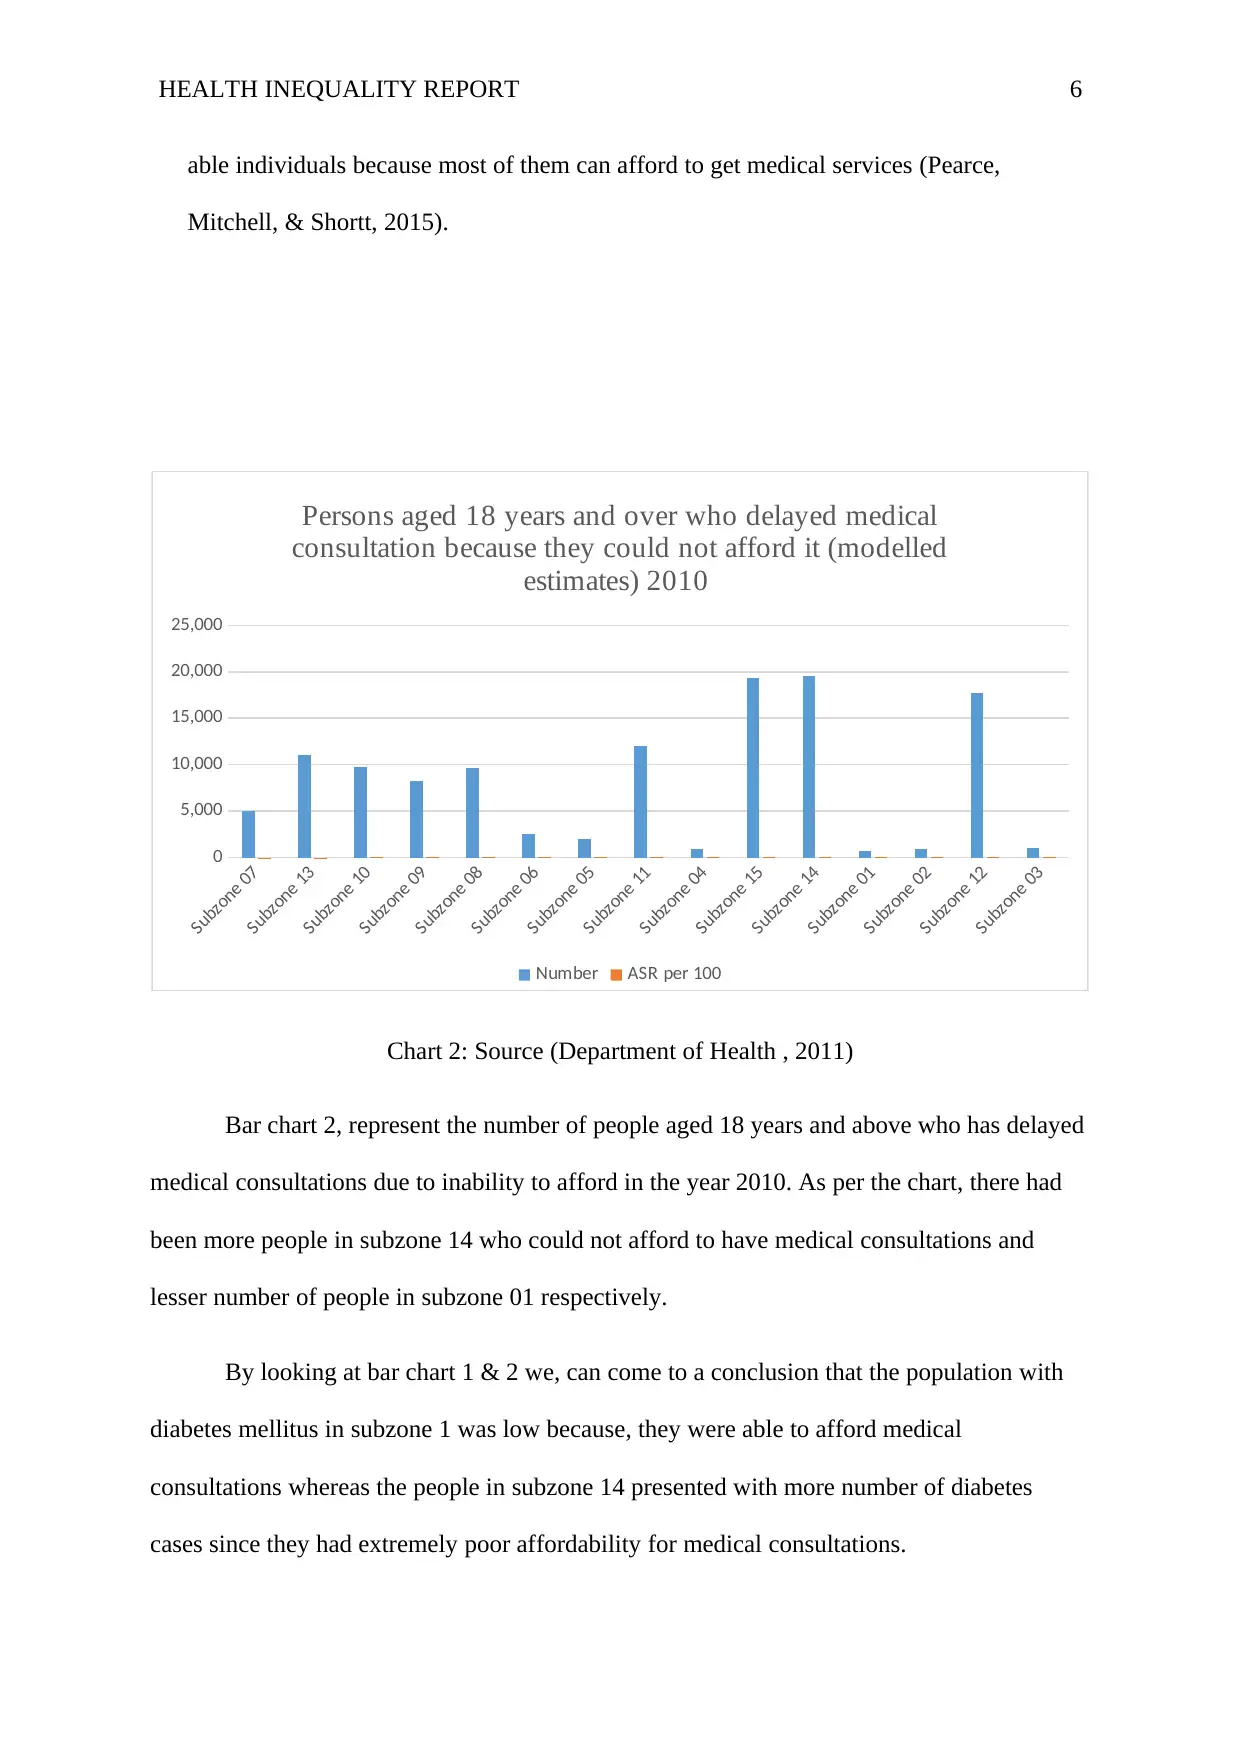
Chart 3: Source (Pearce, Mitchell, & Shortt, 2015)
As seen by the pie chart subzone 14 had the highest population delayed purchasing prescribed
medication for the reason that they could not afford medications unlike the population in
Subzone 1 where a lower population did not delay buying prescribed medication and had
more affordability when compared with subzone 14 in the year 2010 (Pearce, Mitchell, &
Shortt, 2015). However, people in subzone 12 also showed the second highest population
with diabetes mellitus and had least affordability to medical consultations as well as had the
inability to purchase prescribed medication due to lack of affordability in 2010.
0
2,000
4,000
6,000
8,000
10,000
12,000
14,000
16,000
18,000
9,807
6,014
1,469
15,40814,959
7,540
2,048547
8,157
14,413
849 591
7,963
4,127
711
Persons aged 18 years and over who delayed purchasing
prescribed medication because they could not afford it
(modelled estimates) 2010
Number
Chart 3: Source (Pearce, Mitchell, & Shortt, 2015)
As seen by the pie chart subzone 14 had the highest population delayed purchasing prescribed
medication for the reason that they could not afford medications unlike the population in
Subzone 1 where a lower population did not delay buying prescribed medication and had
more affordability when compared with subzone 14 in the year 2010 (Pearce, Mitchell, &
Shortt, 2015). However, people in subzone 12 also showed the second highest population
with diabetes mellitus and had least affordability to medical consultations as well as had the
inability to purchase prescribed medication due to lack of affordability in 2010.
Paraphrase This Document
Need a fresh take? Get an instant paraphrase of this document with our AI Paraphraser
HEALTH INEQUALITY REPORT 8
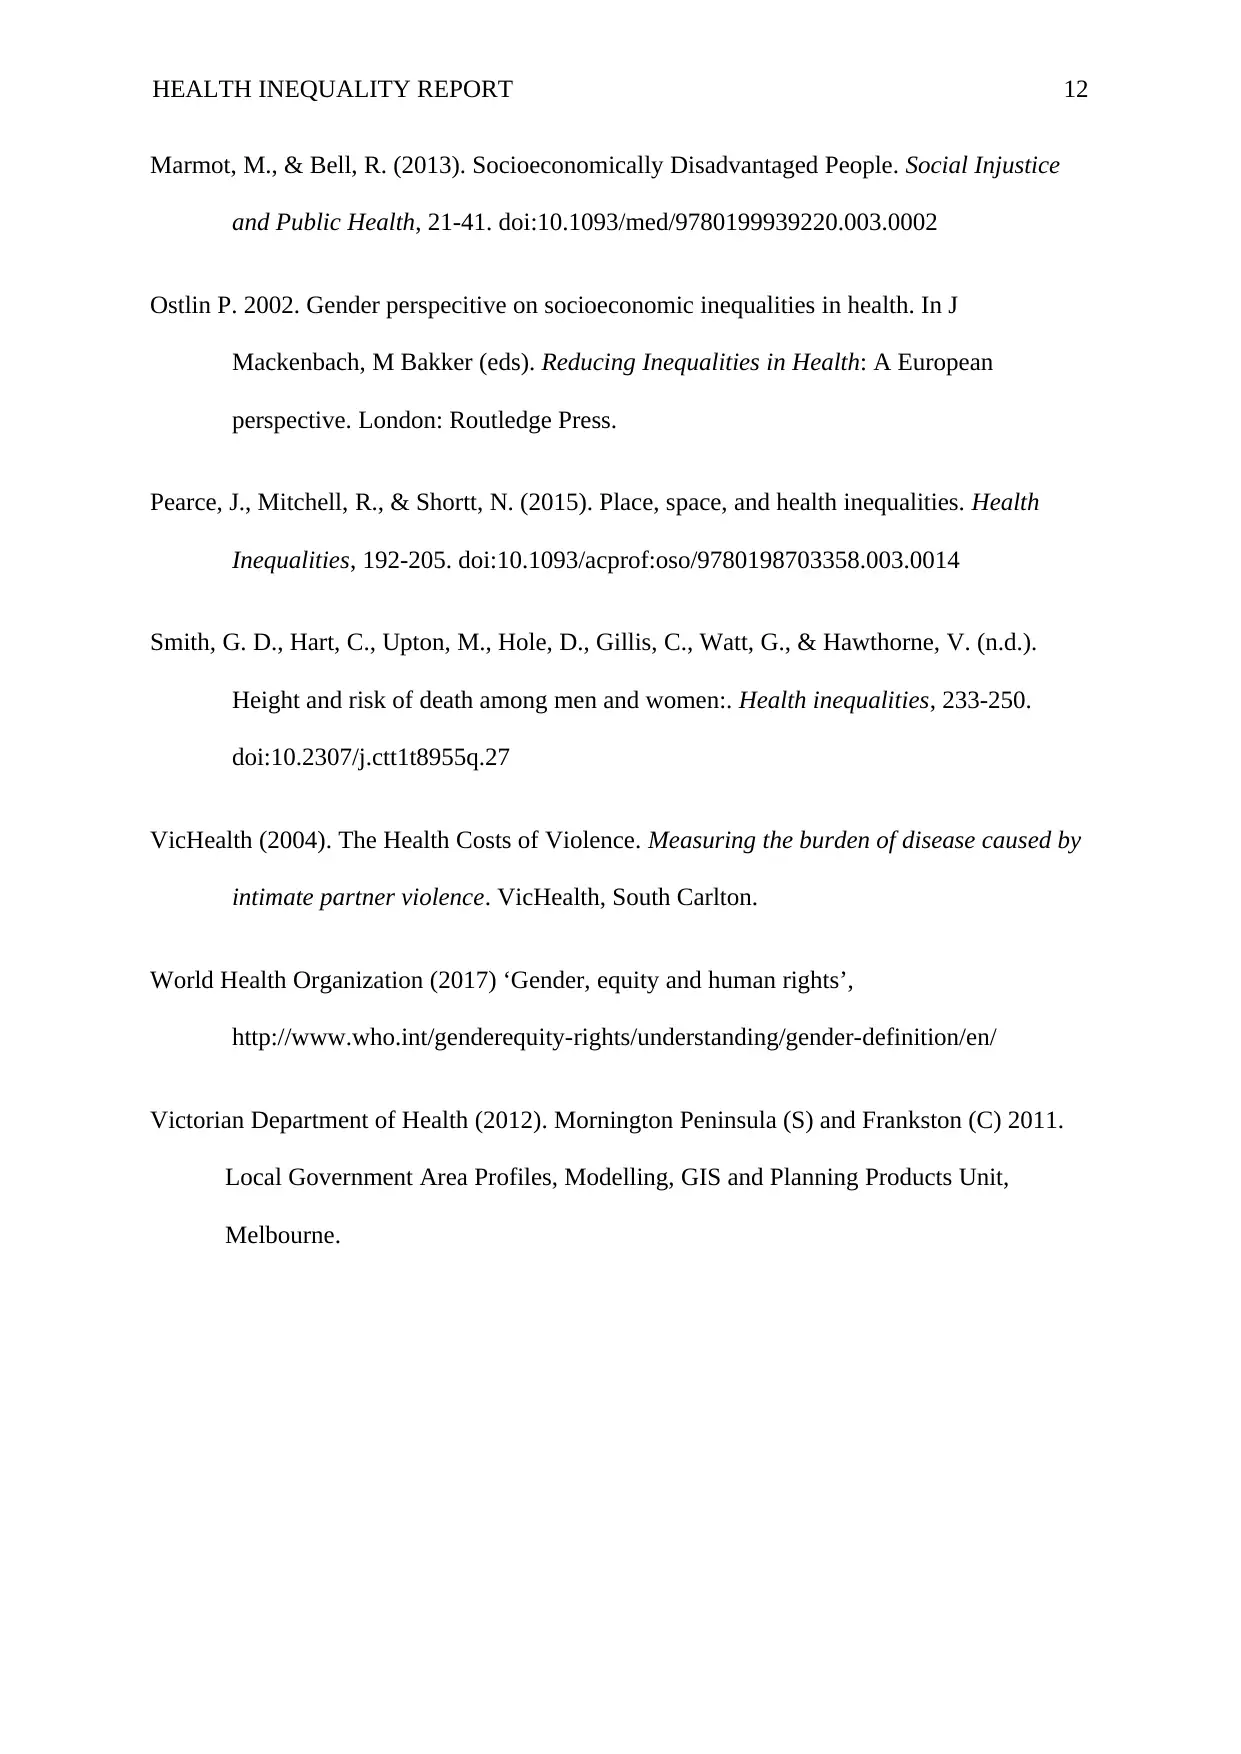
Subzone 11
Subzone 09
Subzone 05
Subzone 14
Subzone 12
Subzone 13
Subzone 06
Subzone 01
Subzone 10
Subzone 15
Subzone 03
Subzone 04
Subzone 08
Subzone 07
Subzone 02
0
5,000
10,000
15,000
20,000
25,000
30,000
35,000
Persons aged 18 years and over who had
difficulty accessing services 2010
Chart 4: Source (Pearce, Mitchell, & Shortt, 2015)
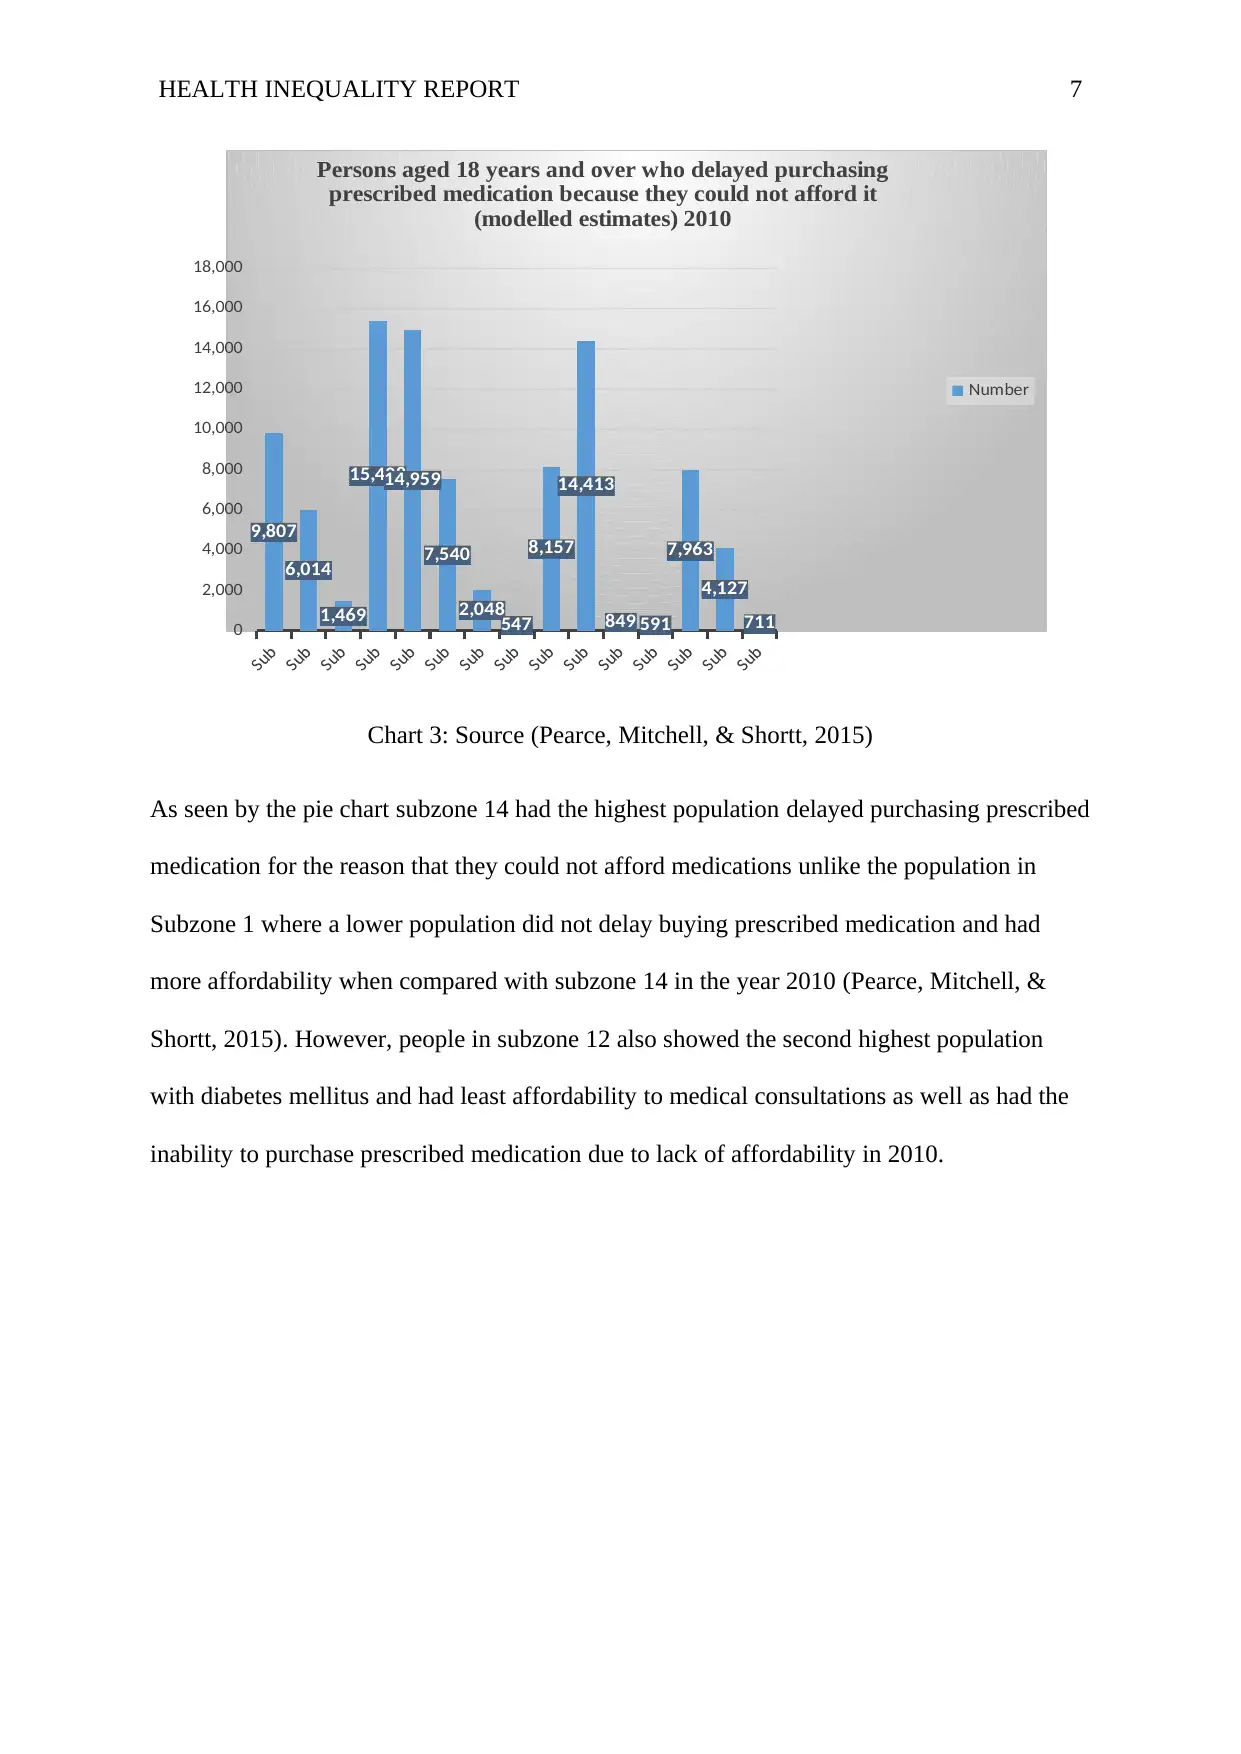
As can be seen in the charts, subzones 14 and 15 have the largest shortages in medical
facilities hence the difficulty for subjects to find services. This difficulty in access could
otherwise be caused by high costs to receive these services. This is the complete opposite of
subzones 1, 2, 3 and 4 which have very few reports of lack of access to services, meaning that
there are adequate facilities as well as an employed and well off demographic which can
afford to pay for services (Smith, Upton, Gillis, & Hawthorne, n.d). Steps should be taken to
level out this huge disparity so that there is equality in services received and statistical data
concerning this subject can be collectively analysed on a level playing ground. This graph
alone can indicate to higher life expectancy in some subsets than others, and probably higher
child mortality rates.
3. Lifestyle inequalities. This includes alcohol consumption, smoking, dietary
recommendations and physical activity. From the research, it could be seen that
prevalence for smoking is higher in males than it is in females. The percentage of
individuals who smoke where higher in the metropolitan areas of Victoria. It is also worth
noting that the percentage of ex-smokers was significantly larger than the percentage of
Subzone 11
Subzone 09
Subzone 05
Subzone 14
Subzone 12
Subzone 13
Subzone 06
Subzone 01
Subzone 10
Subzone 15
Subzone 03
Subzone 04
Subzone 08
Subzone 07
Subzone 02
0
5,000
10,000
15,000
20,000
25,000
30,000
35,000
Persons aged 18 years and over who had
difficulty accessing services 2010
Chart 4: Source (Pearce, Mitchell, & Shortt, 2015)
As can be seen in the charts, subzones 14 and 15 have the largest shortages in medical
facilities hence the difficulty for subjects to find services. This difficulty in access could
otherwise be caused by high costs to receive these services. This is the complete opposite of
subzones 1, 2, 3 and 4 which have very few reports of lack of access to services, meaning that
there are adequate facilities as well as an employed and well off demographic which can
afford to pay for services (Smith, Upton, Gillis, & Hawthorne, n.d). Steps should be taken to
level out this huge disparity so that there is equality in services received and statistical data
concerning this subject can be collectively analysed on a level playing ground. This graph
alone can indicate to higher life expectancy in some subsets than others, and probably higher
child mortality rates.
3. Lifestyle inequalities. This includes alcohol consumption, smoking, dietary
recommendations and physical activity. From the research, it could be seen that
prevalence for smoking is higher in males than it is in females. The percentage of
individuals who smoke where higher in the metropolitan areas of Victoria. It is also worth
noting that the percentage of ex-smokers was significantly larger than the percentage of
HEALTH INEQUALITY REPORT 9
current smokers. More adults between 18-24 were smokers than those adults between the
age of 65-85. Most adults at these ages have quit smoking (Smith, Upton, Gillis, &
Hawthorne, n.d). The proportion of current smokers decreased in proportion with increase
in household income. Most smokers were identified to be individuals who did not
complete high school, are not employed and have a household income of less than 40000
dollars.
4. Geographical location. Rural people had a higher percentage of obese people than their
urban counterparts. Individuals born overseas were more underweight and normal weight.
Type 2 diabetes was notably more prevalent in metropolitan areas, though Australian
born individuals had a notably lower percentage of diabetes incidences than those born
abroad (World Health Organization , 2017).
Screening should be done to discover diseases like bowel and breast cancer. The study
done showed that about 63.9% of adults went for bowel screening and 72% of the women
went for a mammogram in the year 2012/2013. A higher proportion of rural dwelling
people had been screened than metropolitan dwellers. Rural regions generally reported
better health than metropolitan areas.
This inequality is also an inequity because rural areas evidently seem to have better
conditions for health. The fruits and vegetables which should be maintained in the diet are
likely available more easily.
The subzones 1 to 6 are rural areas as can be seen by the ease to access to medical
services. Rural facilities rarely have the kind of demand and traffic that urban facilities
experience (World Health Organization , 2017). This can also explain why more rural
people have undergone cancer screening than town dwellers, and that they self-report
themselves as healthier. Subzones 7 to 14 are shown to provide poor services and are
⊘ This is a preview!⊘
Do you want full access?
Subscribe today to unlock all pages.
Trusted by 1+ million students worldwide
HEALTH INEQUALITY REPORT 10
likely to be swamped by patients because urban dwellers sit most of the day and could
possibly have back problems; work for long hours and consume more alcohol than their
rural counterparts and therefore can develop alcohol related complications.
likely to be swamped by patients because urban dwellers sit most of the day and could
possibly have back problems; work for long hours and consume more alcohol than their
rural counterparts and therefore can develop alcohol related complications.
Paraphrase This Document
Need a fresh take? Get an instant paraphrase of this document with our AI Paraphraser
HEALTH INEQUALITY REPORT 11
References
Australian Bureau of Statistics (2011). 3218.0 Regional Population Growth (2001-2010),
Australia.
Davey-Smith G, Hart C, Montgomery S. (1997). Lifetime Socioeconomic Position and
Mortality.Prospective Observational Epidemiology. British Medical Journal 314:
547–52.
Department of Health (2011). The health and wellbeing of Aboriginal Victorians: Victorian
Population Health Survey 2008 Supplementary report, State Government of Victoria,
Melbourne.
Graham, H. (2002) ‘Tackling inequalities in health in England: remedying disadvantage,
narrowing gaps or reducing gradients?’ Internal discussion paper. Health
Development Agency, London.
HFA. (2000). Striking a Better Balance: A Health Funding Authority response to reducing
inequalities in health. Wellington: Health Funding Authority.
HM Treasury (2002) The Cross Cutting Review on Health Inequalities. Summary Report.
HM Treasury, London.
Jelfs, P. (2016). The Australian Bureau of Statistics’ Aboriginal and Torres Strait Islander
enumeration and engagement strategies: challenges and future options. Indigenous
Data Sovereignty. doi:10.22459/caepr38.11.2016.15
Kristenson, M. (2006). Socio-economic position and health. Social Inequalities in Health,
127-152. doi:10.1093/acprof:oso/9780198568162.003.0006
HEALTH INEQUALITY REPORT 12
Marmot, M., & Bell, R. (2013). Socioeconomically Disadvantaged People. Social Injustice
and Public Health, 21-41. doi:10.1093/med/9780199939220.003.0002
Ostlin P. 2002. Gender perspecitive on socioeconomic inequalities in health. In J
Mackenbach, M Bakker (eds). Reducing Inequalities in Health: A European
perspective. London: Routledge Press.
Pearce, J., Mitchell, R., & Shortt, N. (2015). Place, space, and health inequalities. Health
Inequalities, 192-205. doi:10.1093/acprof:oso/9780198703358.003.0014
Smith, G. D., Hart, C., Upton, M., Hole, D., Gillis, C., Watt, G., & Hawthorne, V. (n.d.).
Height and risk of death among men and women:. Health inequalities, 233-250.
doi:10.2307/j.ctt1t8955q.27
VicHealth (2004). The Health Costs of Violence. Measuring the burden of disease caused by
intimate partner violence. VicHealth, South Carlton.
World Health Organization (2017) ‘Gender, equity and human rights’,
http://www.who.int/genderequity-rights/understanding/gender-definition/en/
Victorian Department of Health (2012). Mornington Peninsula (S) and Frankston (C) 2011.
Local Government Area Profiles, Modelling, GIS and Planning Products Unit,
Melbourne.
⊘ This is a preview!⊘
Do you want full access?
Subscribe today to unlock all pages.
Trusted by 1+ million students worldwide
1 out of 12
Related Documents


Your All-in-One AI-Powered Toolkit for Academic Success.
+13062052269
info@desklib.com
Available 24*7 on WhatsApp / Email
![[object Object]](/_next/static/media/star-bottom.7253800d.svg)
Unlock your academic potential
Copyright © 2020–2026 A2Z Services. All Rights Reserved. Developed and managed by ZUCOL.