Financial Statement Analysis: Health Scope Ltd
VerifiedAdded on 2019/11/25
|12
|2718
|166
Report
AI Summary
This report analyzes the financial statements of Health Scope Limited, an Australian company listed on the Australian Stock Exchange. The analysis covers profitability, net worth, and cash flows over several years, utilizing financial and accounting ratios. The report includes trend analysis, liquidity ratios, profitability ratios, long-term solvency ratios, and cash flow adequacy ratios. It examines the company's revenue, operating income, net income, assets, liabilities, and equity. The analysis also considers the industry outlook and Health Scope's future plans, including strategic projects and divestments. The conclusion summarizes the company's financial health and offers recommendations based on the findings.

STUDY OF FINANCIAL STATEMENT OF HEALTH SCOPE LIMITED
9/10/2017
9/10/2017
Paraphrase This Document
Need a fresh take? Get an instant paraphrase of this document with our AI Paraphraser
EXECUTIVE SUMMARY
The subject of the study is analysis of Financial Statement of Health Scope Limited. The
company is registered company in Australia and is listed in the Australian Stock Exchange. As
the title suggests, the main aim of the report is to study the financial health of the company in
terms of profitability and the net worth for the earlier years. The same analysis has been done in
the study through the annual report of the company for the different years including the audited
financial statements of the company. Other aim is to further study the financial statements with
the help of the accounting and financial ratios. With these aims, the report has been divided into
different sections and headings.
Contents
FINANCIAL STATEMENT AND RATIO ANALYSIS OF HEALTH SCOPE LIMITED................................................1
EXECUTIVE SUMMARY.................................................................................................................................2
INTRODUCTION...........................................................................................................................................4
INDUSTRY SITUATION AND PLANS OF COMPANY........................................................................................4
INDUSTRY OUTLOOK...............................................................................................................................4
COMPANY’S FUTURE PLANS....................................................................................................................5
ANALYSIS OF FINANCIAL STATEMENTS........................................................................................................5
STATEMENT OF FINANCIAL PERFORMANCE............................................................................................6
STATEMENT OF FINANCIAL POSITION.....................................................................................................7
STATEMENT OF CASH FLOWS..................................................................................................................8
RATIO ANAYSIS............................................................................................................................................8
CONCLUSION.............................................................................................................................................11
REFERENCES..............................................................................................................................................11
⊘ This is a preview!⊘
Do you want full access?
Subscribe today to unlock all pages.
Trusted by 1+ million students worldwide
INTRODUCTION
The company that has been considered in the study is Health Scope Limited. The company is
operating the hospitals, pathology labs and medical centre throughout the World. It has been
incorporated in the year of nineteen hundred and eighty five and since then the company has the
remarkable history in the medical industry Company also have the clinics for mental patients and
have rehabilitation centre. Gordon Ballantyne is the current Chief Executive Officer of the
company appointed on the 15th day of May, 2017 and has succeeded Robert Cooke. The home
office of the company is located at Level1, 312 Street Kilda Road Melbourne Australia, and VIC
3001. The company working offices is located at Australia, New Zealand, Singapore, Vietnam
and Malaysia. The main geographic location is Australia and New Zealand. The company has
prepared the financial statements for the year ending on 30th of June 2016. The books of accounts
of the company have been audited by Deloitte Touche Tohmatsu by giving the authentication
through the audit partner of the audit firm - T Imbesi. In the auditor report it has been mentioned
that the financial statements have been prepared and presented as per the rules and regulations of
the Corporations Act 2001. The auditor has further stated that the company has complied with
the Australian Accounting Standards and the other accounting Standards. The third statement
that the auditors have made is that the financial statement of the company represents the clear
and fair picture of the working position as on 30th of June 2016 and working performance for the
year ended on that date (Company Official Website, 2017). The market price of company stock
as on 8th of September 2017 is 1.64 AUD and dividend per share is 0.0700 AUD (SMH Official
Website, (2017). The analysis has been made further with the help of financial report and
financial ratios.
INDUSTRY SITUATION AND PLANS OF COMPANY
The company is working under the health care equipment and service industry and in this
heading, the situation of the industry has been discussed and the plans of the company for the
future growth of the company have been detailed.
Paraphrase This Document
Need a fresh take? Get an instant paraphrase of this document with our AI Paraphraser
INDUSTRY OUTLOOK
Health Care Industry in Australia has been valued at sixth rank among the different countries
across the globe. Australia has very strong system of health care providing value added facilities
at each stage but at the same time the company is facing the situation of extreme pressure. The
pressure is in the form of financial terms in the face of the heavy expenditure which has led the
wiping out of the economy of the country. The similar challenges are being faced by the health
care industry of different countries which have strong health care system. An industry which is
planning to have the economic growth shall include the exports of the products or services as the
major segment of the business and the introduction of the foreign investment and more
importantly the privatization of the different sectors. It will add towards the enhancement of the
economy of the country in the positive direction (Bartlet, 2016). The same objective of
expansion is the today’s necessity in the concerned industry.
COMPANY’S FUTURE PLANS
One of the strategic actions of the company is to complete the seven projects which are in
pipeline by the end of the financial year ending 2019. These projects are in New South Wales,
Queensland and Victoria. Second strategic action is to have the delivering performance of the
forty five hospitals operating as on date. The company has forecasted that the company will do
other projects in the future in alignment with the Government of NSW. Currently the company is
working on the project of the hospital at the Northern Beaches under the public private
partnership with the Government of NSW with 450 bed facilities and will be marked as the first
and foremost major investment in the northern beaches. Another strategic action that the
company will take in the next year is to sell or dispose off or divest the operations of the medical
centre only. It is because of the non performance of the said segment and the company has even
decided to sell out its operation for AUD50 million to Fullerton Health Care PTY Limited which
is subject to the forecast and the certain adjustments. This will make the company to emphasize
on the major area which is Hospitals (Company Official Website, 2017)
FINANCIAL PERFORMANCE AND POSITION
The financial statements consist of the Balance sheet and profit and loss statement. The former
tells about the financial health of the company as on that date and the latter tells about the
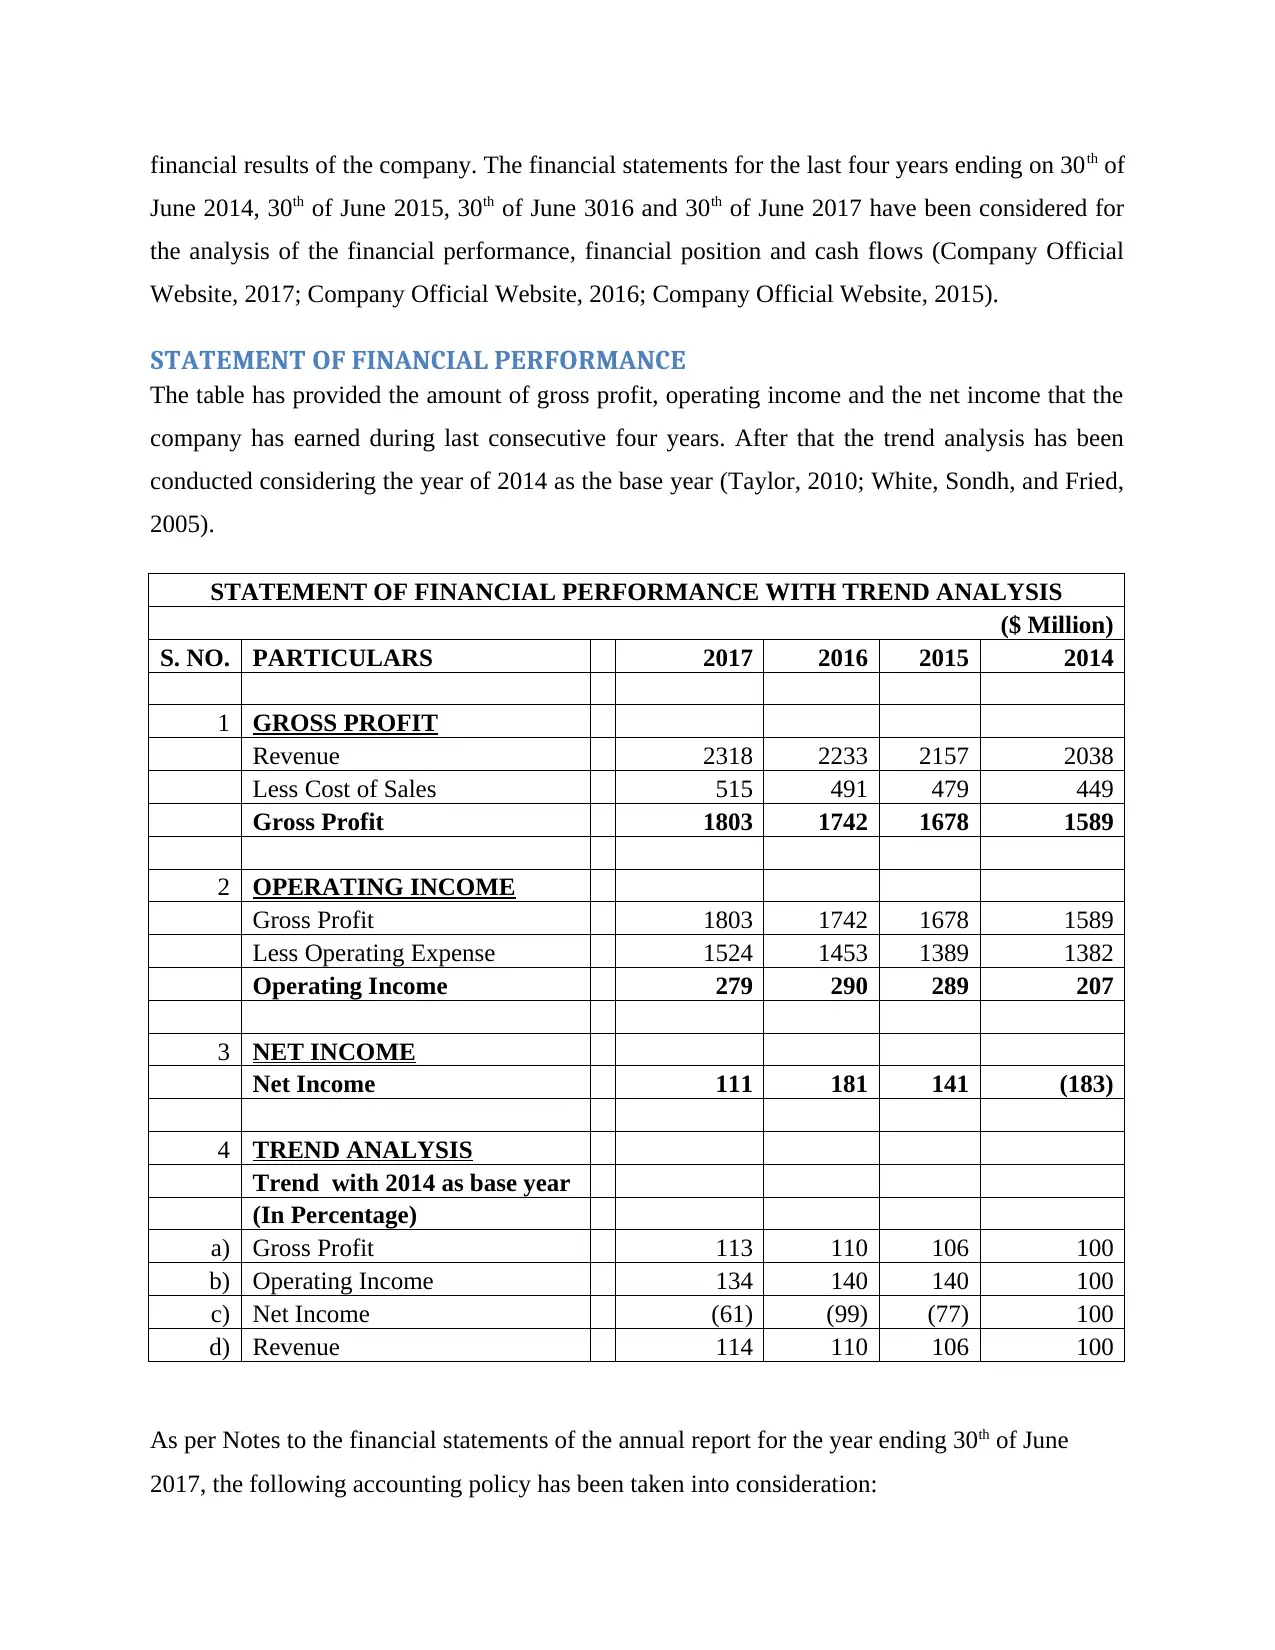
financial results of the company. The financial statements for the last four years ending on 30th of
June 2014, 30th of June 2015, 30th of June 3016 and 30th of June 2017 have been considered for
the analysis of the financial performance, financial position and cash flows (Company Official
Website, 2017; Company Official Website, 2016; Company Official Website, 2015).
STATEMENT OF FINANCIAL PERFORMANCE
The table has provided the amount of gross profit, operating income and the net income that the
company has earned during last consecutive four years. After that the trend analysis has been
conducted considering the year of 2014 as the base year (Taylor, 2010; White, Sondh, and Fried,
2005).
STATEMENT OF FINANCIAL PERFORMANCE WITH TREND ANALYSIS
($ Million)
S. NO. PARTICULARS 2017 2016 2015 2014
1 GROSS PROFIT
Revenue 2318 2233 2157 2038
Less Cost of Sales 515 491 479 449
Gross Profit 1803 1742 1678 1589
2 OPERATING INCOME
Gross Profit 1803 1742 1678 1589
Less Operating Expense 1524 1453 1389 1382
Operating Income 279 290 289 207
3 NET INCOME
Net Income 111 181 141 (183)
4 TREND ANALYSIS
Trend with 2014 as base year
(In Percentage)
a) Gross Profit 113 110 106 100
b) Operating Income 134 140 140 100
c) Net Income (61) (99) (77) 100
d) Revenue 114 110 106 100
As per Notes to the financial statements of the annual report for the year ending 30th of June
2017, the following accounting policy has been taken into consideration:
⊘ This is a preview!⊘
Do you want full access?
Subscribe today to unlock all pages.
Trusted by 1+ million students worldwide
a) Revenue - Revenue has been recognized at the fair value of the amount received from the
patient and is recognized on the date it is provided to the patient. It has been mentioned
that the applicability of AASB 15 – Revenue from Contracts with customers and AASB
16 – Leases will be checked and applied for the year ending 30th of June 2019 and 2020
respectively.
b) Operating Lease – The lease payments are recognized over the term of the lease on the
straight line basis. The company has not assumed any type of risk associated with the
assets so leased.
As per the current market situation, the health care equipment industry has been in upward trend
by 7.57% but the company has been receiving the negative trend from the last two year.
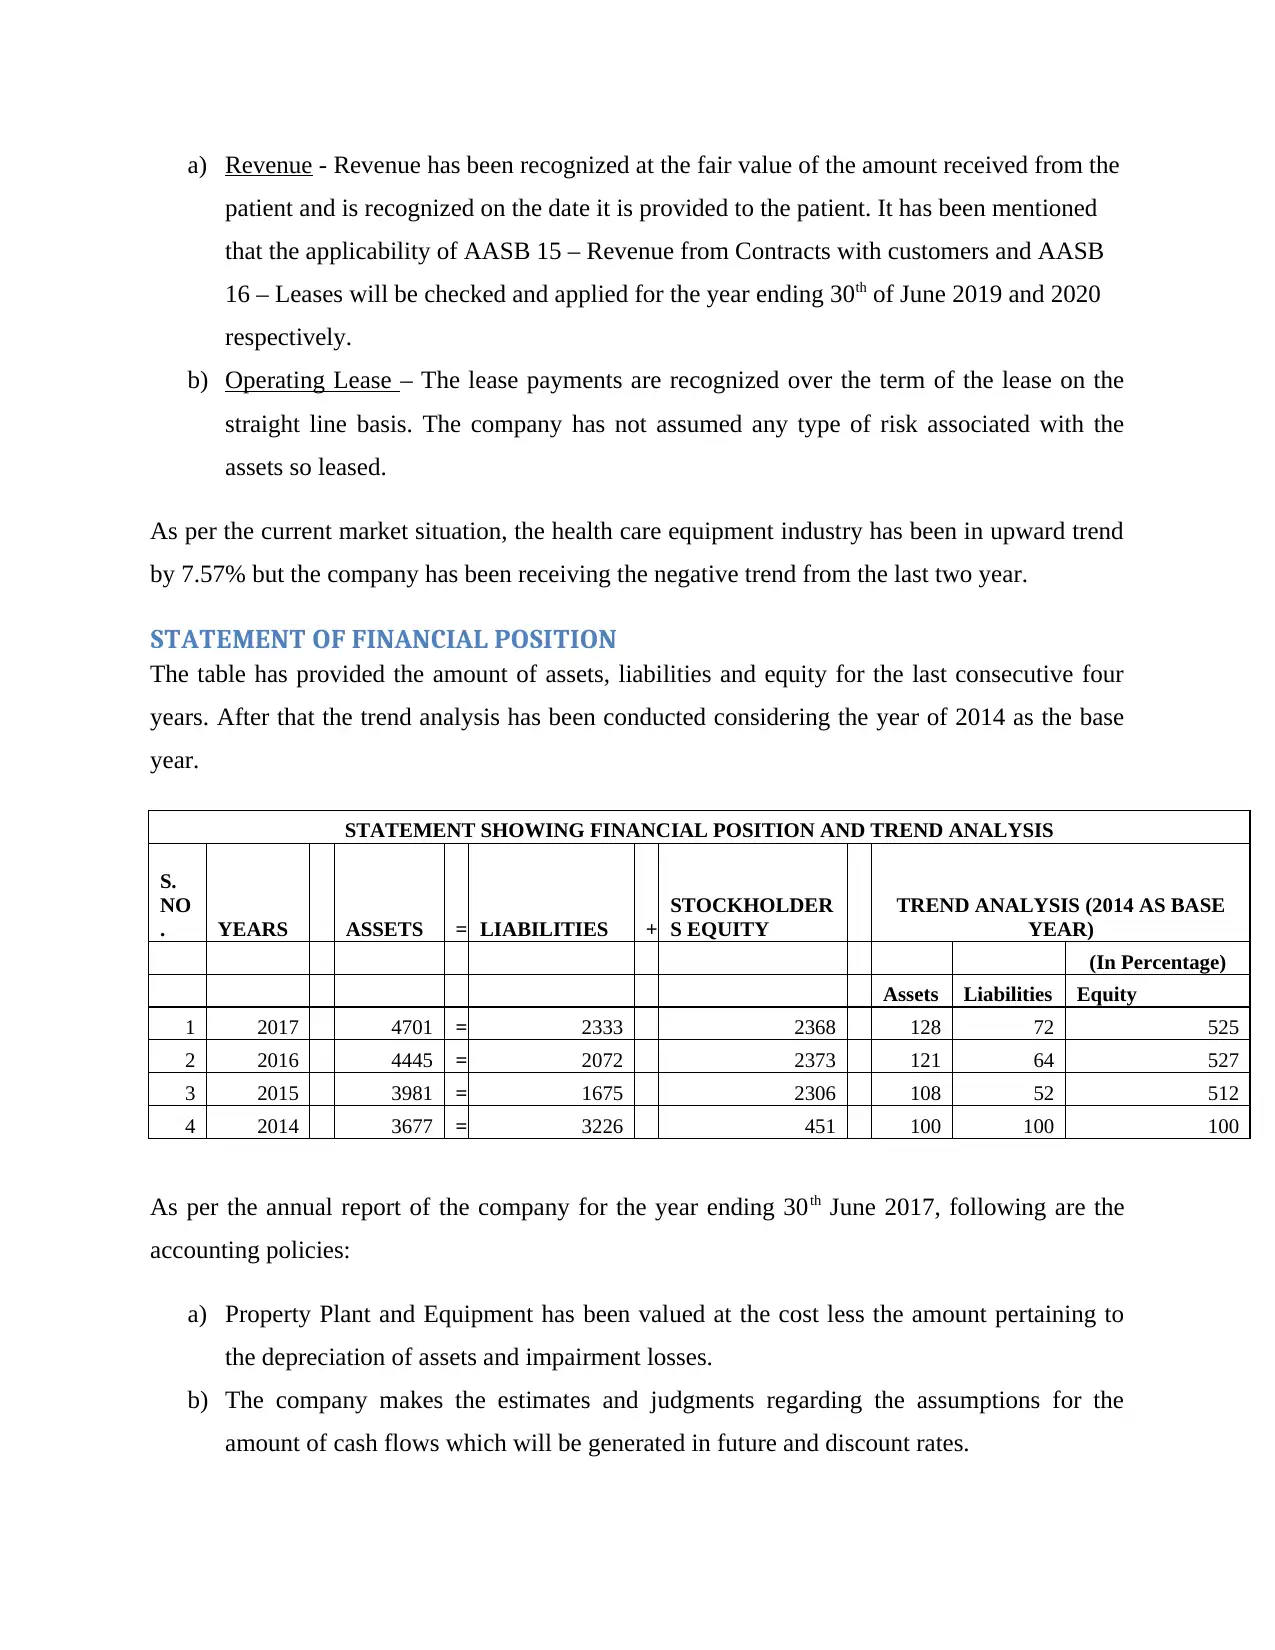
STATEMENT OF FINANCIAL POSITION
The table has provided the amount of assets, liabilities and equity for the last consecutive four
years. After that the trend analysis has been conducted considering the year of 2014 as the base
year.
STATEMENT SHOWING FINANCIAL POSITION AND TREND ANALYSIS
S.
NO
. YEARS ASSETS = LIABILITIES +
STOCKHOLDER
S EQUITY
TREND ANALYSIS (2014 AS BASE
YEAR)
(In Percentage)
Assets Liabilities Equity
1 2017 4701 = 2333 2368 128 72 525
2 2016 4445 = 2072 2373 121 64 527
3 2015 3981 = 1675 2306 108 52 512
4 2014 3677 = 3226 451 100 100 100
As per the annual report of the company for the year ending 30th June 2017, following are the
accounting policies:
a) Property Plant and Equipment has been valued at the cost less the amount pertaining to
the depreciation of assets and impairment losses.
b) The company makes the estimates and judgments regarding the assumptions for the
amount of cash flows which will be generated in future and discount rates.
patient and is recognized on the date it is provided to the patient. It has been mentioned
that the applicability of AASB 15 – Revenue from Contracts with customers and AASB
16 – Leases will be checked and applied for the year ending 30th of June 2019 and 2020
respectively.
b) Operating Lease – The lease payments are recognized over the term of the lease on the
straight line basis. The company has not assumed any type of risk associated with the
assets so leased.
As per the current market situation, the health care equipment industry has been in upward trend
by 7.57% but the company has been receiving the negative trend from the last two year.
STATEMENT OF FINANCIAL POSITION
The table has provided the amount of assets, liabilities and equity for the last consecutive four
years. After that the trend analysis has been conducted considering the year of 2014 as the base
year.
STATEMENT SHOWING FINANCIAL POSITION AND TREND ANALYSIS
S.
NO
. YEARS ASSETS = LIABILITIES +
STOCKHOLDER
S EQUITY
TREND ANALYSIS (2014 AS BASE
YEAR)
(In Percentage)
Assets Liabilities Equity
1 2017 4701 = 2333 2368 128 72 525
2 2016 4445 = 2072 2373 121 64 527
3 2015 3981 = 1675 2306 108 52 512
4 2014 3677 = 3226 451 100 100 100
As per the annual report of the company for the year ending 30th June 2017, following are the
accounting policies:
a) Property Plant and Equipment has been valued at the cost less the amount pertaining to
the depreciation of assets and impairment losses.
b) The company makes the estimates and judgments regarding the assumptions for the
amount of cash flows which will be generated in future and discount rates.
Paraphrase This Document
Need a fresh take? Get an instant paraphrase of this document with our AI Paraphraser
c) Goodwill is recognized at cost of acquisition less impairment. Other intangibles are
recognized at cost less depreciation if it has the finite lives otherwise at the cost less
impairment if any.
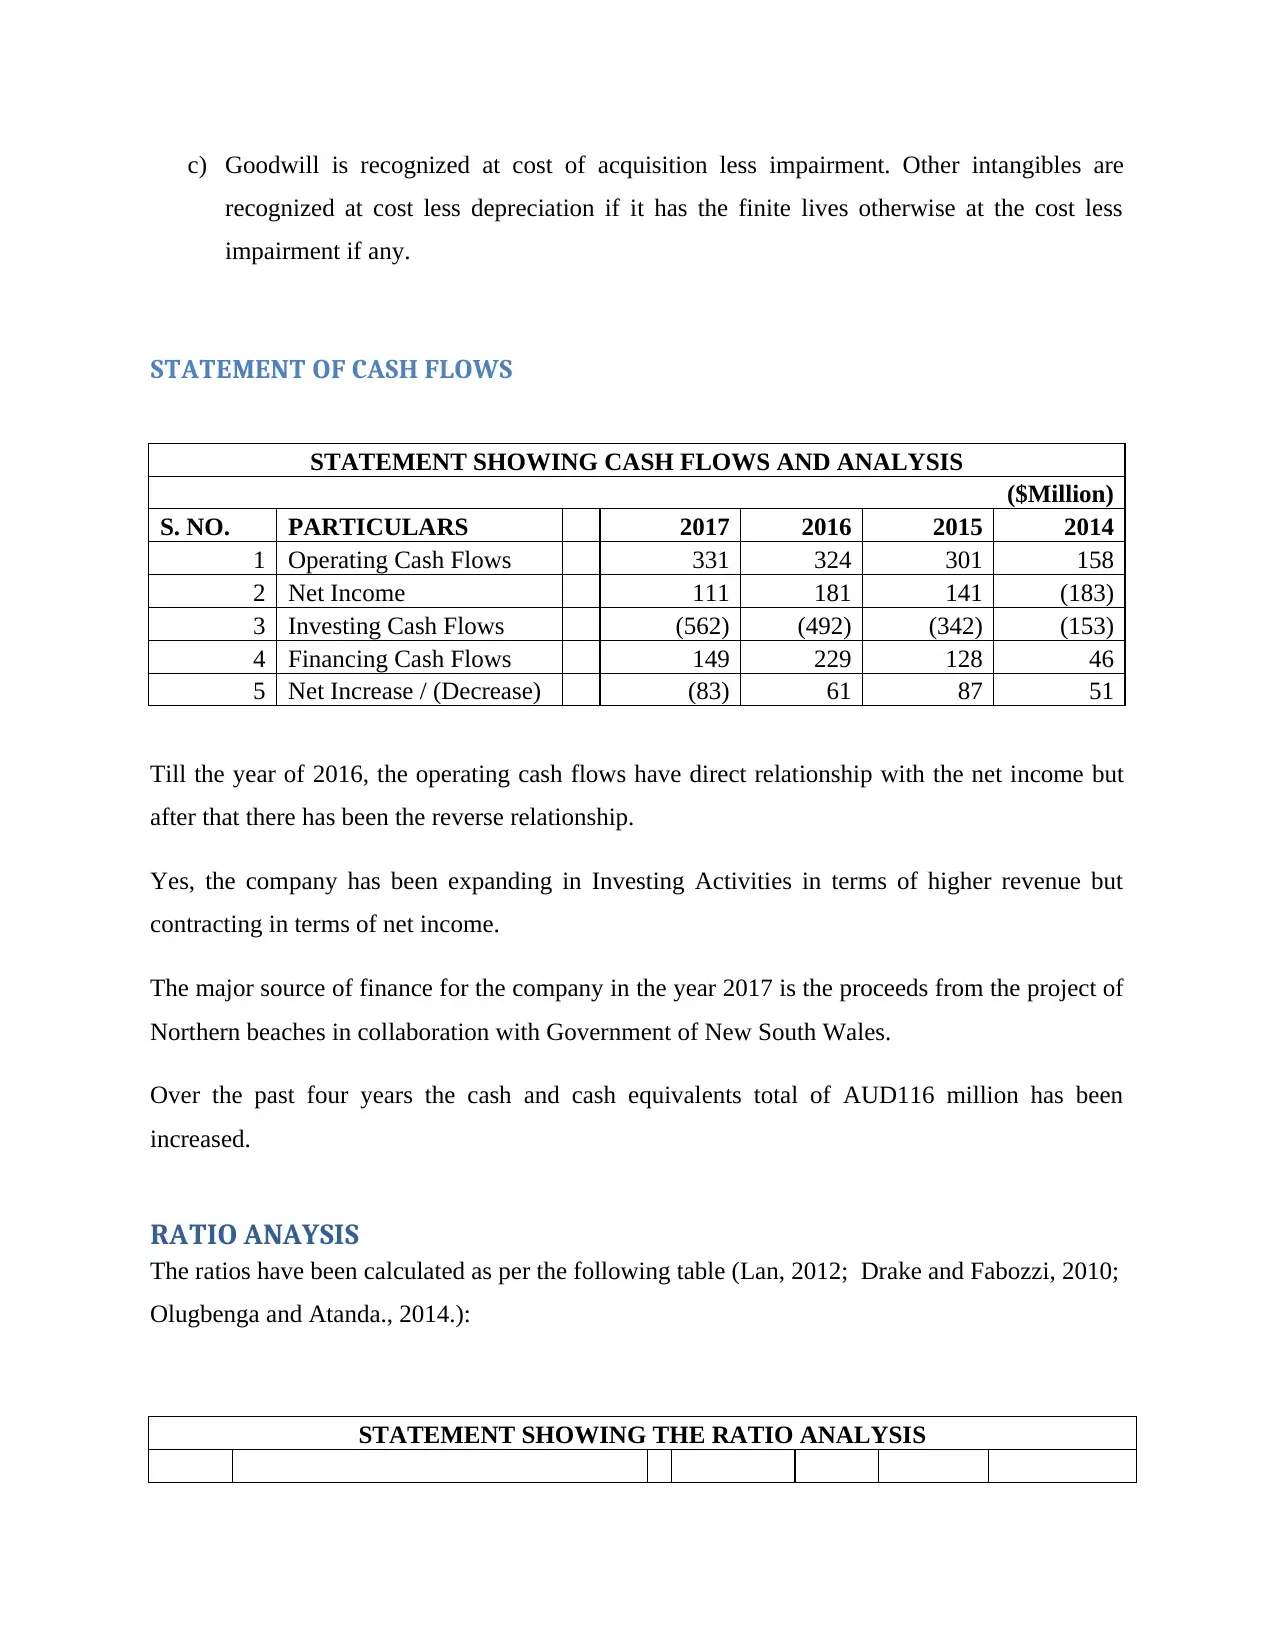
STATEMENT OF CASH FLOWS
STATEMENT SHOWING CASH FLOWS AND ANALYSIS
($Million)
S. NO. PARTICULARS 2017 2016 2015 2014
1 Operating Cash Flows 331 324 301 158
2 Net Income 111 181 141 (183)
3 Investing Cash Flows (562) (492) (342) (153)
4 Financing Cash Flows 149 229 128 46
5 Net Increase / (Decrease) (83) 61 87 51
Till the year of 2016, the operating cash flows have direct relationship with the net income but
after that there has been the reverse relationship.
Yes, the company has been expanding in Investing Activities in terms of higher revenue but
contracting in terms of net income.
The major source of finance for the company in the year 2017 is the proceeds from the project of
Northern beaches in collaboration with Government of New South Wales.
Over the past four years the cash and cash equivalents total of AUD116 million has been
increased.
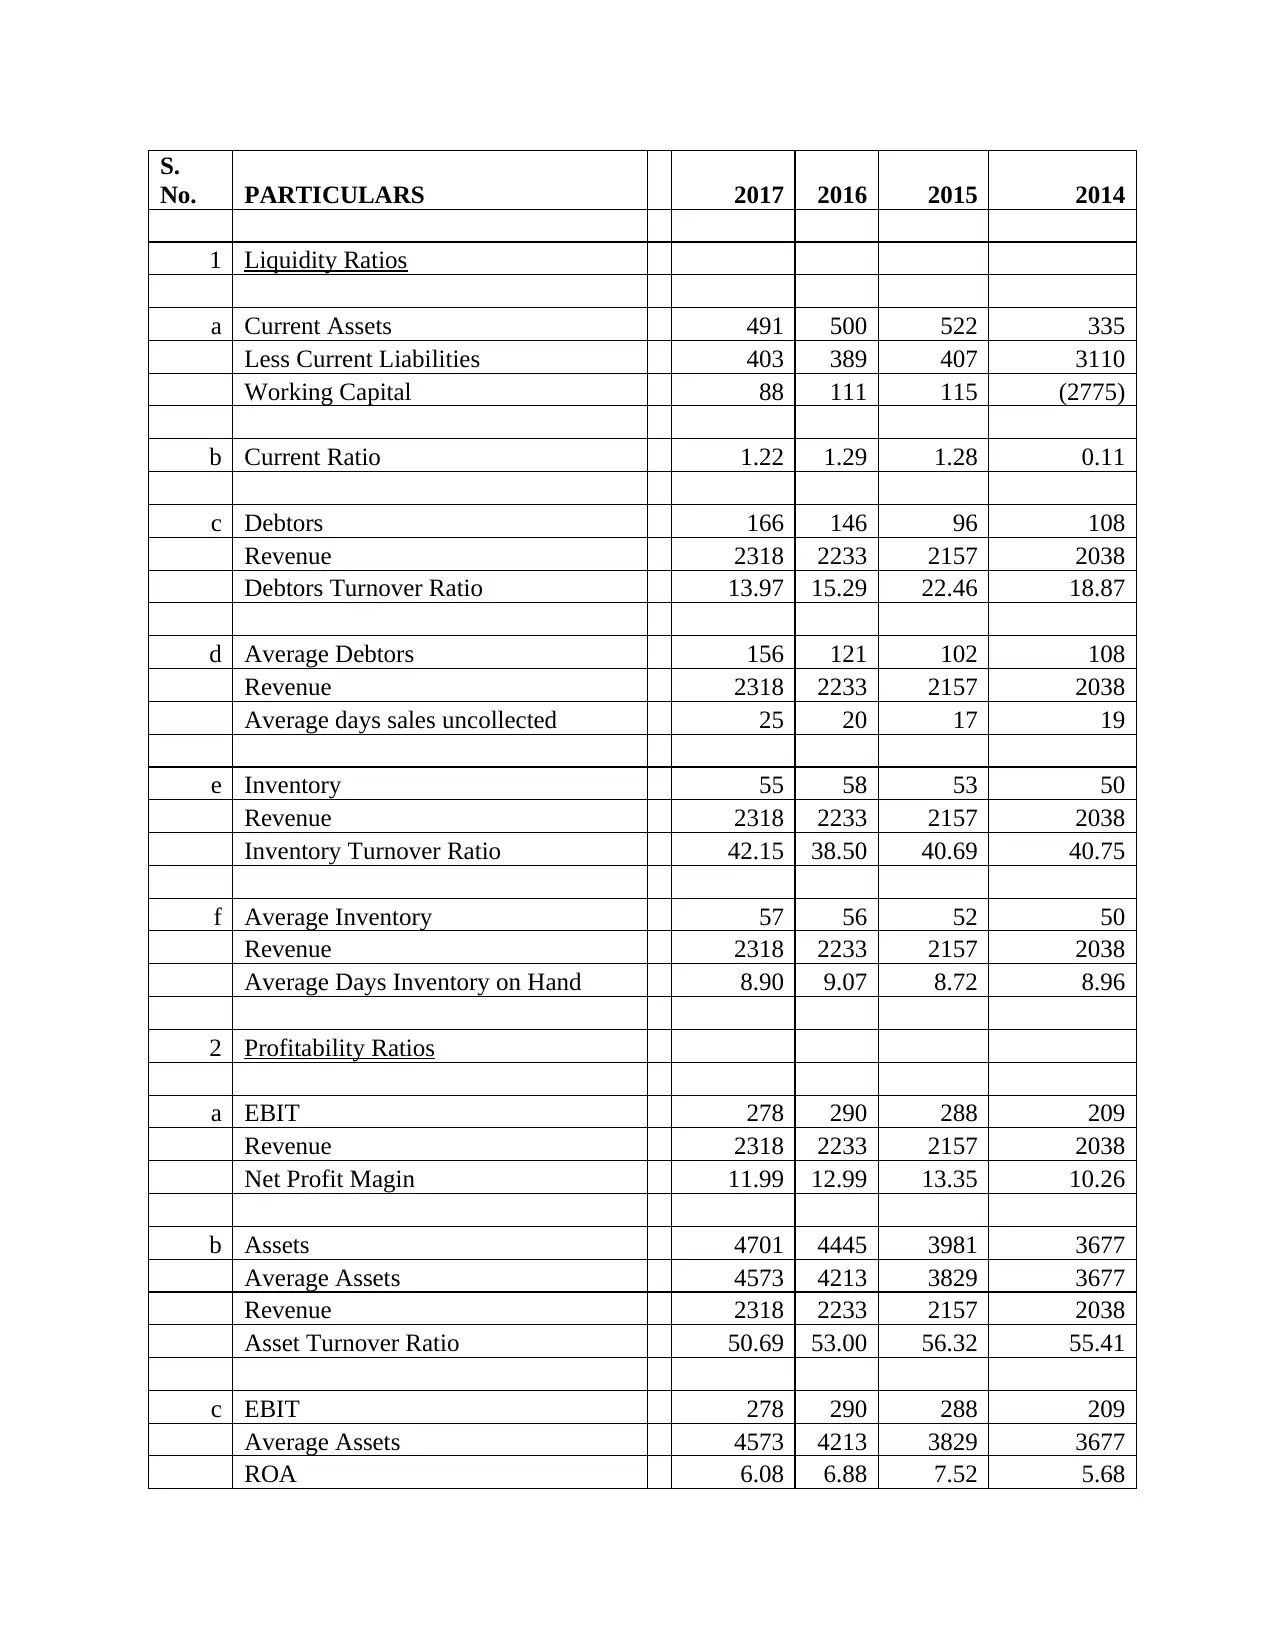
RATIO ANAYSIS
The ratios have been calculated as per the following table (Lan, 2012; Drake and Fabozzi, 2010;
Olugbenga and Atanda., 2014.):
STATEMENT SHOWING THE RATIO ANALYSIS
recognized at cost less depreciation if it has the finite lives otherwise at the cost less
impairment if any.
STATEMENT OF CASH FLOWS
STATEMENT SHOWING CASH FLOWS AND ANALYSIS
($Million)
S. NO. PARTICULARS 2017 2016 2015 2014
1 Operating Cash Flows 331 324 301 158
2 Net Income 111 181 141 (183)
3 Investing Cash Flows (562) (492) (342) (153)
4 Financing Cash Flows 149 229 128 46
5 Net Increase / (Decrease) (83) 61 87 51
Till the year of 2016, the operating cash flows have direct relationship with the net income but
after that there has been the reverse relationship.
Yes, the company has been expanding in Investing Activities in terms of higher revenue but
contracting in terms of net income.
The major source of finance for the company in the year 2017 is the proceeds from the project of
Northern beaches in collaboration with Government of New South Wales.
Over the past four years the cash and cash equivalents total of AUD116 million has been
increased.
RATIO ANAYSIS
The ratios have been calculated as per the following table (Lan, 2012; Drake and Fabozzi, 2010;
Olugbenga and Atanda., 2014.):
STATEMENT SHOWING THE RATIO ANALYSIS
S.
No. PARTICULARS 2017 2016 2015 2014
1 Liquidity Ratios
a Current Assets 491 500 522 335
Less Current Liabilities 403 389 407 3110
Working Capital 88 111 115 (2775)
b Current Ratio 1.22 1.29 1.28 0.11
c Debtors 166 146 96 108
Revenue 2318 2233 2157 2038
Debtors Turnover Ratio 13.97 15.29 22.46 18.87
d Average Debtors 156 121 102 108
Revenue 2318 2233 2157 2038
Average days sales uncollected 25 20 17 19
e Inventory 55 58 53 50
Revenue 2318 2233 2157 2038
Inventory Turnover Ratio 42.15 38.50 40.69 40.75
f Average Inventory 57 56 52 50
Revenue 2318 2233 2157 2038
Average Days Inventory on Hand 8.90 9.07 8.72 8.96
2 Profitability Ratios
a EBIT 278 290 288 209
Revenue 2318 2233 2157 2038
Net Profit Magin 11.99 12.99 13.35 10.26
b Assets 4701 4445 3981 3677
Average Assets 4573 4213 3829 3677
Revenue 2318 2233 2157 2038
Asset Turnover Ratio 50.69 53.00 56.32 55.41
c EBIT 278 290 288 209
Average Assets 4573 4213 3829 3677
ROA 6.08 6.88 7.52 5.68
⊘ This is a preview!⊘
Do you want full access?
Subscribe today to unlock all pages.
Trusted by 1+ million students worldwide
d PAT 111 181 141 (183)
Equity 2368 2373 2306 451
Average Equity 2371 2340 1379 451
ROE 4.68 7.74 10.22 (40.61)
3 Long Term Solvency Ratios
a Debt 2333 2072 1675 3226
Equity 2368 2373 2306 451
Debt to Equity 98.52 87.32 72.64 715.30
b EBIT 278 290 288 209
Interest 53 44 70 407
Interest Coverage Ratio 5.25 6.59 4.11 0.51
4 Cash Flow Adequacy Ratios
(Dechow, Richardson, and Sloan,
2008)
a Cash 196 279 218 138
Current Liabilities 403 389 407 3110
Cash Flow Yield 0.49 0.72 0.54 0.04
b Cash Flow from Operating Activities 331 324 301 158
Sales 2318 2233 2157 2038
Cash Flow to Sales 0.14 0.15 0.14 0.08
c Cash Flow 331 324 301 158
Assets 4701 4445 3981 3677
Cash Flow to Assets 0.07 0.07 0.08 0.04
5 Market Strength Ratios
a Earnings Per Share 6.4 10.4 8.6 (11)
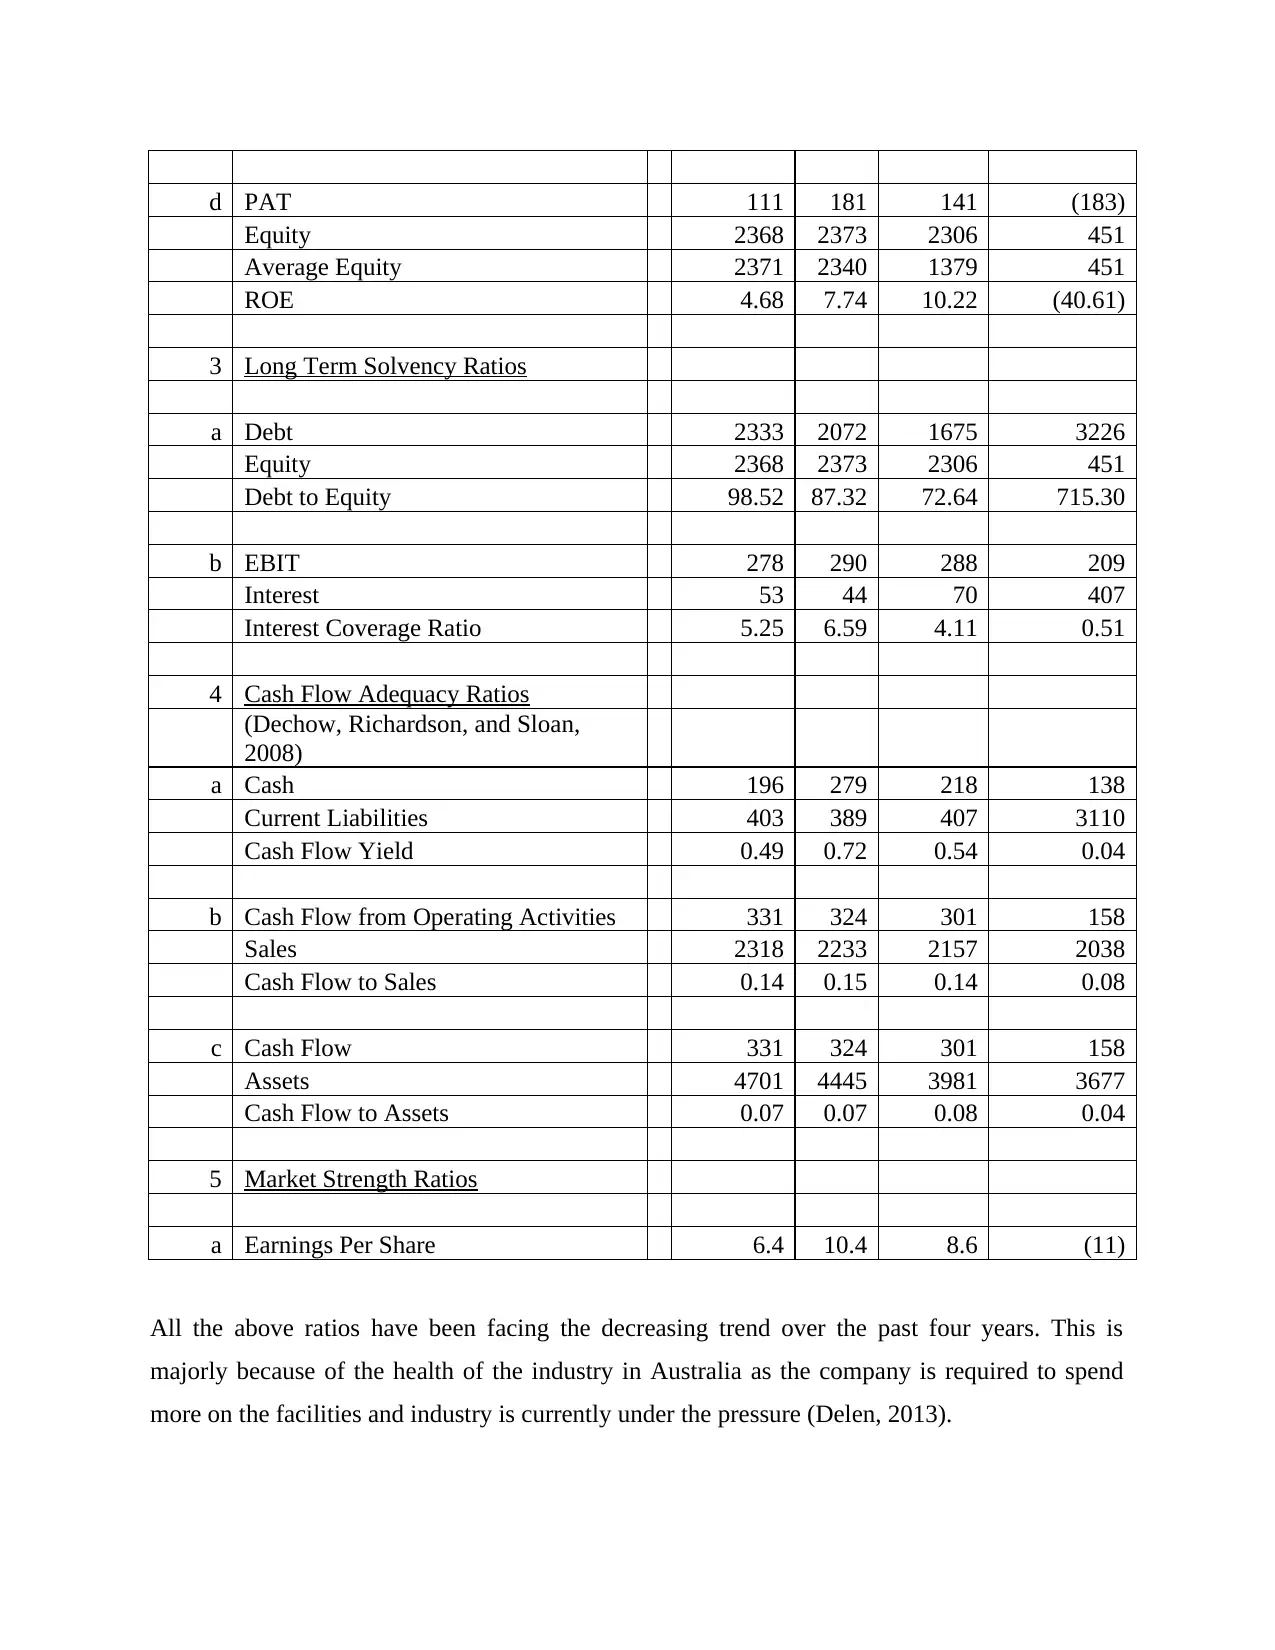
All the above ratios have been facing the decreasing trend over the past four years. This is
majorly because of the health of the industry in Australia as the company is required to spend
more on the facilities and industry is currently under the pressure (Delen, 2013).
Equity 2368 2373 2306 451
Average Equity 2371 2340 1379 451
ROE 4.68 7.74 10.22 (40.61)
3 Long Term Solvency Ratios
a Debt 2333 2072 1675 3226
Equity 2368 2373 2306 451
Debt to Equity 98.52 87.32 72.64 715.30
b EBIT 278 290 288 209
Interest 53 44 70 407
Interest Coverage Ratio 5.25 6.59 4.11 0.51
4 Cash Flow Adequacy Ratios
(Dechow, Richardson, and Sloan,
2008)
a Cash 196 279 218 138
Current Liabilities 403 389 407 3110
Cash Flow Yield 0.49 0.72 0.54 0.04
b Cash Flow from Operating Activities 331 324 301 158
Sales 2318 2233 2157 2038
Cash Flow to Sales 0.14 0.15 0.14 0.08
c Cash Flow 331 324 301 158
Assets 4701 4445 3981 3677
Cash Flow to Assets 0.07 0.07 0.08 0.04
5 Market Strength Ratios
a Earnings Per Share 6.4 10.4 8.6 (11)
All the above ratios have been facing the decreasing trend over the past four years. This is
majorly because of the health of the industry in Australia as the company is required to spend
more on the facilities and industry is currently under the pressure (Delen, 2013).
Paraphrase This Document
Need a fresh take? Get an instant paraphrase of this document with our AI Paraphraser
CONCLUSION
To conclude with the report, the company has been growing over the past five years and has been
in the wave of expansion of the company. The synergies have arisen in the revenue but the net
income has been decreasing year on year basis. It is recommended that the company shall take
care of its financial part seriously as the company will soon face the problem of liquidity if the
same situation prevails.
Based on the analysis, the company is the strong performer since its inception.
The reason for the above decision is based on the financial performance of the company in the
year 2014-15 as the company has overcome the loss of AUD183 million in 2014 to the profit of
AUD141 million in 2015.
REFERENCES
Bartlet C, (2016), “Australia’s Health Care System: An Opportunity for Economic Growth”
available at https://www.strategyand.pwc.com/reports/australias-healthcare-system accessed on
09/09/2017.
Company Official Website, (2015), “Annual Report 2015”, available at
http://www.healthscope.com.au accessed on 09/09/2017.
Company Official Website, (2016), “Annual Report 2016”, available at
http://www.healthscope.com.au accessed on 09/09/2017.
Company Official Website, (2017), “Annual Report 2017”, available at
http://www.healthscope.com.au accessed on 09/09/2017.
Dechow, P.M., Richardson, S.A. and Sloan, R.G., 2008. The persistence and pricing of the cash
component of earnings. Journal of Accounting Research, 46(3), pp.537-566.
Delen, D., 2013. Measuring firm performance using financial ratios: A decision tree
approach. Expert Systems with Applications, 40(10), pp.3970-3983.
Drake, P.P. and Fabozzi, F.J., 2010. Financial ratio analysis. Handbook of Finance.
Lan J, (2012), “16 Financial Ratios for Analyzing Company’s Strength and Weaknesses”
available at http://www.aaii.com/journal/article/16-financial-ratios-for-analyzing-a-companys-
strengths-and-weaknesses.touch accessed on 10/09/2017.
Olugbenga, A.A. and Atanda, O.A., 2014. Value relevance of financial accounting information
of quoted companies in Nigeria: A trend analysis. Research Journal of Finance and
Accounting, 5(8), pp.86-93.
SMH Official Website, (2017), “HSO – Health Scope Limited – Share Prices, Company News
and Announcements”, available at
http://www.smh.com.au/business/markets/quotes/dividends/HSO/healthscope-limited accessed
on 09/09/2017.
Taylor, M., 2010. Financial statement analysis.
White, G.L., Sondh, A.C. and Fried, D., 2005. Analysis of Financial Statement. Analysis.
⊘ This is a preview!⊘
Do you want full access?
Subscribe today to unlock all pages.
Trusted by 1+ million students worldwide
1 out of 12
Related Documents


Your All-in-One AI-Powered Toolkit for Academic Success.
+13062052269
info@desklib.com
Available 24*7 on WhatsApp / Email
![[object Object]](/_next/static/media/star-bottom.7253800d.svg)
Unlock your academic potential
Copyright © 2020–2026 A2Z Services. All Rights Reserved. Developed and managed by ZUCOL.