Health Workforce Planning: Comparative Analysis of Australia & Japan
VerifiedAdded on 2023/06/11
|23
|5784
|329
Report
AI Summary
This report presents a health workforce plan for Australia by comparing it with Japan, focusing on workforce planning as a means to achieve organizational objectives. It examines the current state of healthcare services in both countries, highlighting Japan's superior medical equipment and higher life expectancy rates. The report analyzes the roles of doctors, nurses, and other healthcare professionals, using WHO data to illustrate differences in healthcare service provision. Critical issues such as technical advancements and balancing the doctor-nurse ratio are discussed, alongside recommendations from WHO for policymakers to improve healthcare strategies. The findings reveal workforce statistics for both countries, including the number of doctors, nurses, and physiotherapists, and their socio-economic conditions. Graphs and charts are used to visually represent the data and facilitate comparisons.

Health workforce assignment
1
1
Paraphrase This Document
Need a fresh take? Get an instant paraphrase of this document with our AI Paraphraser
Executive summary
The current paper has shed light on the health workforce plan that is considered in Australian
context. Comparison and analysis of health system of the country with another country like
Japan have explained necessary actions that needs to be considered in this plan. Environmental
scan has also been done to evaluate the involvement of health care practitioners along with cost
of health care services that are visible in both countries. This paper has been reflective on the
present condition of doctors, nurses, physiotherapist, anaesthetics and other care practitioners
within the health care system of Austria and Japan. The data profile has been showed as per
relevant data of WHO. Through this data profile this paper has discussed how the present
scenario of health system has been changed from previous years and what needs to be improved.
Accumulation of data provided by WHO has also supported in making the workforce planning
without any issue. Graphs and charts have also made it easier to evaluate the difference between
health care services provided in these two countries. Critical issues regarding these countries’
health care system are also discussed in this context on the basis of environmental scan of both
the countries. Through analysing the critical issues this paper will led to revelation which areas
needs to be considered such as technical advancement or balancing the ratio of doctors and
nurses in order to improve the health care systems of Australia and Japan. Recommendation has
also been provided by WHO through which policymakers of Australia and Japan can change
their existing strategies of health care services.
The findings has provided insights on 2.83 crores population existing in Australia in the year
2015, with presence of 70,200 doctors and 25400 specialist practitioners operational in the local
health care sector. This is in addition to the high volume of nurses with figures of estimated 2,
57,200 also functional as of 2011 with approximately 80% of them being registered. All these
data has been gathered from the World Health Organisation. In 2015, nearly 29000
physiotherapists was also encountered to be active professionally. This is in stark contrast to
situation in Japan where 200 physicians per 100000 inhabitants in 2014.
2
Table of Contents
Executive summary.........................................................................................................................2
Introduction......................................................................................................................................4
Environmental Scan for the health workforce of Australia and Japan............................................4
Presenting a data profile of the health workforce by category for each country using WHO data
and other data sources......................................................................................................................6
Table, graphs, supporting explanatory text......................................................................................7
Critical issues regarding health sector in each country.................................................................12
Recommendations Developed based on WHO 2016 report..........................................................14
Conclusion.....................................................................................................................................19
References......................................................................................................................................20
3
⊘ This is a preview!⊘
Do you want full access?
Subscribe today to unlock all pages.
Trusted by 1+ million students worldwide
Table of figures:
Figure 1: Nursing and Physician Data of Australia (Source - (hiip.wpro.who.int, 2018))..............8
Figure 2: Nursing and Physician Data of Japan (Source - (hiip.wpro.who.int, 2018) )..................8
Figure 3: Data japan.........................................................................................................................8
Figure 4: Data japan.........................................................................................................................9
Figure 5: Data japan.........................................................................................................................9
Figure 6: Australia Data.................................................................................................................10
Figure 7: Australia Data.................................................................................................................10
Figure 8: Australia Data.................................................................................................................11
Figure 9: Comparison....................................................................................................................11
Figure 10: Comparison..................................................................................................................12
Figure 11: Comparison..................................................................................................................12
4
Paraphrase This Document
Need a fresh take? Get an instant paraphrase of this document with our AI Paraphraser
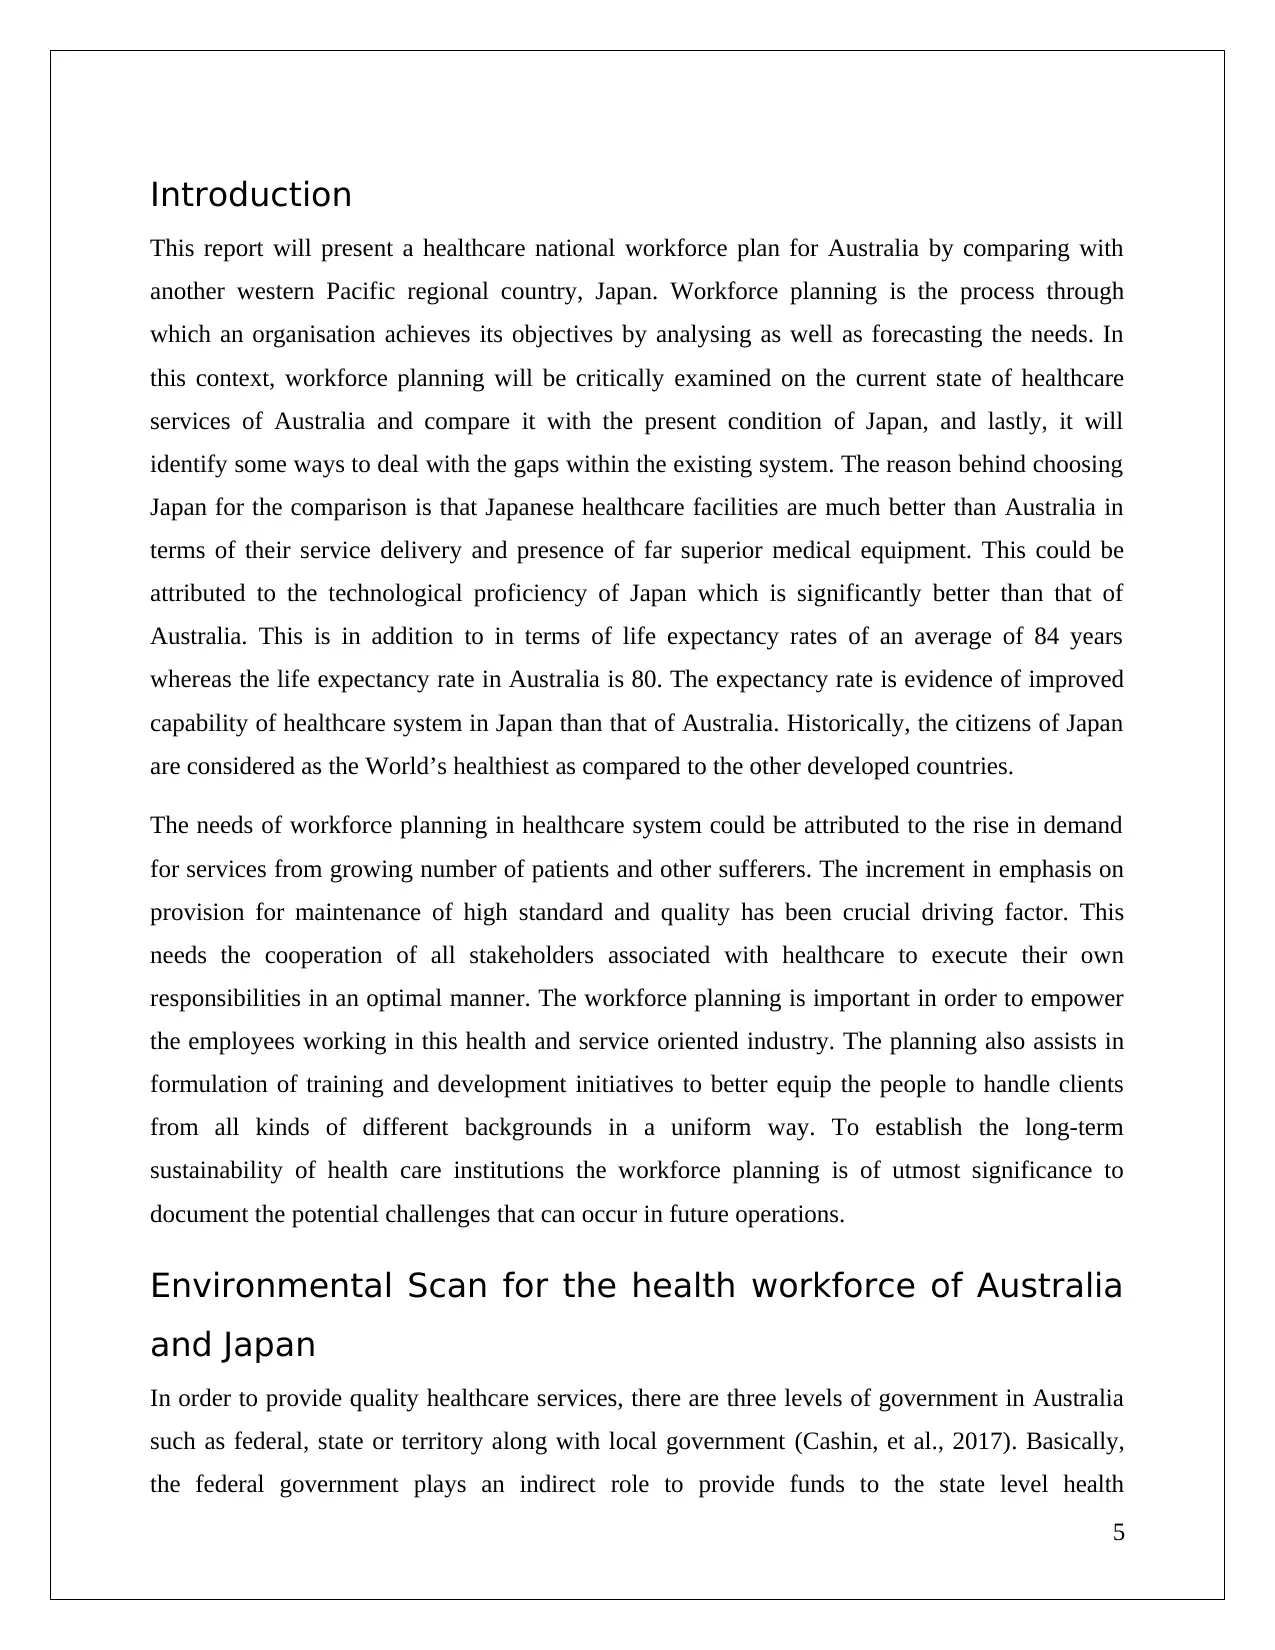
Introduction
This report will present a healthcare national workforce plan for Australia by comparing with
another western Pacific regional country, Japan. Workforce planning is the process through
which an organisation achieves its objectives by analysing as well as forecasting the needs. In
this context, workforce planning will be critically examined on the current state of healthcare
services of Australia and compare it with the present condition of Japan, and lastly, it will
identify some ways to deal with the gaps within the existing system. The reason behind choosing
Japan for the comparison is that Japanese healthcare facilities are much better than Australia in
terms of their service delivery and presence of far superior medical equipment. This could be
attributed to the technological proficiency of Japan which is significantly better than that of
Australia. This is in addition to in terms of life expectancy rates of an average of 84 years
whereas the life expectancy rate in Australia is 80. The expectancy rate is evidence of improved
capability of healthcare system in Japan than that of Australia. Historically, the citizens of Japan
are considered as the World’s healthiest as compared to the other developed countries.
The needs of workforce planning in healthcare system could be attributed to the rise in demand
for services from growing number of patients and other sufferers. The increment in emphasis on
provision for maintenance of high standard and quality has been crucial driving factor. This
needs the cooperation of all stakeholders associated with healthcare to execute their own
responsibilities in an optimal manner. The workforce planning is important in order to empower
the employees working in this health and service oriented industry. The planning also assists in
formulation of training and development initiatives to better equip the people to handle clients
from all kinds of different backgrounds in a uniform way. To establish the long-term
sustainability of health care institutions the workforce planning is of utmost significance to
document the potential challenges that can occur in future operations.
Environmental Scan for the health workforce of Australia
and Japan
In order to provide quality healthcare services, there are three levels of government in Australia
such as federal, state or territory along with local government (Cashin, et al., 2017). Basically,
the federal government plays an indirect role to provide funds to the state level health
5
professionals and subsidies for primary health care services through Pharmaceutical Benefits
Scheme (PBS) and Medicine Benefits Scheme (MBS) (apps.who.int, 2018). Whereas, state or
territory governments have the majority of health care responsibilities for public hospitals,
community health services, ambulance services, mental health care etc. The government of local
region delivers preventive health programs and community health care services through
immunisation and regulating food standards.
During 2014 to 2015 the total health expenditures of Australian government was 10.0 % of its
total GDP, and the government contributed two-thirds of these expenditures. In the year 2015,
the total expenditures of PHI were 8.7 per cent in terms of health spending. Medicare subsidies
been provided by the government through its tax system. In this concern, private health insurance
(PHI) offers more choices towards service users, and it has faster access in non-emergency cases
(who.int, 2018). Government is encouraging private organisation through PHI and some of the
health organisations are also have to pay penalty payments for not having the Medicare Levy
Surcharge.
The Council of Australian Governments (COAG) has initiated Health Workforce Australia
(HWA) in order to provide an advanced health workforce to fulfil the needs of Australian
Community and meet future challenges in healthcare sector. Through HWA, the health care
ministry of Australia has developed a workforce plan to deliver four main areas such as planning,
policy and research on current health care condition, clinical education, and new innovation and
reform the entire process through recruiting and retaining the international professionals in health
care services.
Presently Japan has ranked third in terms of health care services as this country is also well in
public health metrics. Universal Statutory Health Insurance System (SHIS) launched by the
Japanese government has a significant impact on present health care services (Mossialos, Wenzl,
Osborn, & Sarnak, 2016). SHIS has ensured that the quality medical services provided by
national and local governments through providing a subsidy to them (Lorenzoni, Millar, &
Sutherland, 2017). Currently, more than 1700 municipalities have been operating and organising
quality services for their residents (who.int, 2018). In the year 2013, this statutory health
insurance system has provided approximately 3500 noncompeting insurers for public, quasi-
public along with employer-based brokers (Yuda, 2016). It has been found that the average rate
6
⊘ This is a preview!⊘
Do you want full access?
Subscribe today to unlock all pages.
Trusted by 1+ million students worldwide
of Japanese to visit doctors is 14 times in each year so the Japanese doctors cannot make any
profits (Kutzin, Yip, & Cashin, 2016.). However, the administration costs of medicine are
significantly lower than most of the western developed countries.
The health, Labour and welfare ministry of Japan along with the entire health care system in the
year 2003 provided advanced services by introducing a system for reimbursement on diagnosis-
procedure combination (DPC) (Mahlich, Kamae, & Rossi, 2017). The Japanese system
government gives incentives to the health care organisations for providing quality services within
a short time through prescribing fewer drugs and tests. In this way, the ministry of health is
encouraging healthcare organisations to improve the standard of their services.
Presenting a data profile of the health workforce by
category for each country using WHO data and other data
sources
In Australia doctors and nurses plays a significant role in delivering quality medical services so
that they needs to be highly trained to provide quality services for its population and it is also
enhance the social and economic well-being of Australia. The WHO data on Australian
healthcare sector has shown that in the year 2011 there were 70,200 doctors across the whole
region and 25400 specialist practitioners in the medical field (who.int, 2018). The total number
of specialists has been increased from last years which were 32000 doctors in the year 2001. On
the other hand, approximately 2,57,200 nurses were working in that region in the year 2011 and
80 % of them had been registered, the average annual increases are 1.4 % in terms of doctor and
nurses (physiotherapyboard.gov.au, 2018). In terms of physiotherapy WHO data has shown that
there is 29000 registered professional physiotherapists in Australia during the year 2015 while
Japan had recruited 26778 physiotherapist in the same year (Med.or.jp, 2015). WHO data has
showed that there are 308651 physicians in Japan during 2014 on the other hand there were
200660 physicians in Australia in the same year (Medicalboard.gov.au, 2015).
7
Paraphrase This Document
Need a fresh take? Get an instant paraphrase of this document with our AI Paraphraser
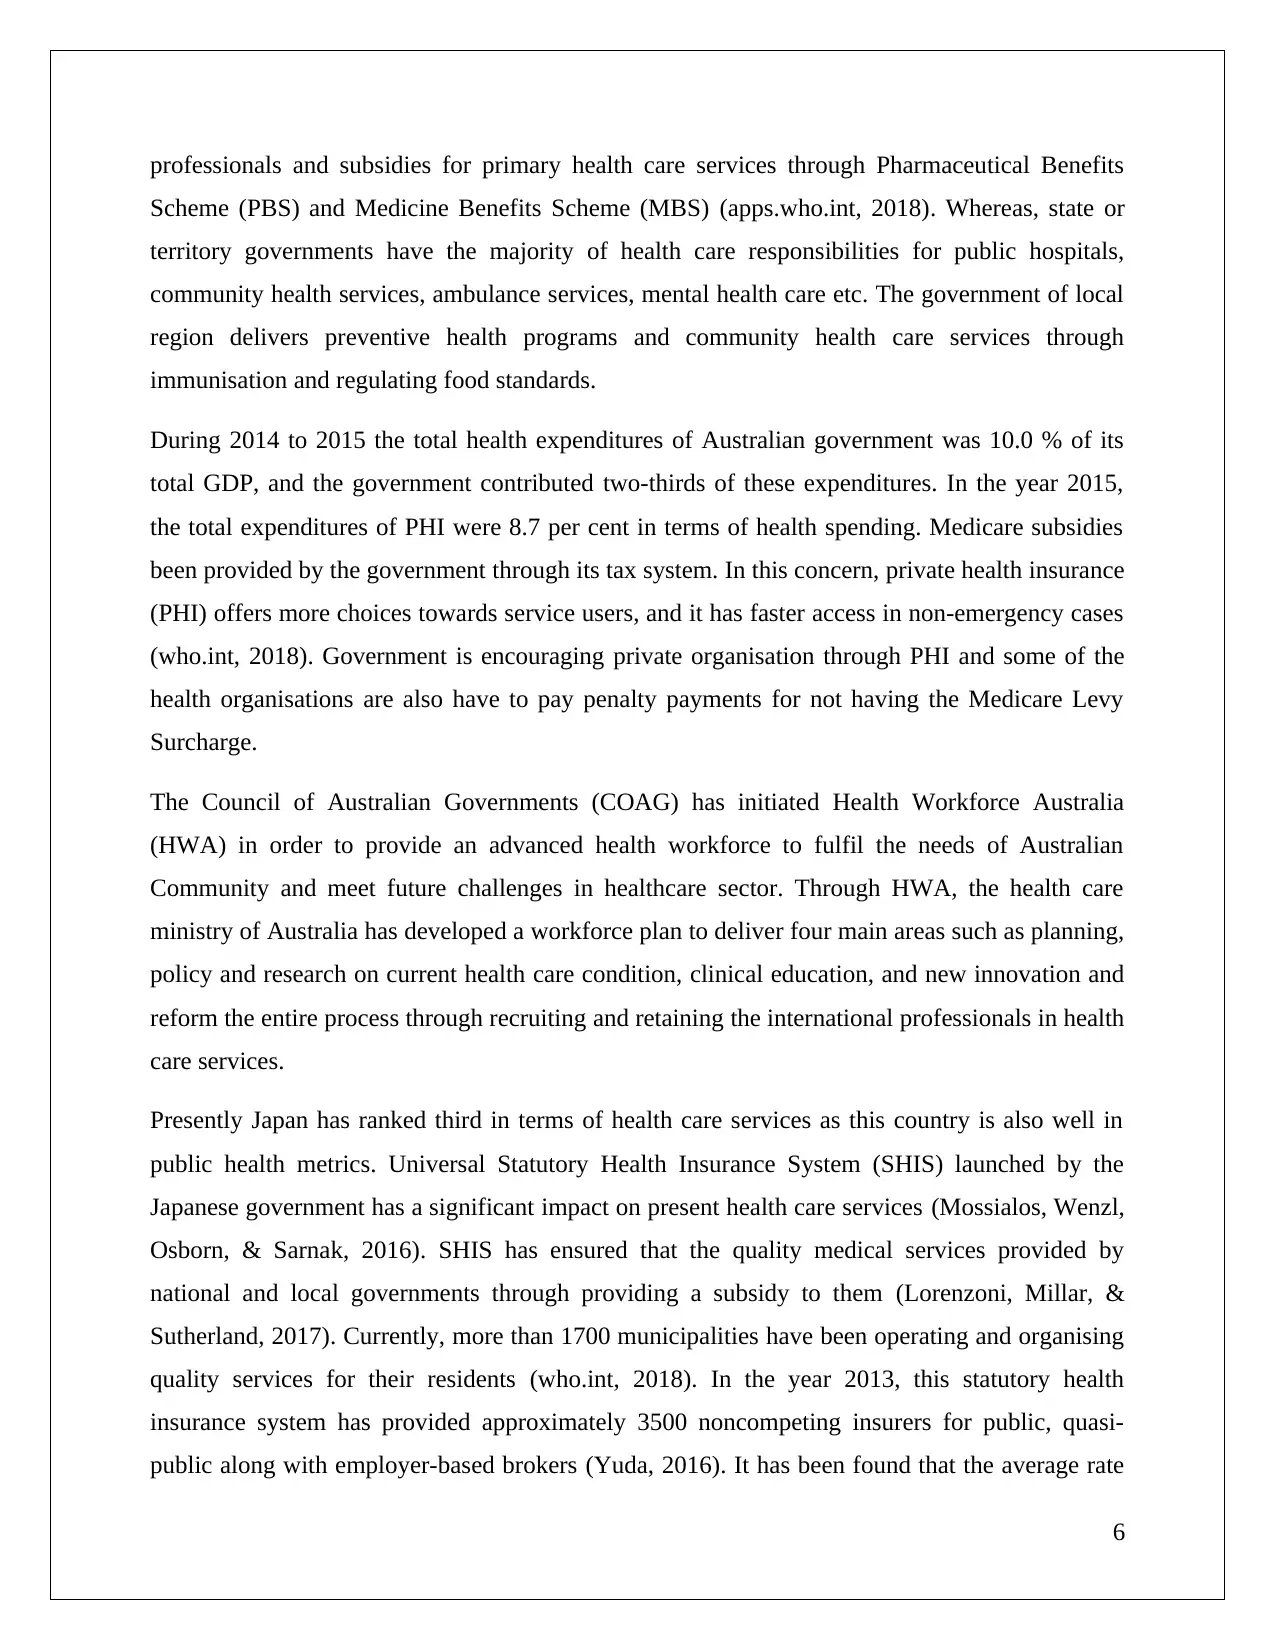
Table, graphs, supporting explanatory text
Figure 1: Nursing and Physician Data of Australia (Source - (hiip.wpro.who.int, 2018))
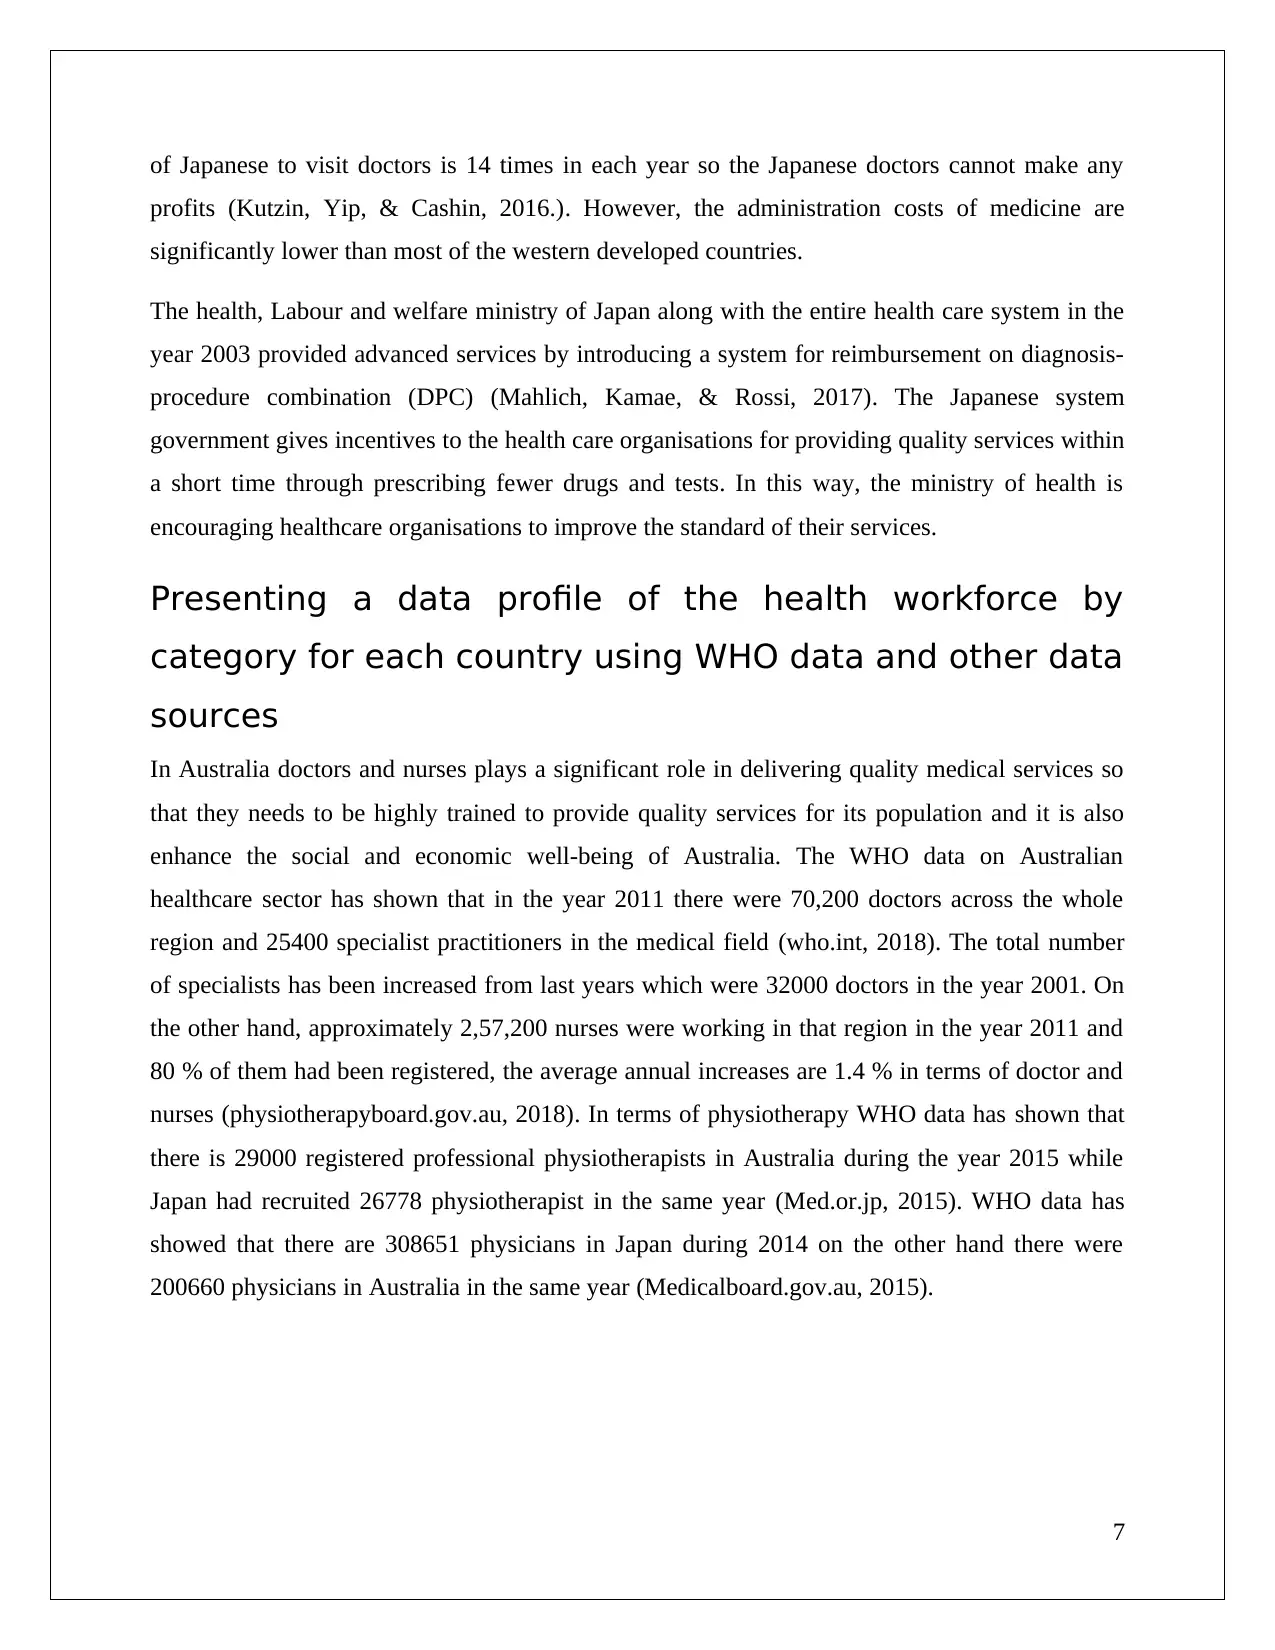
Figure 2: Nursing and Physician Data of Japan (Source - (hiip.wpro.who.int, 2018) )
1 2
0
200000
400000
600000
800000
1000000
1200000
62976 6.2
952768
93.8
Japan nurse
male female
Figure 3: Data japan
From the data it is noticed that male percentage is low in japan and female is high.
8
Figure 1: Nursing and Physician Data of Australia (Source - (hiip.wpro.who.int, 2018))
Figure 2: Nursing and Physician Data of Japan (Source - (hiip.wpro.who.int, 2018) )
1 2
0
200000
400000
600000
800000
1000000
1200000
62976 6.2
952768
93.8
Japan nurse
male female
Figure 3: Data japan
From the data it is noticed that male percentage is low in japan and female is high.
8
1 2
0
50000
100000
150000
200000
250000
300000
243627
80.3
59641
19.7
Japan Doctor
male female
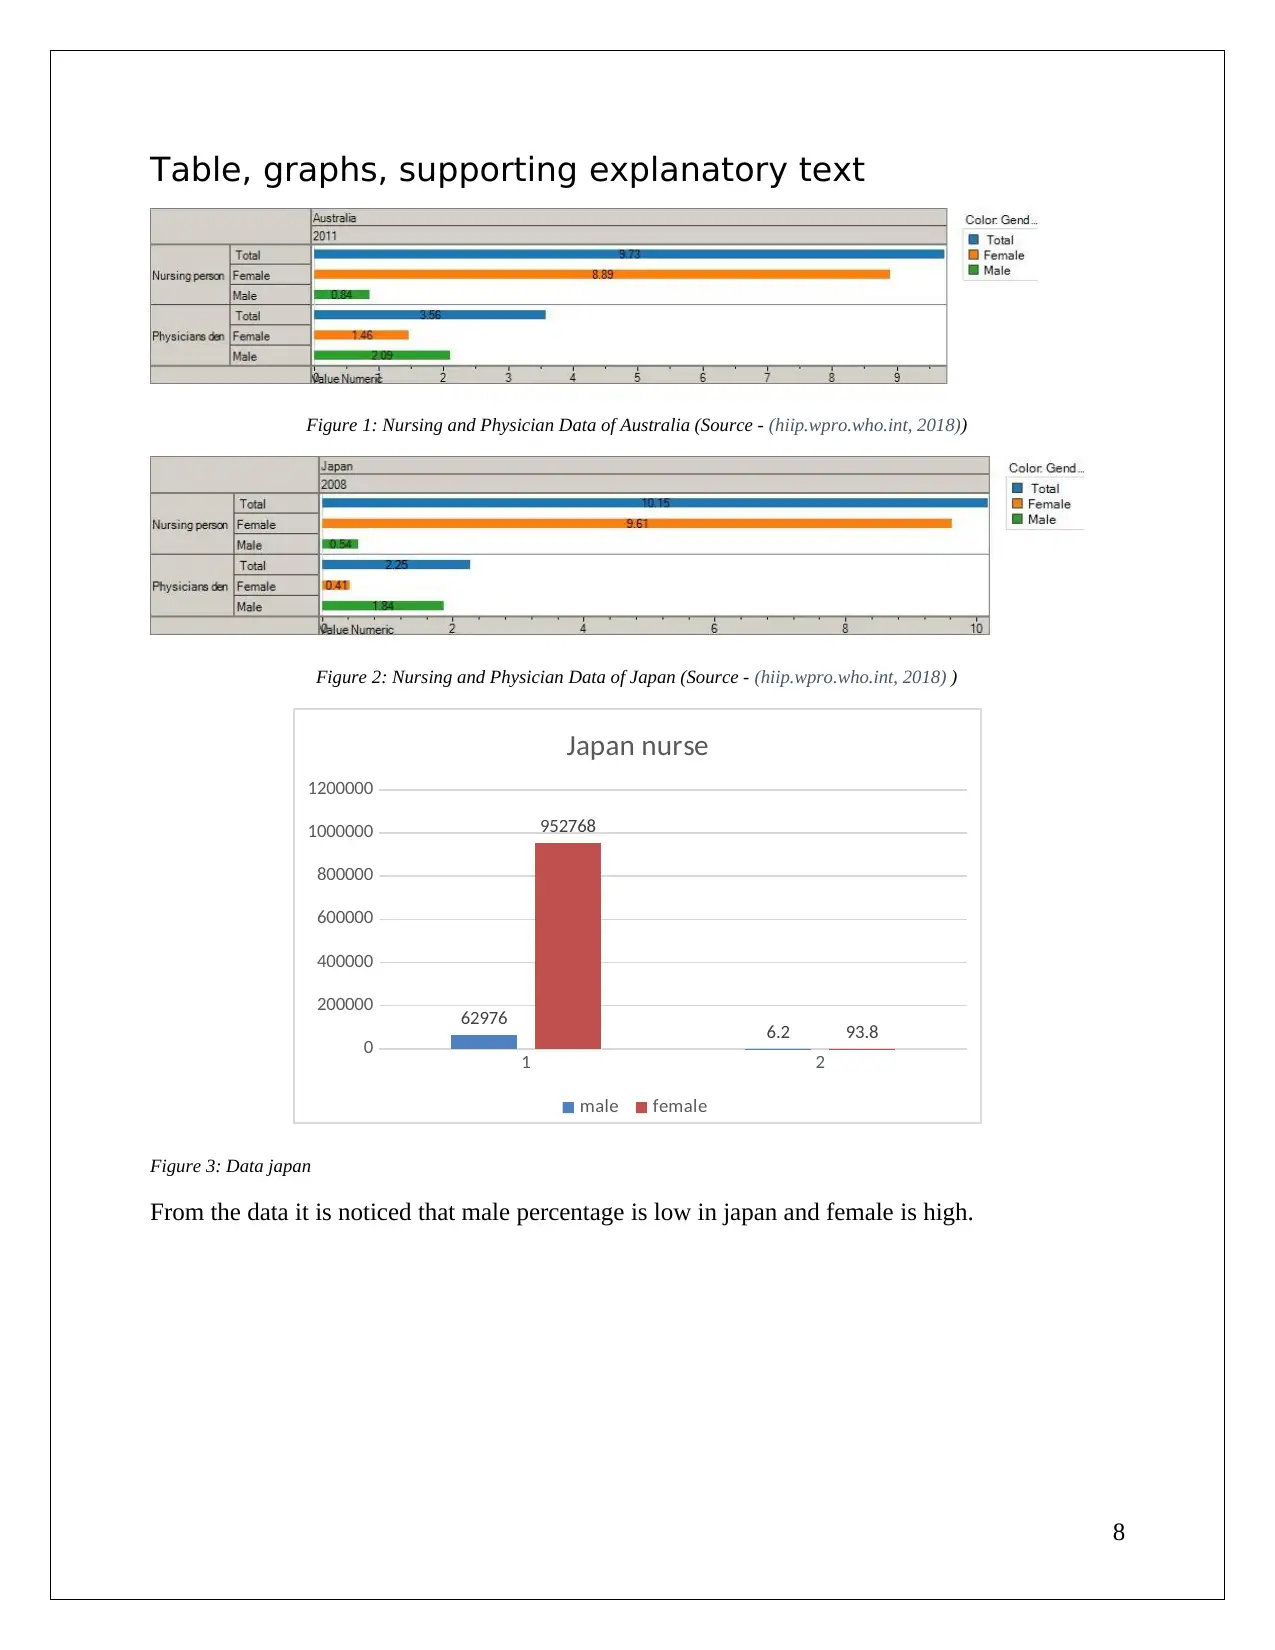
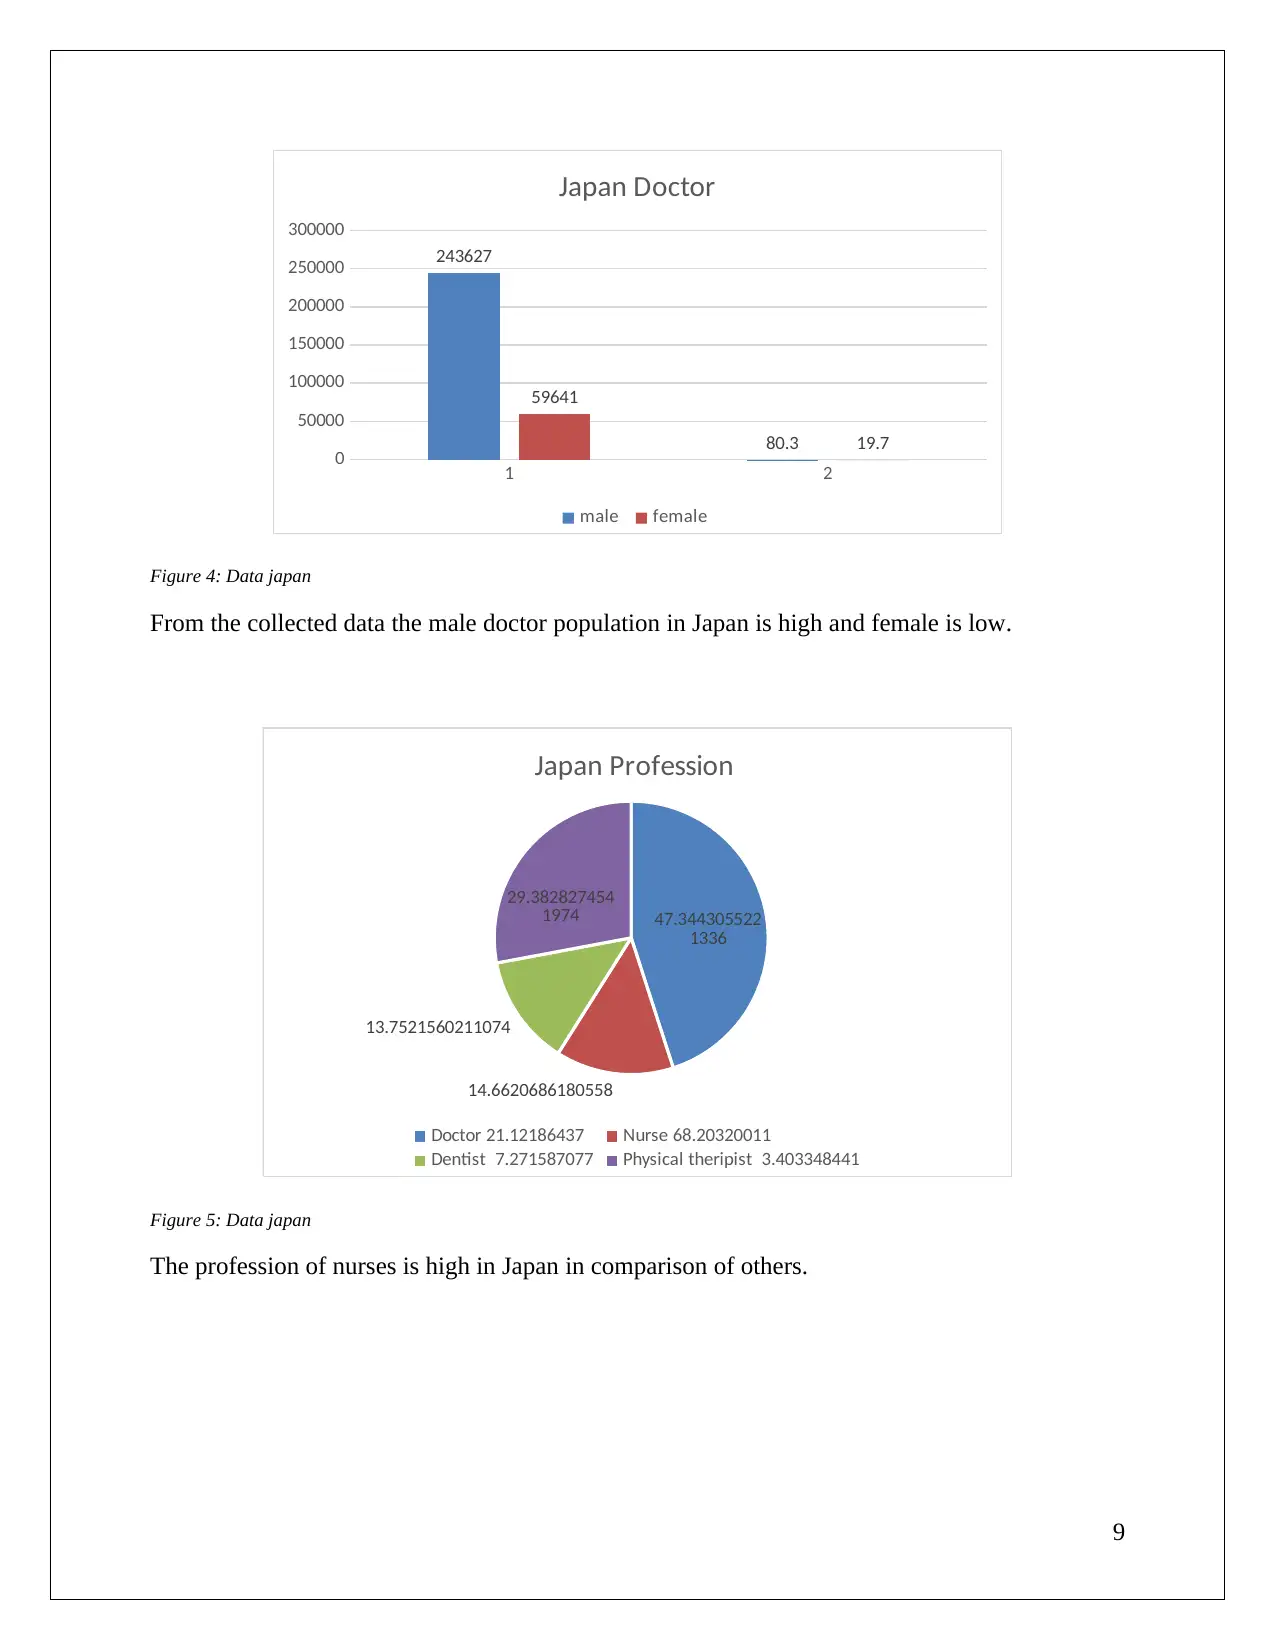
Figure 4: Data japan
From the collected data the male doctor population in Japan is high and female is low.
47.344305522
1336
14.6620686180558
13.7521560211074
29.382827454
1974
Japan Profession
Doctor 21.12186437 Nurse 68.20320011
Dentist 7.271587077 Physical theripist 3.403348441
Figure 5: Data japan
The profession of nurses is high in Japan in comparison of others.
9
0
50000
100000
150000
200000
250000
300000
243627
80.3
59641
19.7
Japan Doctor
male female
Figure 4: Data japan
From the collected data the male doctor population in Japan is high and female is low.
47.344305522
1336
14.6620686180558
13.7521560211074
29.382827454
1974
Japan Profession
Doctor 21.12186437 Nurse 68.20320011
Dentist 7.271587077 Physical theripist 3.403348441
Figure 5: Data japan
The profession of nurses is high in Japan in comparison of others.
9
⊘ This is a preview!⊘
Do you want full access?
Subscribe today to unlock all pages.
Trusted by 1+ million students worldwide
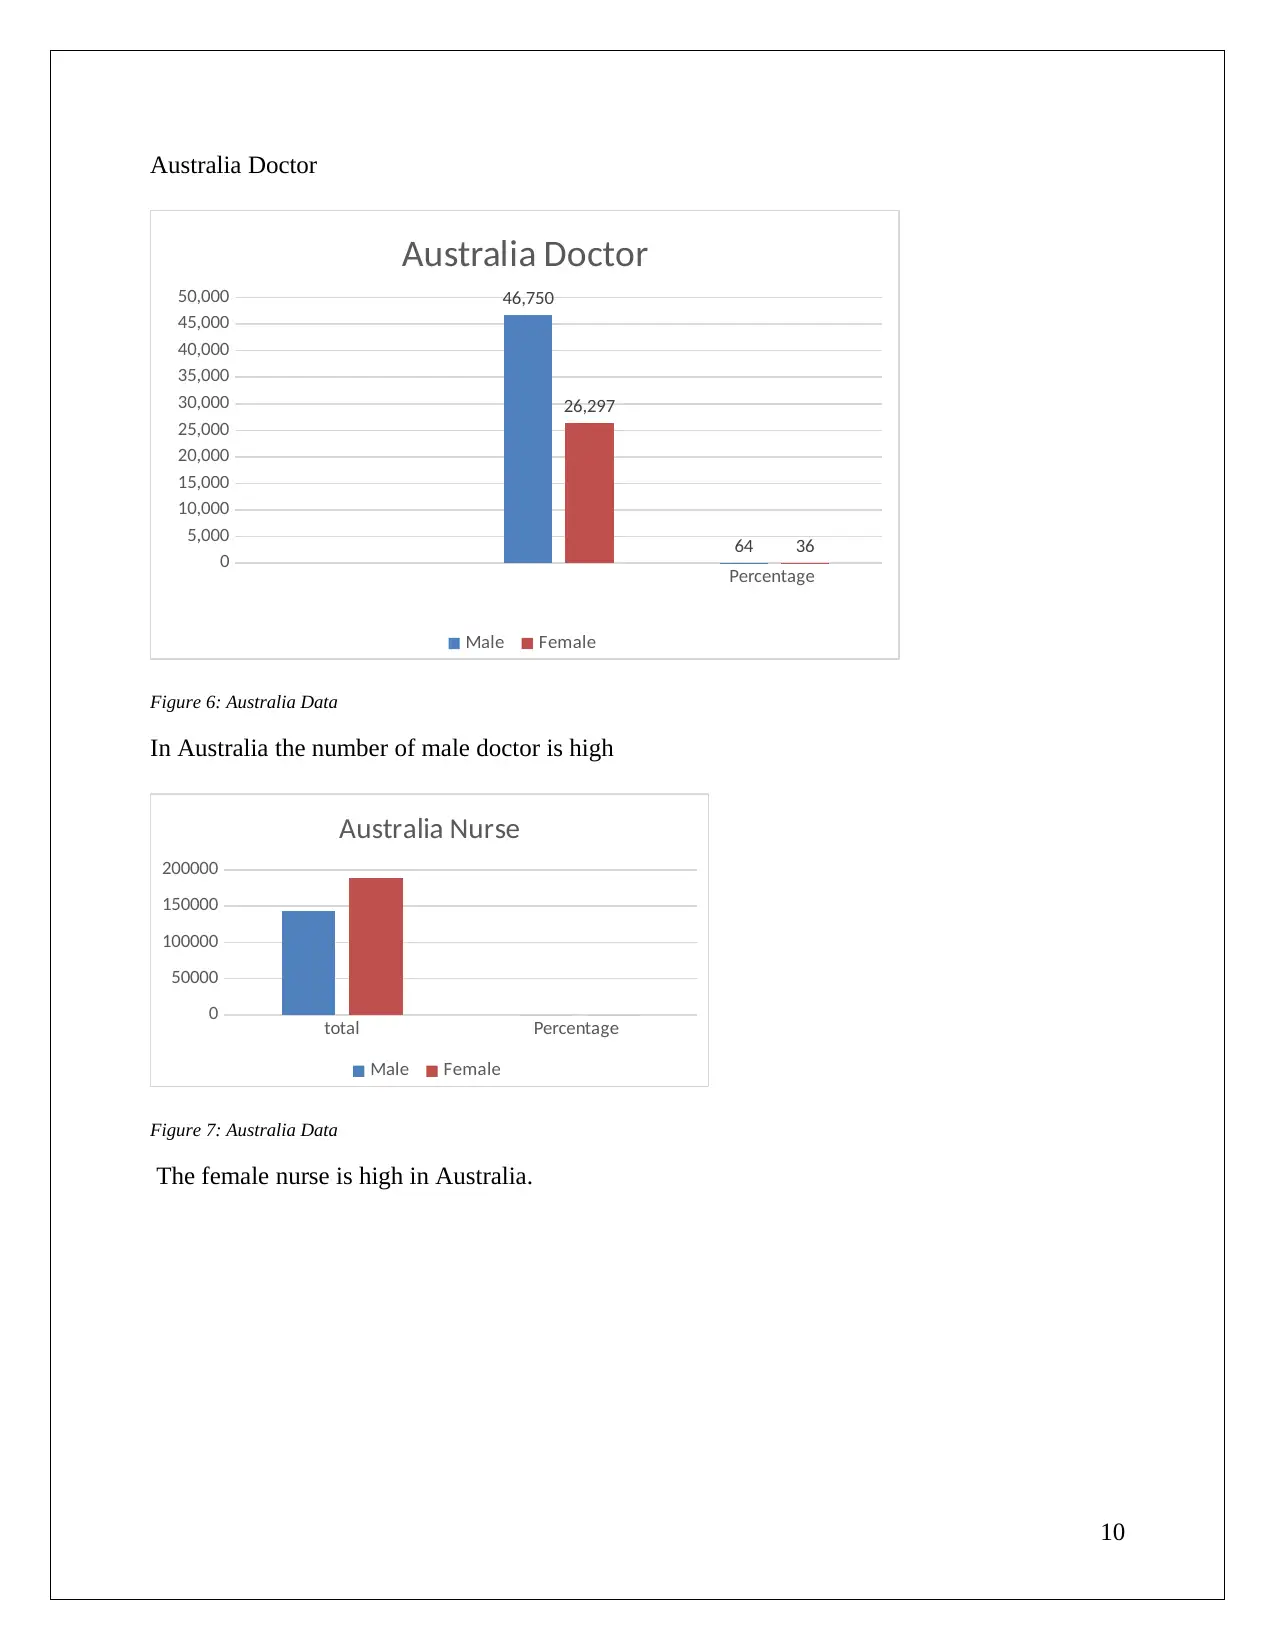
Australia Doctor
Percentage
0
5,000
10,000
15,000
20,000
25,000
30,000
35,000
40,000
45,000
50,000 46,750
64
26,297
36
Australia Doctor
Male Female
Figure 6: Australia Data
In Australia the number of male doctor is high
total Percentage
0
50000
100000
150000
200000
Australia Nurse
Male Female
Figure 7: Australia Data
The female nurse is high in Australia.
10
Paraphrase This Document
Need a fresh take? Get an instant paraphrase of this document with our AI Paraphraser
Doctor Nurse Dentist Physical
theripist
0
50000
100000
150000
200000
250000
300000
350000
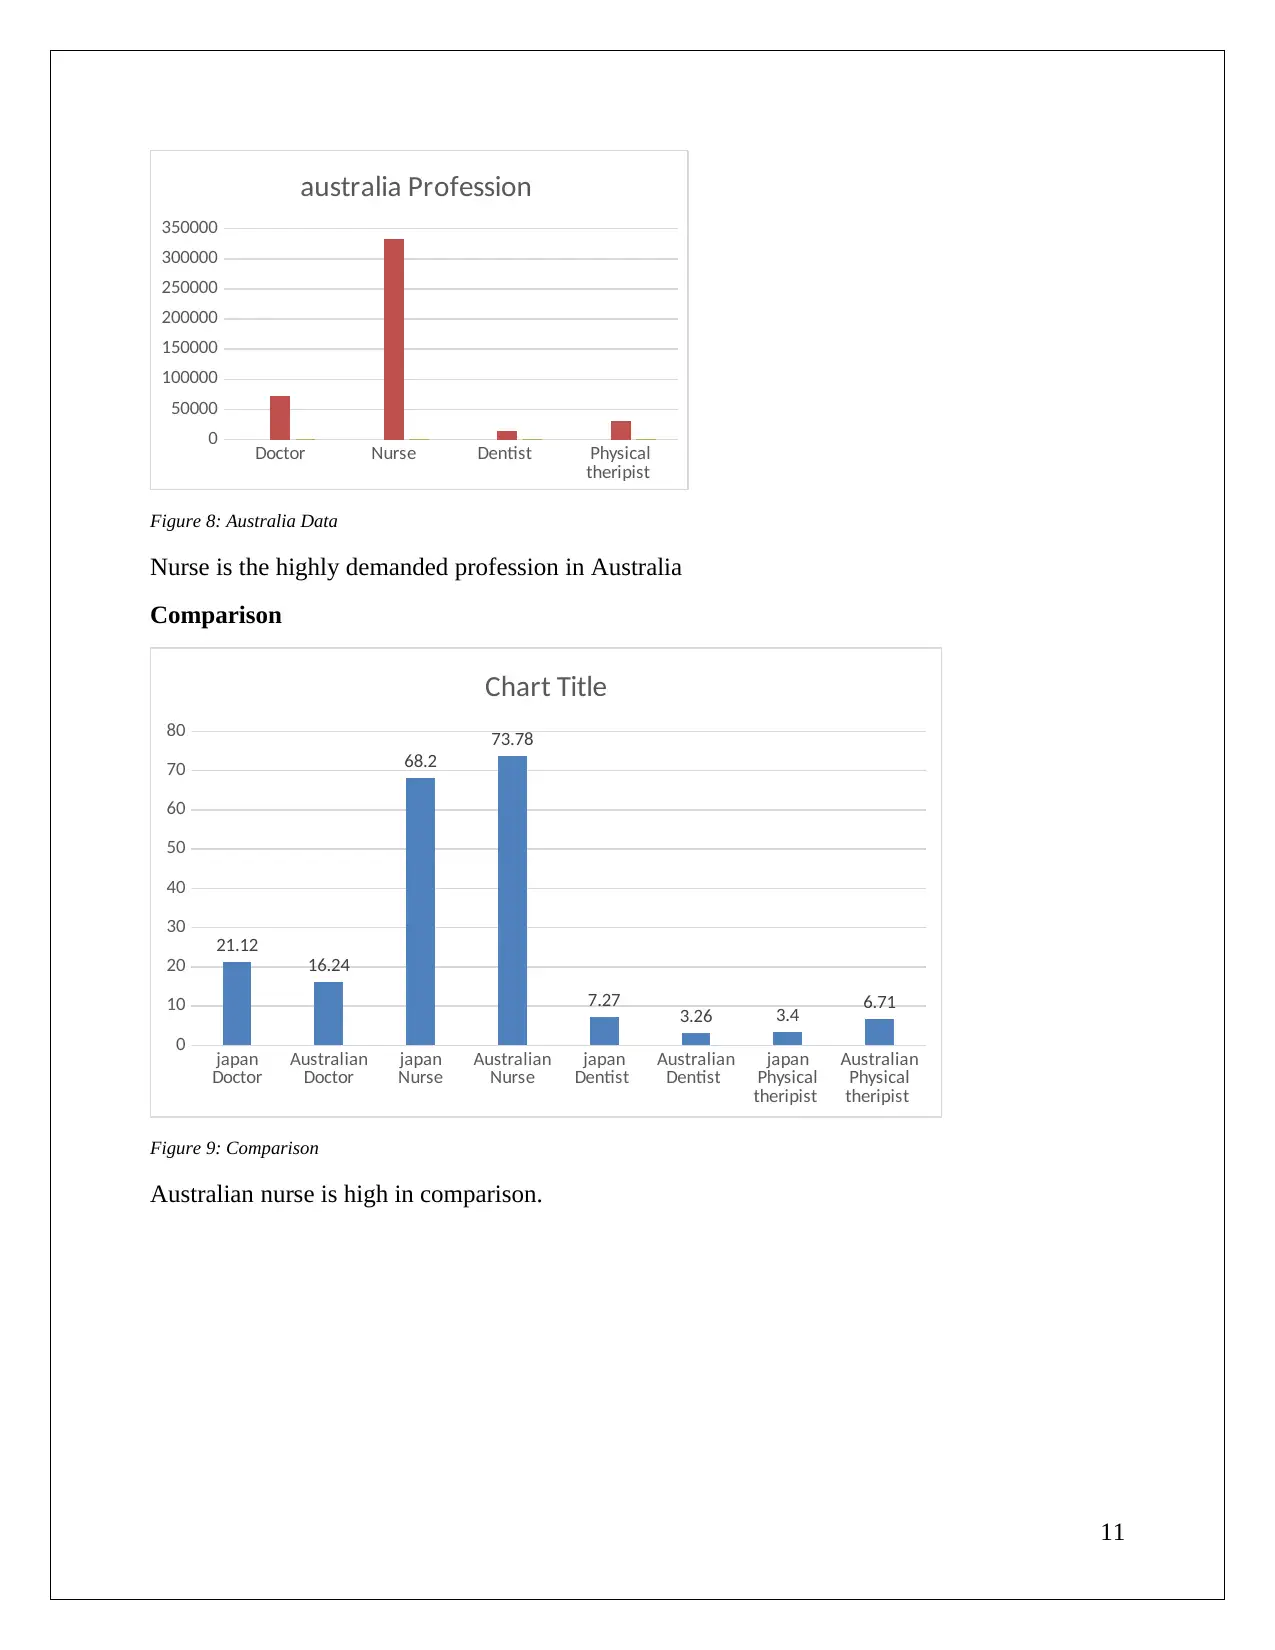
australia Profession
Figure 8: Australia Data
Nurse is the highly demanded profession in Australia
Comparison
japan
Doctor Australian
Doctor japan
Nurse Australian
Nurse japan
Dentist Australian
Dentist japan
Physical
theripist
Australian
Physical
theripist
0
10
20
30
40
50
60
70
80
21.12
16.24
68.2
73.78
7.27 3.26 3.4 6.71
Chart Title
Figure 9: Comparison
Australian nurse is high in comparison.
11
theripist
0
50000
100000
150000
200000
250000
300000
350000
australia Profession
Figure 8: Australia Data
Nurse is the highly demanded profession in Australia
Comparison
japan
Doctor Australian
Doctor japan
Nurse Australian
Nurse japan
Dentist Australian
Dentist japan
Physical
theripist
Australian
Physical
theripist
0
10
20
30
40
50
60
70
80
21.12
16.24
68.2
73.78
7.27 3.26 3.4 6.71
Chart Title
Figure 9: Comparison
Australian nurse is high in comparison.
11
Australian female japan female
0
10
20
30
40
50
60
70
80
90
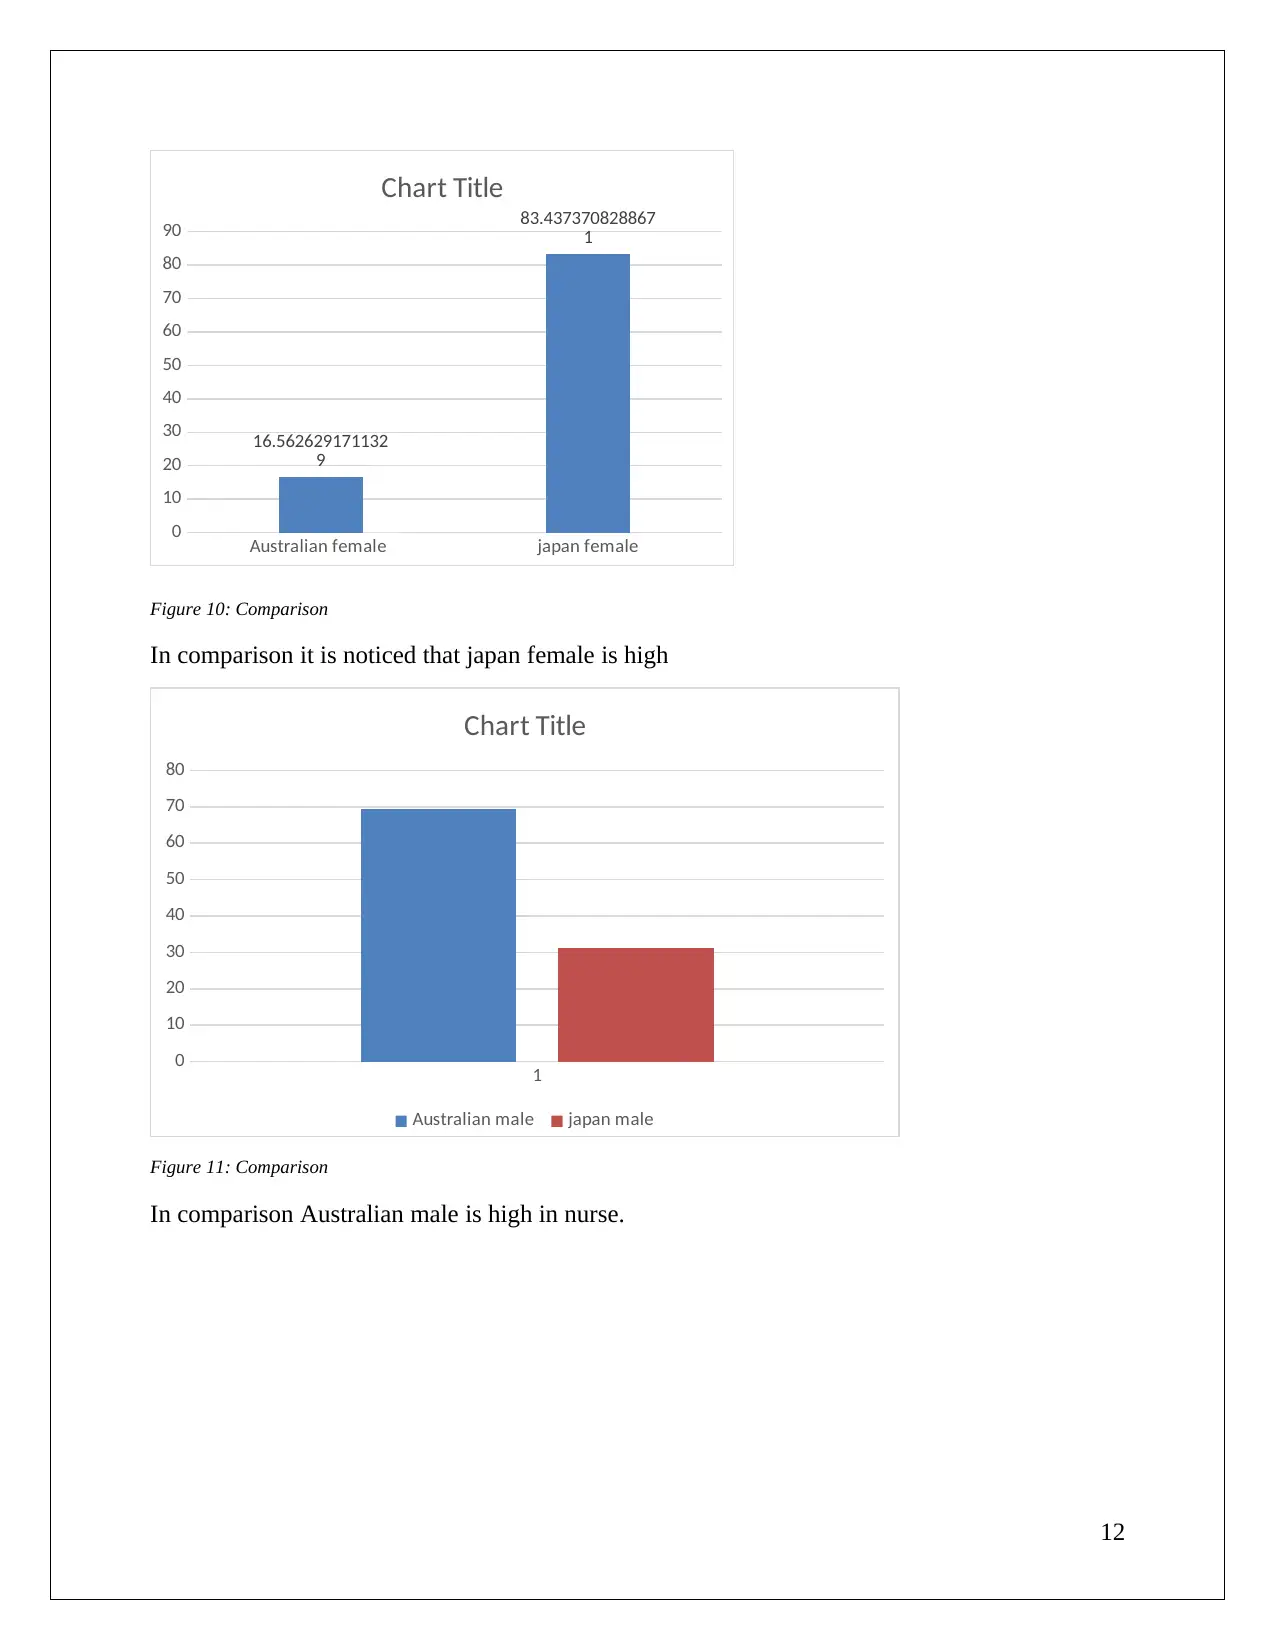
16.562629171132
9
83.437370828867
1
Chart Title
Figure 10: Comparison
In comparison it is noticed that japan female is high
1
0
10
20
30
40
50
60
70
80
Chart Title
Australian male japan male
Figure 11: Comparison
In comparison Australian male is high in nurse.
12
0
10
20
30
40
50
60
70
80
90
16.562629171132
9
83.437370828867
1
Chart Title
Figure 10: Comparison
In comparison it is noticed that japan female is high
1
0
10
20
30
40
50
60
70
80
Chart Title
Australian male japan male
Figure 11: Comparison
In comparison Australian male is high in nurse.
12
⊘ This is a preview!⊘
Do you want full access?
Subscribe today to unlock all pages.
Trusted by 1+ million students worldwide
1 out of 23
Related Documents


Your All-in-One AI-Powered Toolkit for Academic Success.
+13062052269
info@desklib.com
Available 24*7 on WhatsApp / Email
![[object Object]](/_next/static/media/star-bottom.7253800d.svg)
Unlock your academic potential
Copyright © 2020–2026 A2Z Services. All Rights Reserved. Developed and managed by ZUCOL.