COHE 6310: Healthcare Accounting - Financial Ratio Analysis Exam

Verified

Added on  2023/06/03

|8
|907
|260
Homework Assignment
AI Summary
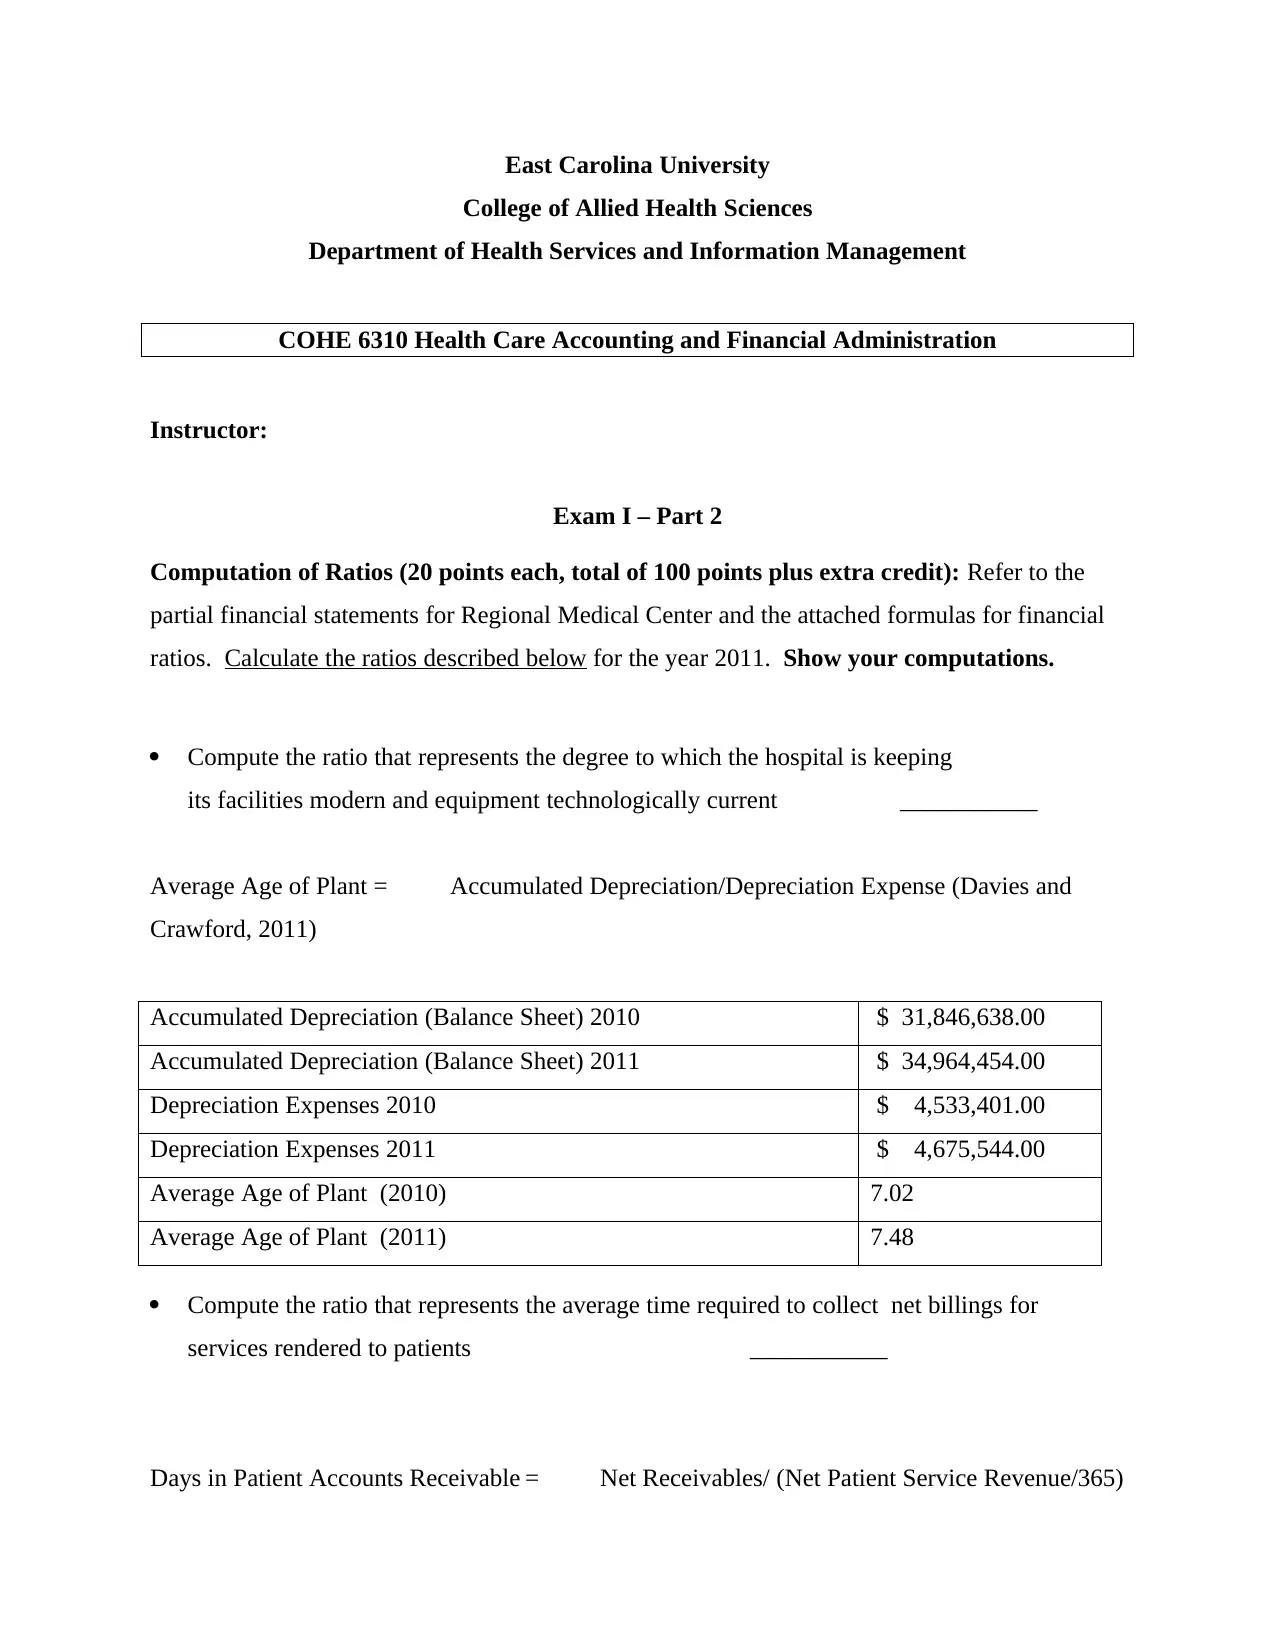
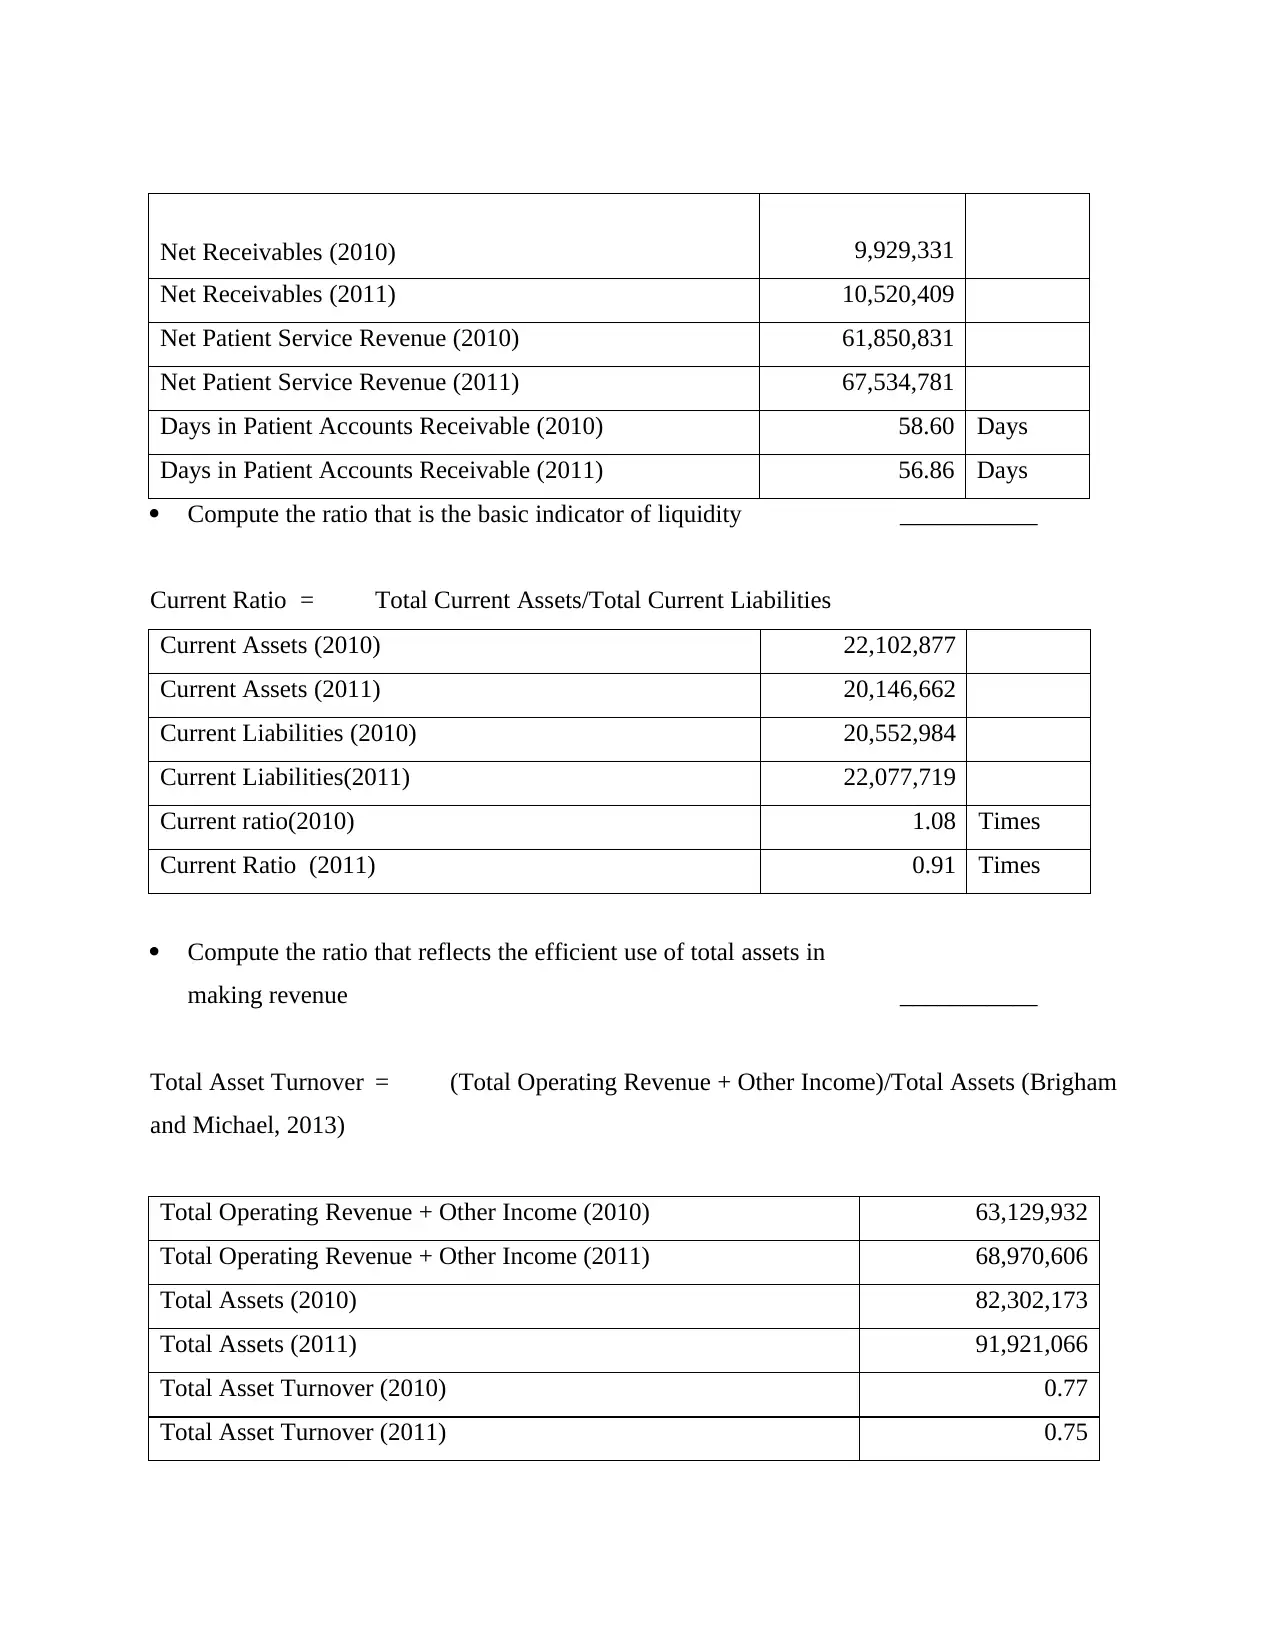
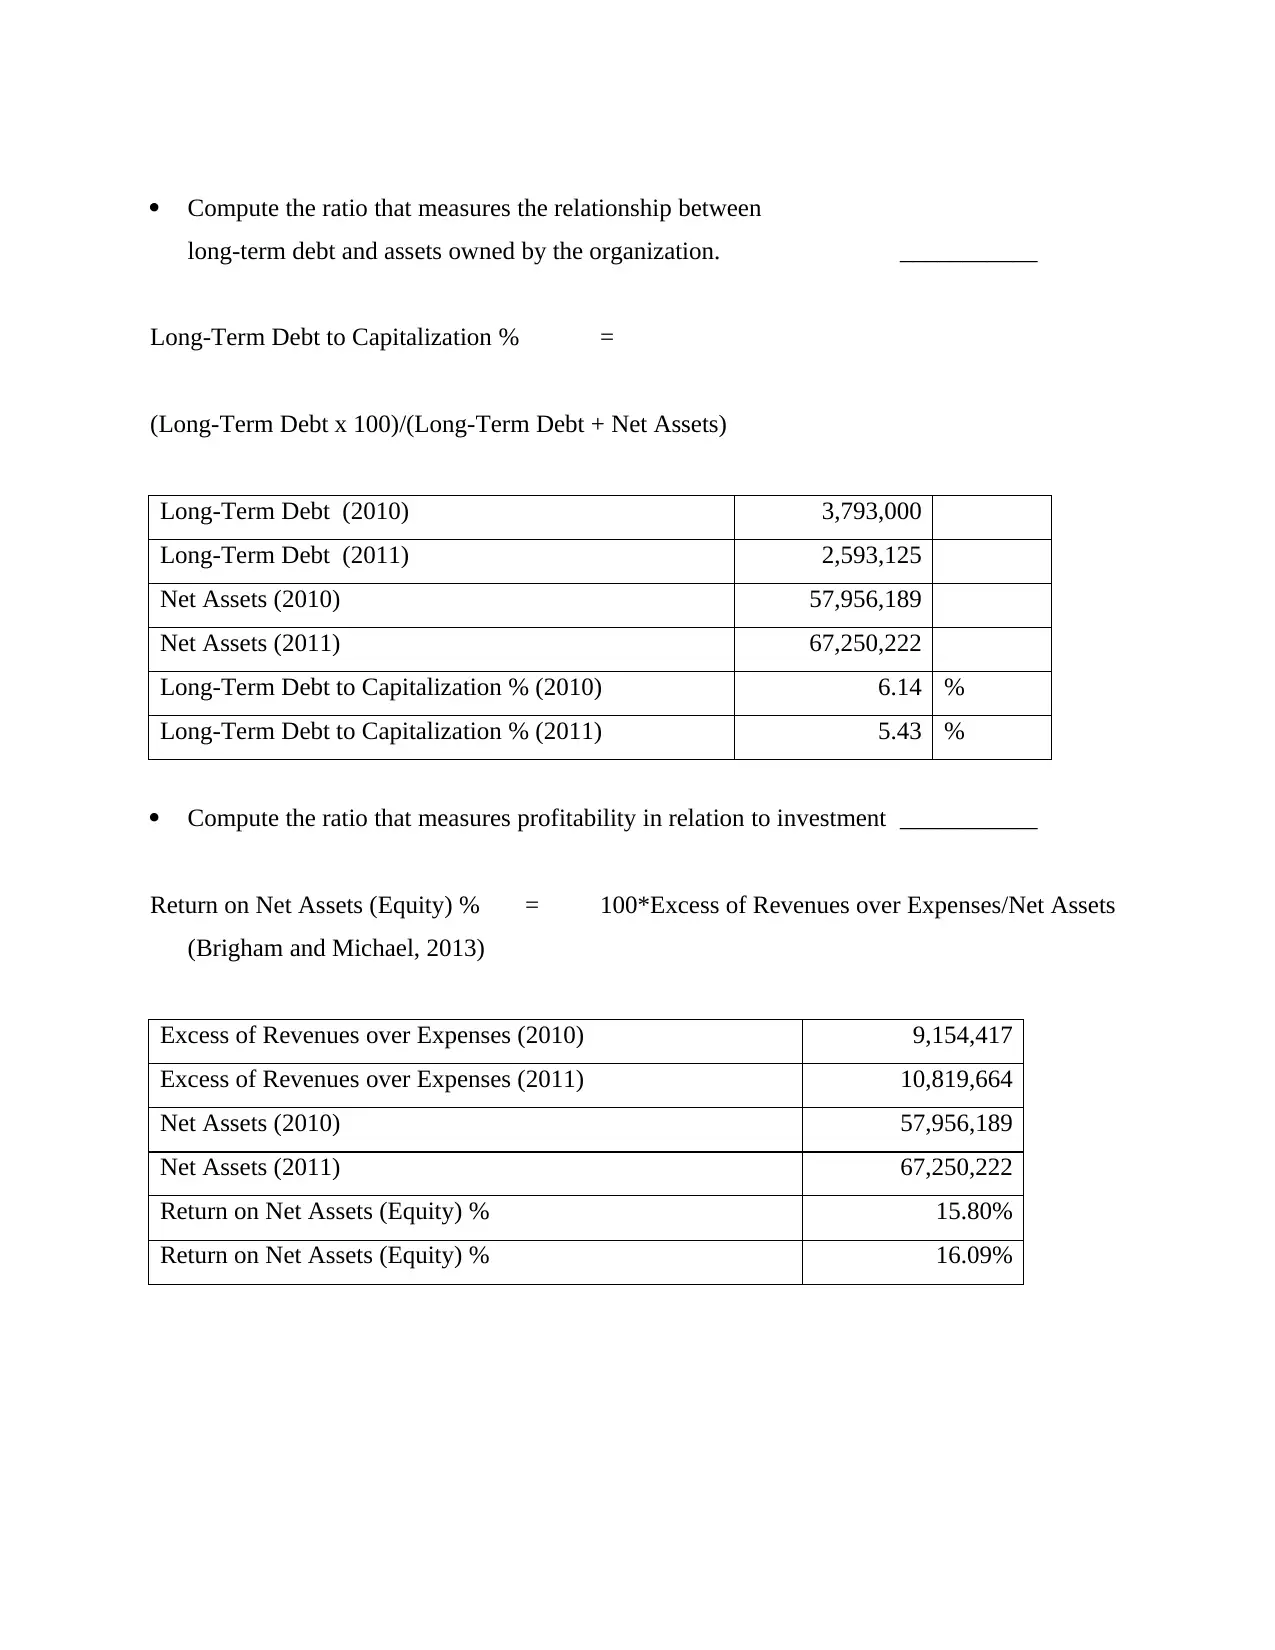
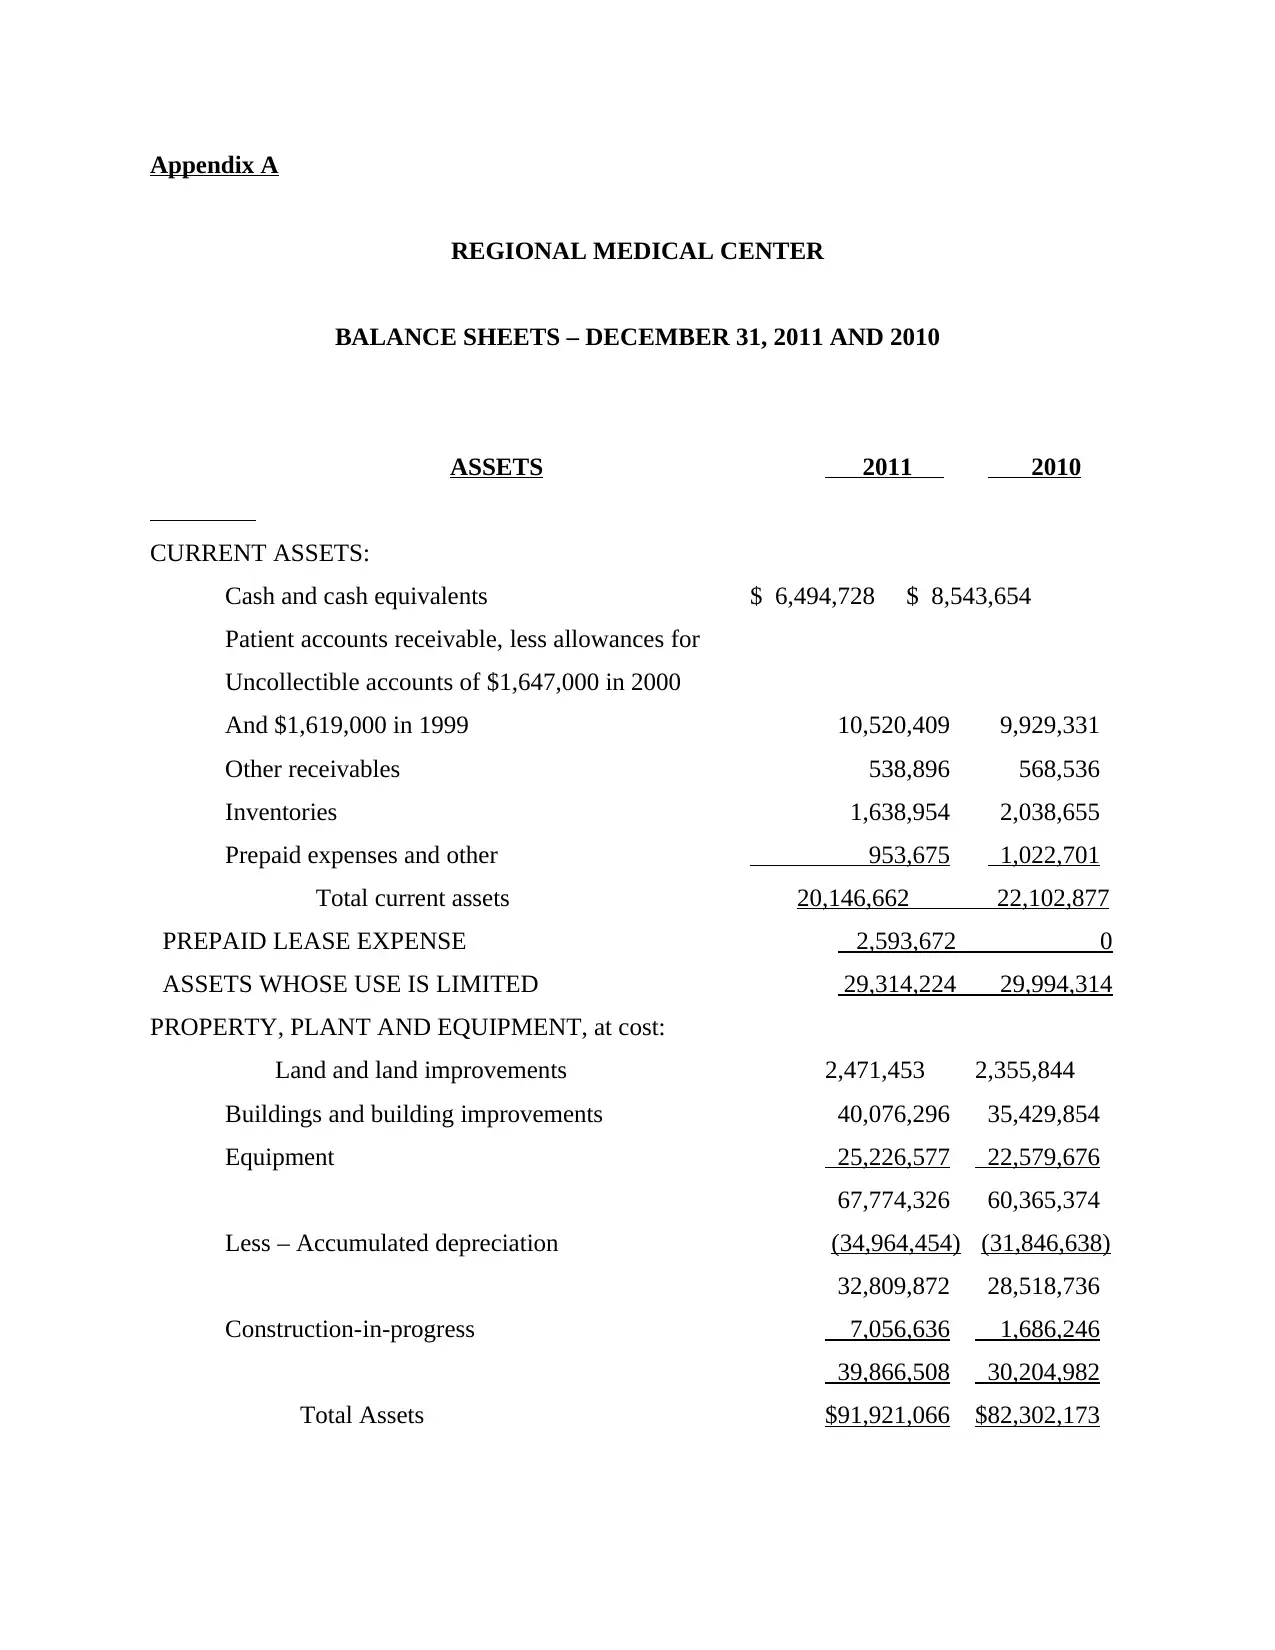
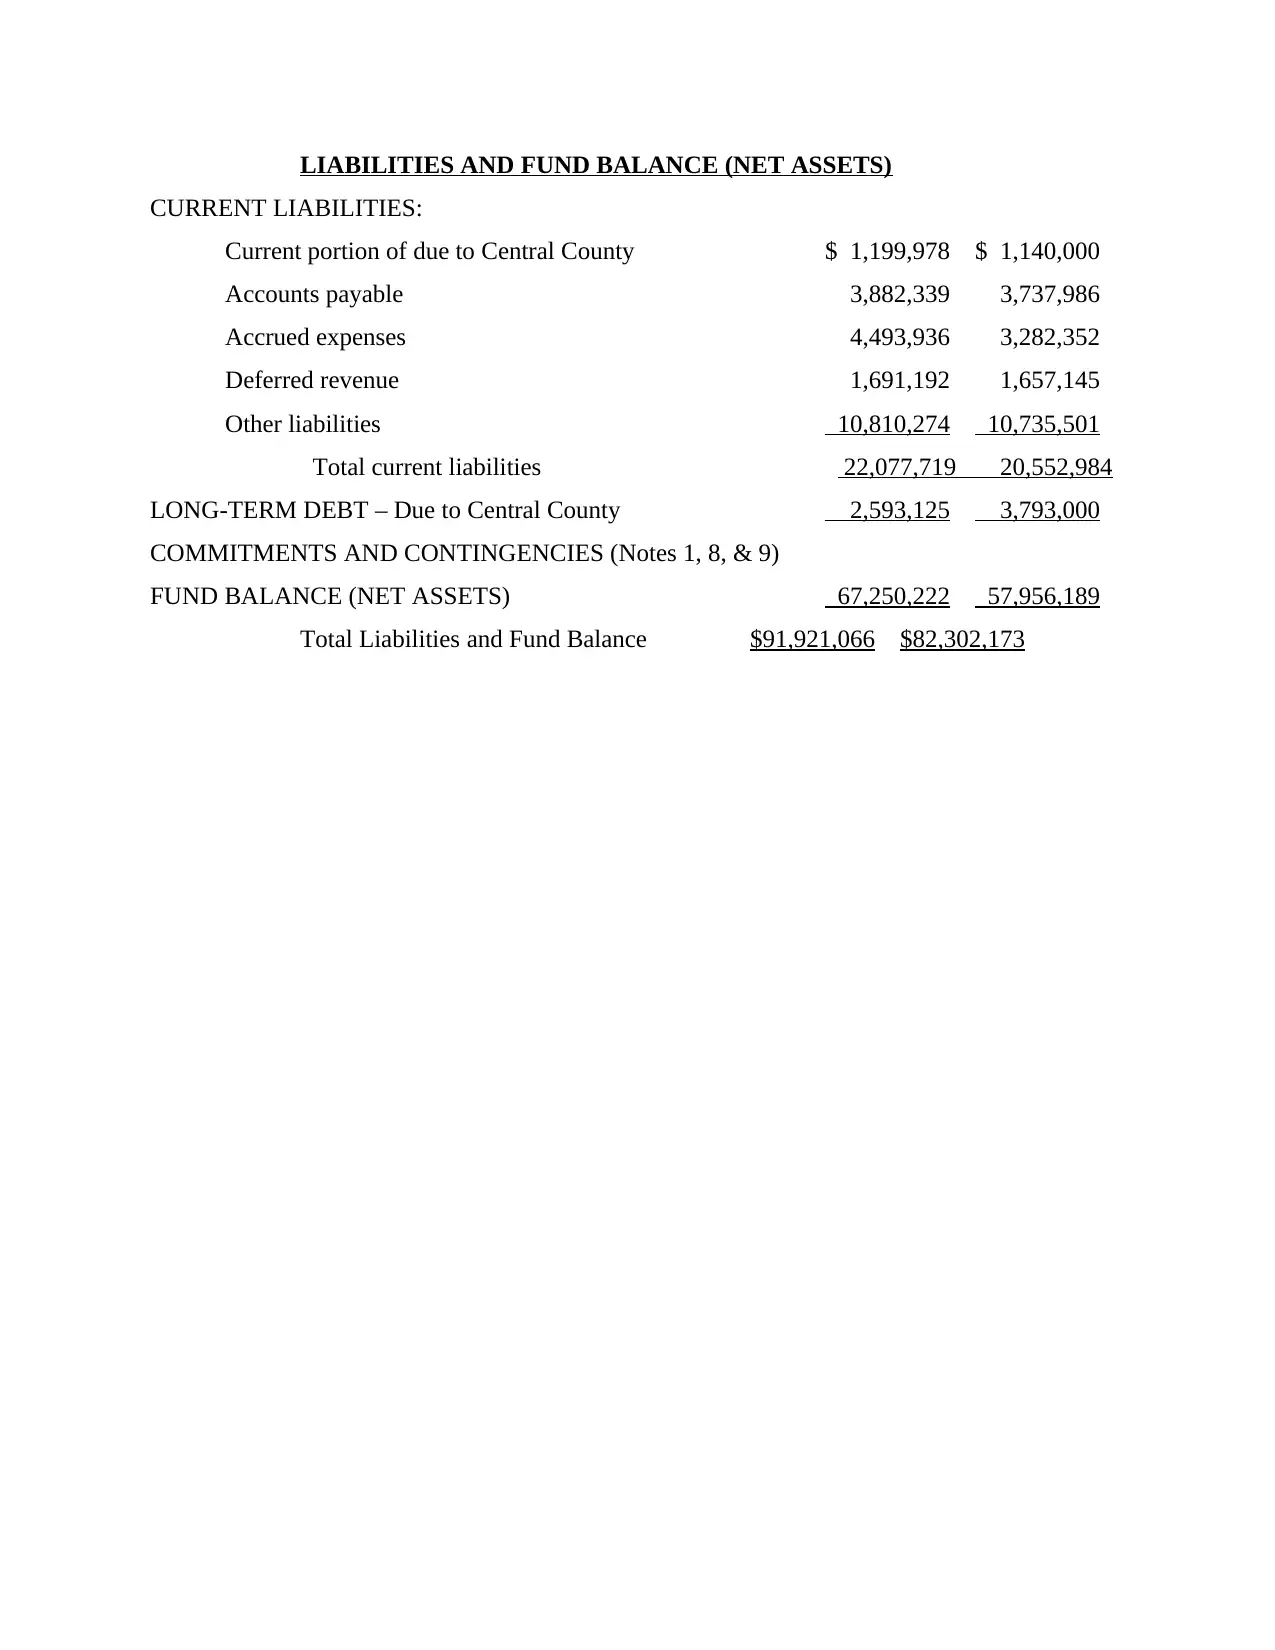
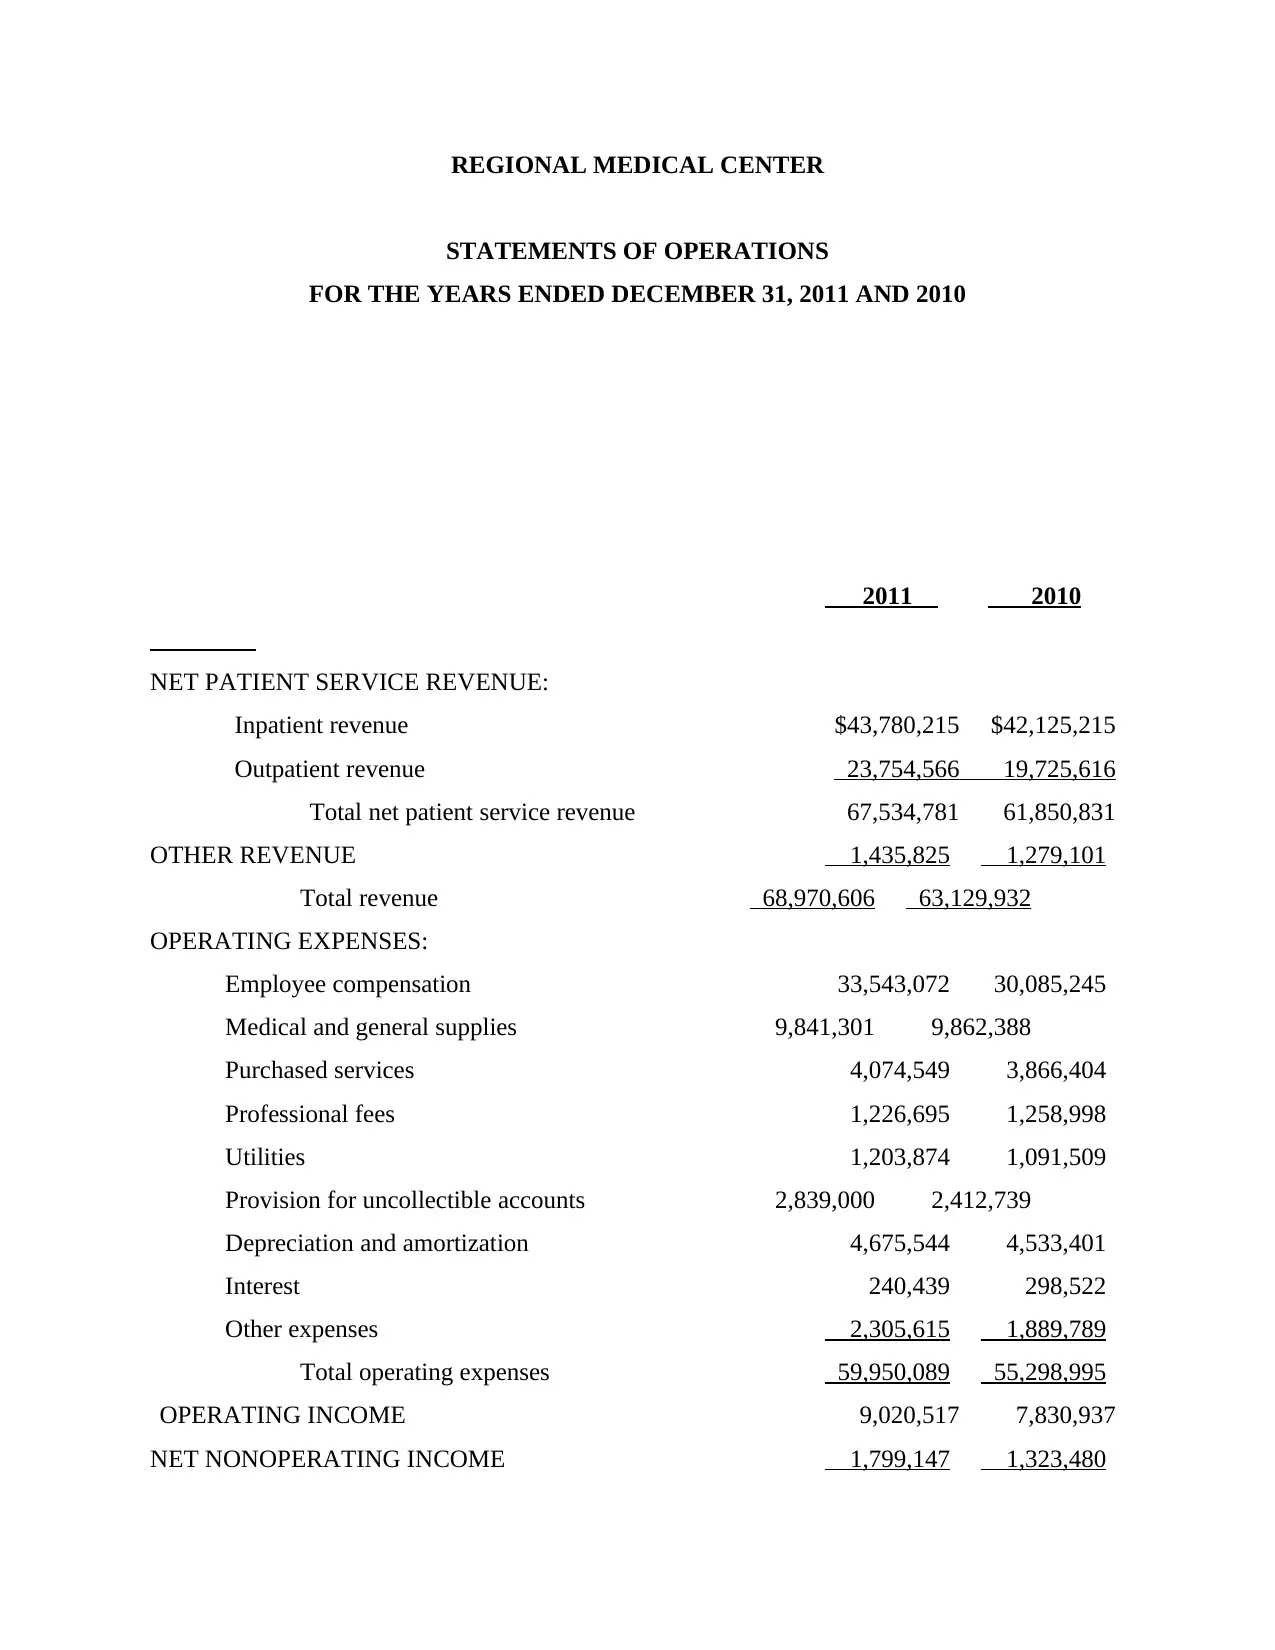
This assignment provides a comprehensive financial ratio analysis of Regional Medical Center, utilizing data from its balance sheets and statements of operations for 2010 and 2011. The analysis includes the computation and interpretation of key financial ratios such as Average Age of Plant, Days in Patient Accounts Receivable, Current Ratio, Total Asset Turnover, Long-Term Debt to Capitalization %, and Return on Net Assets (Equity) %. Each ratio is calculated with detailed computations, offering insights into the hospital's operational efficiency, liquidity, solvency, and profitability. The assignment references financial management and accounting principles from Brigham and Michael (2013) and Davies and Crawford (2011), providing a solid foundation for understanding healthcare financial performance. Desklib offers a platform to explore similar solved assignments and past papers for students.
Document Page
East Carolina University
College of Allied Health Sciences
Department of Health Services and Information Management
COHE 6310 Health Care Accounting and Financial Administration
Instructor:
Exam I – Part 2
Computation of Ratios (20 points each, total of 100 points plus extra credit): Refer to the
partial financial statements for Regional Medical Center and the attached formulas for financial
ratios. Calculate the ratios described below for the year 2011. Show your computations.
Compute the ratio that represents the degree to which the hospital is keeping
its facilities modern and equipment technologically current ___________
Average Age of Plant = Accumulated Depreciation/Depreciation Expense (Davies and
Crawford, 2011)
Accumulated Depreciation (Balance Sheet) 2010 $ 31,846,638.00
Accumulated Depreciation (Balance Sheet) 2011 $ 34,964,454.00
Depreciation Expenses 2010 $ 4,533,401.00
Depreciation Expenses 2011 $ 4,675,544.00
Average Age of Plant (2010) 7.02
Average Age of Plant (2011) 7.48
Compute the ratio that represents the average time required to collect net billings for
services rendered to patients ___________
Days in Patient Accounts Receivable = Net Receivables/ (Net Patient Service Revenue/365)
tabler-icon-diamond-filled.svg

Secure Best Marks with AI Grader

Need help grading? Try our AI Grader for instant feedback on your assignments.
Document Page
Net Receivables (2010) 9,929,331
Net Receivables (2011) 10,520,409
Net Patient Service Revenue (2010) 61,850,831
Net Patient Service Revenue (2011) 67,534,781
Days in Patient Accounts Receivable (2010) 58.60 Days
Days in Patient Accounts Receivable (2011) 56.86 Days
Compute the ratio that is the basic indicator of liquidity ___________
Current Ratio = Total Current Assets/Total Current Liabilities
Current Assets (2010) 22,102,877
Current Assets (2011) 20,146,662
Current Liabilities (2010) 20,552,984
Current Liabilities(2011) 22,077,719
Current ratio(2010) 1.08 Times
Current Ratio (2011) 0.91 Times
Compute the ratio that reflects the efficient use of total assets in
making revenue ___________
Total Asset Turnover = (Total Operating Revenue + Other Income)/Total Assets (Brigham
and Michael, 2013)
Total Operating Revenue + Other Income (2010) 63,129,932
Total Operating Revenue + Other Income (2011) 68,970,606
Total Assets (2010) 82,302,173
Total Assets (2011) 91,921,066
Total Asset Turnover (2010) 0.77
Total Asset Turnover (2011) 0.75
Document Page
Compute the ratio that measures the relationship between
long-term debt and assets owned by the organization. ___________
Long-Term Debt to Capitalization % =
(Long-Term Debt x 100)/(Long-Term Debt + Net Assets)
Long-Term Debt (2010) 3,793,000
Long-Term Debt (2011) 2,593,125
Net Assets (2010) 57,956,189
Net Assets (2011) 67,250,222
Long-Term Debt to Capitalization % (2010) 6.14 %
Long-Term Debt to Capitalization % (2011) 5.43 %
Compute the ratio that measures profitability in relation to investment ___________
Return on Net Assets (Equity) % = 100*Excess of Revenues over Expenses/Net Assets
(Brigham and Michael, 2013)
Excess of Revenues over Expenses (2010) 9,154,417
Excess of Revenues over Expenses (2011) 10,819,664
Net Assets (2010) 57,956,189
Net Assets (2011) 67,250,222
Return on Net Assets (Equity) % 15.80%
Return on Net Assets (Equity) % 16.09%
Document Page
References
Brigham, F., and Michael C. 2013. Financial management: Theory & practice. Cengage
Learning.
Davies, T. and Crawford, I., 2011. Business accounting and finance. Pearson.
tabler-icon-diamond-filled.svg

Secure Best Marks with AI Grader

Need help grading? Try our AI Grader for instant feedback on your assignments.
Document Page
Appendix A
REGIONAL MEDICAL CENTER
BALANCE SHEETS – DECEMBER 31, 2011 AND 2010
ASSETS 2011 2010
CURRENT ASSETS:
Cash and cash equivalents $ 6,494,728 $ 8,543,654
Patient accounts receivable, less allowances for
Uncollectible accounts of $1,647,000 in 2000
And $1,619,000 in 1999 10,520,409 9,929,331
Other receivables 538,896 568,536
Inventories 1,638,954 2,038,655
Prepaid expenses and other 953,675 1,022,701
Total current assets 20,146,662 22,102,877
PREPAID LEASE EXPENSE 2,593,672 0
ASSETS WHOSE USE IS LIMITED 29,314,224 29,994,314
PROPERTY, PLANT AND EQUIPMENT, at cost:
Land and land improvements 2,471,453 2,355,844
Buildings and building improvements 40,076,296 35,429,854
Equipment 25,226,577 22,579,676
67,774,326 60,365,374
Less – Accumulated depreciation (34,964,454) (31,846,638)
32,809,872 28,518,736
Construction-in-progress 7,056,636 1,686,246
39,866,508 30,204,982
Total Assets $91,921,066 $82,302,173
Document Page
LIABILITIES AND FUND BALANCE (NET ASSETS)
CURRENT LIABILITIES:
Current portion of due to Central County $ 1,199,978 $ 1,140,000
Accounts payable 3,882,339 3,737,986
Accrued expenses 4,493,936 3,282,352
Deferred revenue 1,691,192 1,657,145
Other liabilities 10,810,274 10,735,501
Total current liabilities 22,077,719 20,552,984
LONG-TERM DEBT – Due to Central County 2,593,125 3,793,000
COMMITMENTS AND CONTINGENCIES (Notes 1, 8, & 9)
FUND BALANCE (NET ASSETS) 67,250,222 57,956,189
Total Liabilities and Fund Balance $91,921,066 $82,302,173
Document Page
REGIONAL MEDICAL CENTER
STATEMENTS OF OPERATIONS
FOR THE YEARS ENDED DECEMBER 31, 2011 AND 2010
2011 2010
NET PATIENT SERVICE REVENUE:
Inpatient revenue $43,780,215 $42,125,215
Outpatient revenue 23,754,566 19,725,616
Total net patient service revenue 67,534,781 61,850,831
OTHER REVENUE 1,435,825 1,279,101
Total revenue 68,970,606 63,129,932
OPERATING EXPENSES:
Employee compensation 33,543,072 30,085,245
Medical and general supplies 9,841,301 9,862,388
Purchased services 4,074,549 3,866,404
Professional fees 1,226,695 1,258,998
Utilities 1,203,874 1,091,509
Provision for uncollectible accounts 2,839,000 2,412,739
Depreciation and amortization 4,675,544 4,533,401
Interest 240,439 298,522
Other expenses 2,305,615 1,889,789
Total operating expenses 59,950,089 55,298,995
OPERATING INCOME 9,020,517 7,830,937
NET NONOPERATING INCOME 1,799,147 1,323,480
tabler-icon-diamond-filled.svg

Paraphrase This Document

Need a fresh take? Get an instant paraphrase of this document with our AI Paraphraser
Document Page
EXCESS REVENUE OVER EXPENSES 10,819,664 9,154,417
chevron_up_icon
1 out of 8
circle_padding
hide_on_mobile
zoom_out_icon
logo.png

Your All-in-One AI-Powered Toolkit for Academic Success.

Available 24*7 on WhatsApp / Email

[object Object]