Healthcare Performance Data Analysis Report: Australia & Canada
VerifiedAdded on 2020/05/28
|30
|5874
|73
Report
AI Summary
This report provides a comprehensive comparison of the healthcare systems in Australia and Canada. It begins with an executive summary outlining the key aspects of each system, including the roles of federal, state, and local governments in Australia, and the role of provinces and territories in Canada. The report then delves into funding systems, examining the percentage of GDP spent on healthcare in both countries, highlighting the universal coverage model in Canada and the Medicare system in Australia. Population health indicators such as maternal mortality rates, infant mortality rates, and life expectancy are compared, revealing key differences in outcomes. Health system performance indicators, including low birth weight, obesity, diabetes, asthma, hypertension, and cancer rates, are also analyzed. The report concludes with a discussion on the management of quality and safety within each healthcare system, ultimately presenting a comparative analysis to highlight strengths and weaknesses. Data was collected from government websites of both countries, the World Health Organization, and the World Bank. The report emphasizes Australia's superior patient access and favorable patient outcomes, despite Canada's higher healthcare expenditure relative to GDP. This report is contributed by a student to Desklib, a platform providing AI-based study tools.
Running head: HEALTHCARE PERFORMANCE DATA ANALYSIS
HEALTHCARE PERFORMANCE DATA ANALYSIS
Name of the Student
Name of the University
Author Notes
HEALTHCARE PERFORMANCE DATA ANALYSIS
Name of the Student
Name of the University
Author Notes
Paraphrase This Document
Need a fresh take? Get an instant paraphrase of this document with our AI Paraphraser
1HEALTHCARE PERFORMANCE DATA ANALYSIS
Executive summary
This report provides a comparison of the healthcare performance data of Australia and Canada.
The Australian government is responsible for healthcare services and involves the federal, state
or territory and local. It provides the Medicare benefits scheme and the pharmaceutical benefits
scheme. Local governments also play an important role in preventative care and community
health improvement. In Canada the provinces and the territories play an important role in
organizing and delivering healthcare services to the population. The Canada health Act forms the
basis of the healthcare services in Canada. The federal government maintains the safety and
efficacy of the healthcare services and also funds research. However, although there are
similarities between the healthcare systems, Australia is far ahead than Canada with respect to
patient access and favorable patient outcomes.
2HEALTHCARE PERFORMANCE DATA ANALYSIS
Table of Contents
Introduction......................................................................................................................................3
Funding systems and % GDP spent.................................................................................................4
Population health indicators............................................................................................................8
Maternal Mortality Rate..............................................................................................................8
Infant mortality rate.....................................................................................................................9
Life Expectancy at birth.............................................................................................................10
Health system performance indicators...........................................................................................11
Low birth weight........................................................................................................................11
Obesity.......................................................................................................................................13
Diabetes.....................................................................................................................................13
Asthma.......................................................................................................................................14
Hypertension..............................................................................................................................15
Cancer........................................................................................................................................17
Management of quality and safety in health systems....................................................................18
Conclusion.....................................................................................................................................19
Reference List................................................................................................................................21
⊘ This is a preview!⊘
Do you want full access?
Subscribe today to unlock all pages.
Trusted by 1+ million students worldwide
3HEALTHCARE PERFORMANCE DATA ANALYSIS
Introduction
Analysis of healthcare data is highly important as it helps to determine and measure the
efficiency of the healthcare sectors (Who.int, 2017). It is necessary to identify the opportunities
with respect to reducing the costs, bringing about improvements in quality and monitoring the
progress (Mosadeghrad, 2014; pp. 77). Regional health improvement collaborative plays an
important role in providing information with regards to health of a population, quality of
healthcare, costs associated with the delivery of healthcare services, health promotion strategies
and innovative methods of healthcare delivery (Nrhi.org, 2017). The performance measurements
of a healthcare sector is based on quality of the healthcare services, cost or funding of the
healthcare services, performance disparities, experiences of patients with regards to care, quality
of the services provided by physicians and the quality of the healthcare plan provided by the
healthcare organizations keeping in mind the status of the population and performance health
indicators (Mossialos, Wenzl, Osborn & Anderson, 2016).
Australia’s healthcare system sets as an example for the Canadian healthcare system. The
Australian healthcare systems are far reaching and are superior in quality as compared to the
Canadian healthcare systems with respect to access and favorable patient outcomes (Collier,
2013, pp. E251-252). Canada spends a huge amount of money in the healthcare sectors but
patients in Canada have to wait for a long time to obtain their treatments, thereby increasing the
patient waiting times (Marchildon, 2013). The health system of Australia has been ranked second
in the World after the United Kingdom, while it ranks first with respect to health outcomes and
administrative efficiency (Commonwealthfund.org, 2017). The data was collected using
Paraphrase This Document
Need a fresh take? Get an instant paraphrase of this document with our AI Paraphraser
4HEALTHCARE PERFORMANCE DATA ANALYSIS
government websites of Canada and Australia and also from the websites of the World Health
Organization, Commonwealth organization and World Bank. (Perfect introduction)
This report provides a health performance comparison between Australia and Canada based on
Funding systems and % GDP spent on the healthcare sectors, population health indicators and
health system performance indicators. Finally, it provides an overall comparison of the
healthcare systems of the two countries.
1. Funding systems and % GDP spent
Canada’s healthcare system is publicly funded and is dynamic with its universal coverage
which is provided to all individuals with respect to provision of medical treatments (Canada.ca,
2016). The principle of the health coverage system is based on need rather than the ability of an
individual to pay for the healthcare services (Health.gov.bc.ca, 2017). The public funding of the
healthcare system is carried out by obtaining revenues through provincial, territorial and federal
taxations. The territories and provinces obtain financial support from the Canada Health Act.
Moreover, the Canada Health Act also provides funding for the provision and delivery of
primary and other supplementary services to the citizens, members of the Canadian forces,
veterans who are eligible, refugees and federal penitentiaries inmates
(International.commonwealthfund.org, 2016). In order to support the publicly funded healthcare
systems, the Government carries out tax and cash transfers through the Canada Health Transfer
(Marchildon & Mou, 2014; pp. 209-223). Moreover, the Government also provides Equalization
payments and territorial financing to the healthcare organizations of the less developed provinces
and territories. The health expenditures vary in the various territories and provinces of Canada
due to the differences in the quality of services provided (International.commonwealthfund.org,
5HEALTHCARE PERFORMANCE DATA ANALYSIS
2016). The Canadian Government provides funding for medical treatments and preventative care
and health insurance coverage to all individuals irrespective of income, standard of living and
medical history. Canada department of health protects and promotes the health by using
regulatory and legislative frameworks in order to mitigate the health risks and identifying the
health benefits (Healthycanadians.gc.ca, 2016).
Health insurance is governed by the territories and provinces and a healthcare that
provides health coverage only to the individual residing in the particular province or territory.
Provinces like the British Columbia, Ontario and Alberta require healthcare premiums for the
healthcare services provided to the residential population. However, individuals are not denied
their due healthcare services due to inability to pay premiums (Canadian-healthcare.org, 2017).
Additional services provided are coverage for physiotherapy, prescription medicines and also
dental coverage. Private health insurance are also offered as benefit packages for employees and
incentives are provided for dental and vision care (Morgan, Law Daw Abraham & Martin, 2015;
pp. 491-497). In 2014, the total expenditure on healthcare represented as percentage GDP was
found to be 10.4%, 11.1% in the year 2016 and in 2017, the total healthcare expenditure in
Canada was 242 billion dollars and health spending was 11.5% of Canada’s gross domestic
product or GDP.
Similar to Canada, the Australian healthcare system is publicly funded with the help of
general taxations (Commonwealthfund.org, 2017). The Medicare services provide universal
access to individuals with regards to free treatments in public hospitals and also help to obtain
subsidies for various healthcare services (Hall, 2015; pp. 493-497). The healthcare expenditure
represents 9% of the GDP. The federal Government system of Australia is supported by the
Commonwealth government and by two territories and six states. The Australian states rely on
⊘ This is a preview!⊘
Do you want full access?
Subscribe today to unlock all pages.
Trusted by 1+ million students worldwide
6HEALTHCARE PERFORMANCE DATA ANALYSIS
the Commonwealth Government to raise funds and to carry out financial transfers. Moreover, a
Medicare levy helps to raise a small proportion of the healthcare funds. 43% of the total
healthcare expenditure is provided by the Commonwealth Government and 25% of the funding
is provided by other Government levels (Commonwealthfund.org, 2017). All Australians can get
free treatments in public hospitals as a public patient; however, private patients in public
hospitals face a range of “out of pocket charges”. The “Medical Benefits Schedule” provides
coverage to all out of hospital and in hospital medical services for the private patients. However,
the “Medical Benefits Schedule” also provides benefits for nursing based practices, dental,
psychology and other healthcare services used by patients (Kelly, Garvey, Biro & Lee, 2017, pp.
42). The Pharmaceutical benefits scheme helps to obtain drugs at subsidized rates at a particular
co-payment. The private health insurance schemes provide coverage for private treatments and
out of hospital services that are not supported by the Medicare (Mellish et al., 2015, pp. 634).
The health system in Australia consists of a web of healthcare providers both public and private,
healthcare settings, supporting systems and participants. The healthcare expenditure in 2013-
2014 was found to be 155 billion dollars (Aihw.gov.au, 2015). The funding involves the different
levels of Government, which includes the federal, state, territory, local and also non-government
organizations, private insurers and the public paying for their own healthcare services. The range
of services funded by the Governments includes the community healthcare services, population
healthcare programs, Aboriginal and Torres Strait Islander healthcare services and medical
research. Private health insurance are provided to those Australians who are able to fully or
partially bear the costs of hospital admission and other ancillary services. The National Disability
Insurance Scheme ensures a disability support for all individuals who are in need of this service
(Thill, 2015, pp. 15-28). In 2015-2016, the overall healthcare expenditure was 170.4 billion
Paraphrase This Document
Need a fresh take? Get an instant paraphrase of this document with our AI Paraphraser
7HEALTHCARE PERFORMANCE DATA ANALYSIS
dollars (Aihw.gov.au, 2016). The Ausltralian Government with the help of the Medicare
payments system also helps to remove some of the barriers of the Medical benefits schedule like
the bulk billing consultations of general practitioners. The Government also aims to increase
access to drugs by amending the Pharmaceutical benefits scheme. The Australian Government
through its Medicare Guarantee Fund received 33.8 million dollars in 2017-2018 to provide
funding for its Medical benefits schedule and Pharmaceutical benefits scheme expenditures
(Aph.gov.au, 2017).
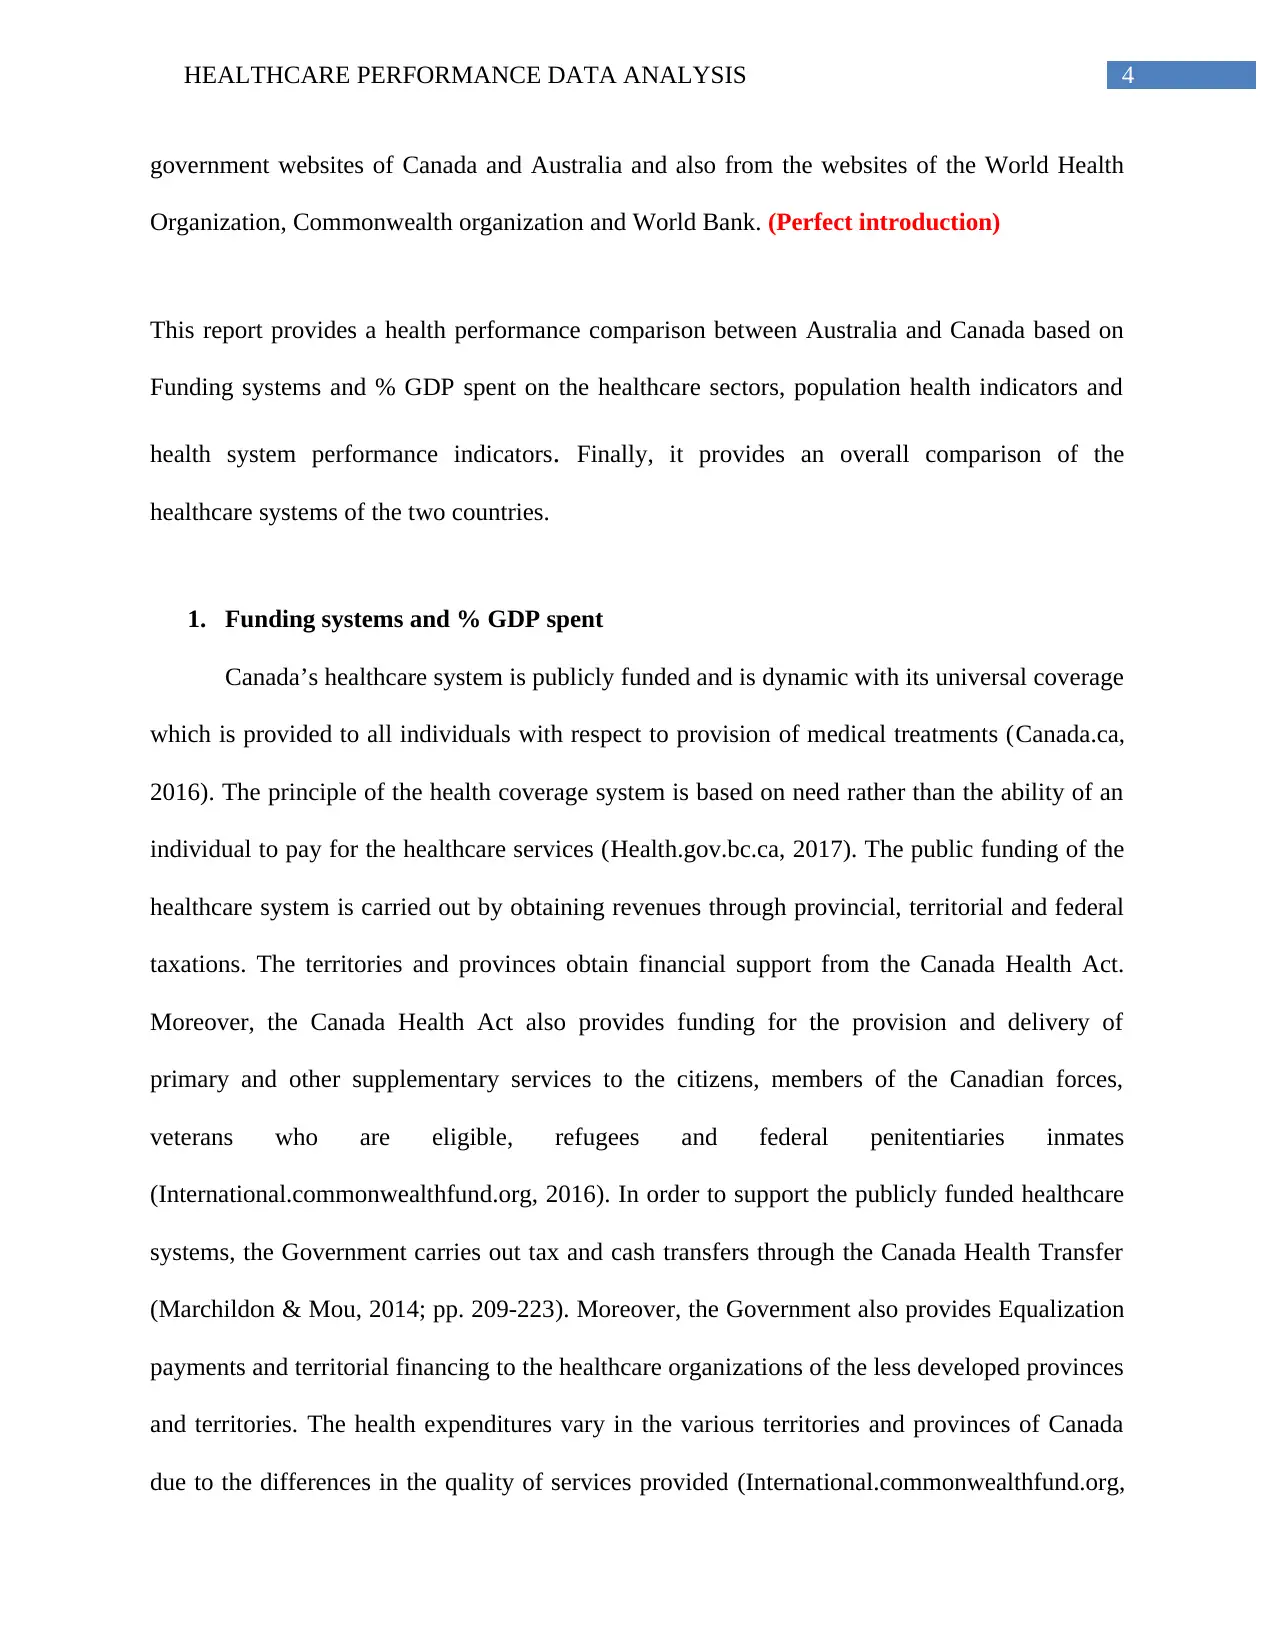
Thus, the funding of the healthcare systems are more or less similar in both the countries
with the presence of medicare and other insurance schemes, however, the percent GDP and
expenditure is different in the two countries with the highest expenditure observed in the case of
Canada as compared to that in Australia.
Canada Australia
8.8
9
9.2
9.4
9.6
9.8
10
10.2
10.4
10.6
% GDP spent
Percentage
Figure 1: Percentage GDP spent on healthcare in the year 2014. (Canada – 242 billion
dollars, Australia – 170.4 billion dollars)
World bank, 2017
dollars (Aihw.gov.au, 2016). The Ausltralian Government with the help of the Medicare
payments system also helps to remove some of the barriers of the Medical benefits schedule like
the bulk billing consultations of general practitioners. The Government also aims to increase
access to drugs by amending the Pharmaceutical benefits scheme. The Australian Government
through its Medicare Guarantee Fund received 33.8 million dollars in 2017-2018 to provide
funding for its Medical benefits schedule and Pharmaceutical benefits scheme expenditures
(Aph.gov.au, 2017).
Thus, the funding of the healthcare systems are more or less similar in both the countries
with the presence of medicare and other insurance schemes, however, the percent GDP and
expenditure is different in the two countries with the highest expenditure observed in the case of
Canada as compared to that in Australia.
Canada Australia
8.8
9
9.2
9.4
9.6
9.8
10
10.2
10.4
10.6
% GDP spent
Percentage
Figure 1: Percentage GDP spent on healthcare in the year 2014. (Canada – 242 billion
dollars, Australia – 170.4 billion dollars)
World bank, 2017
8HEALTHCARE PERFORMANCE DATA ANALYSIS
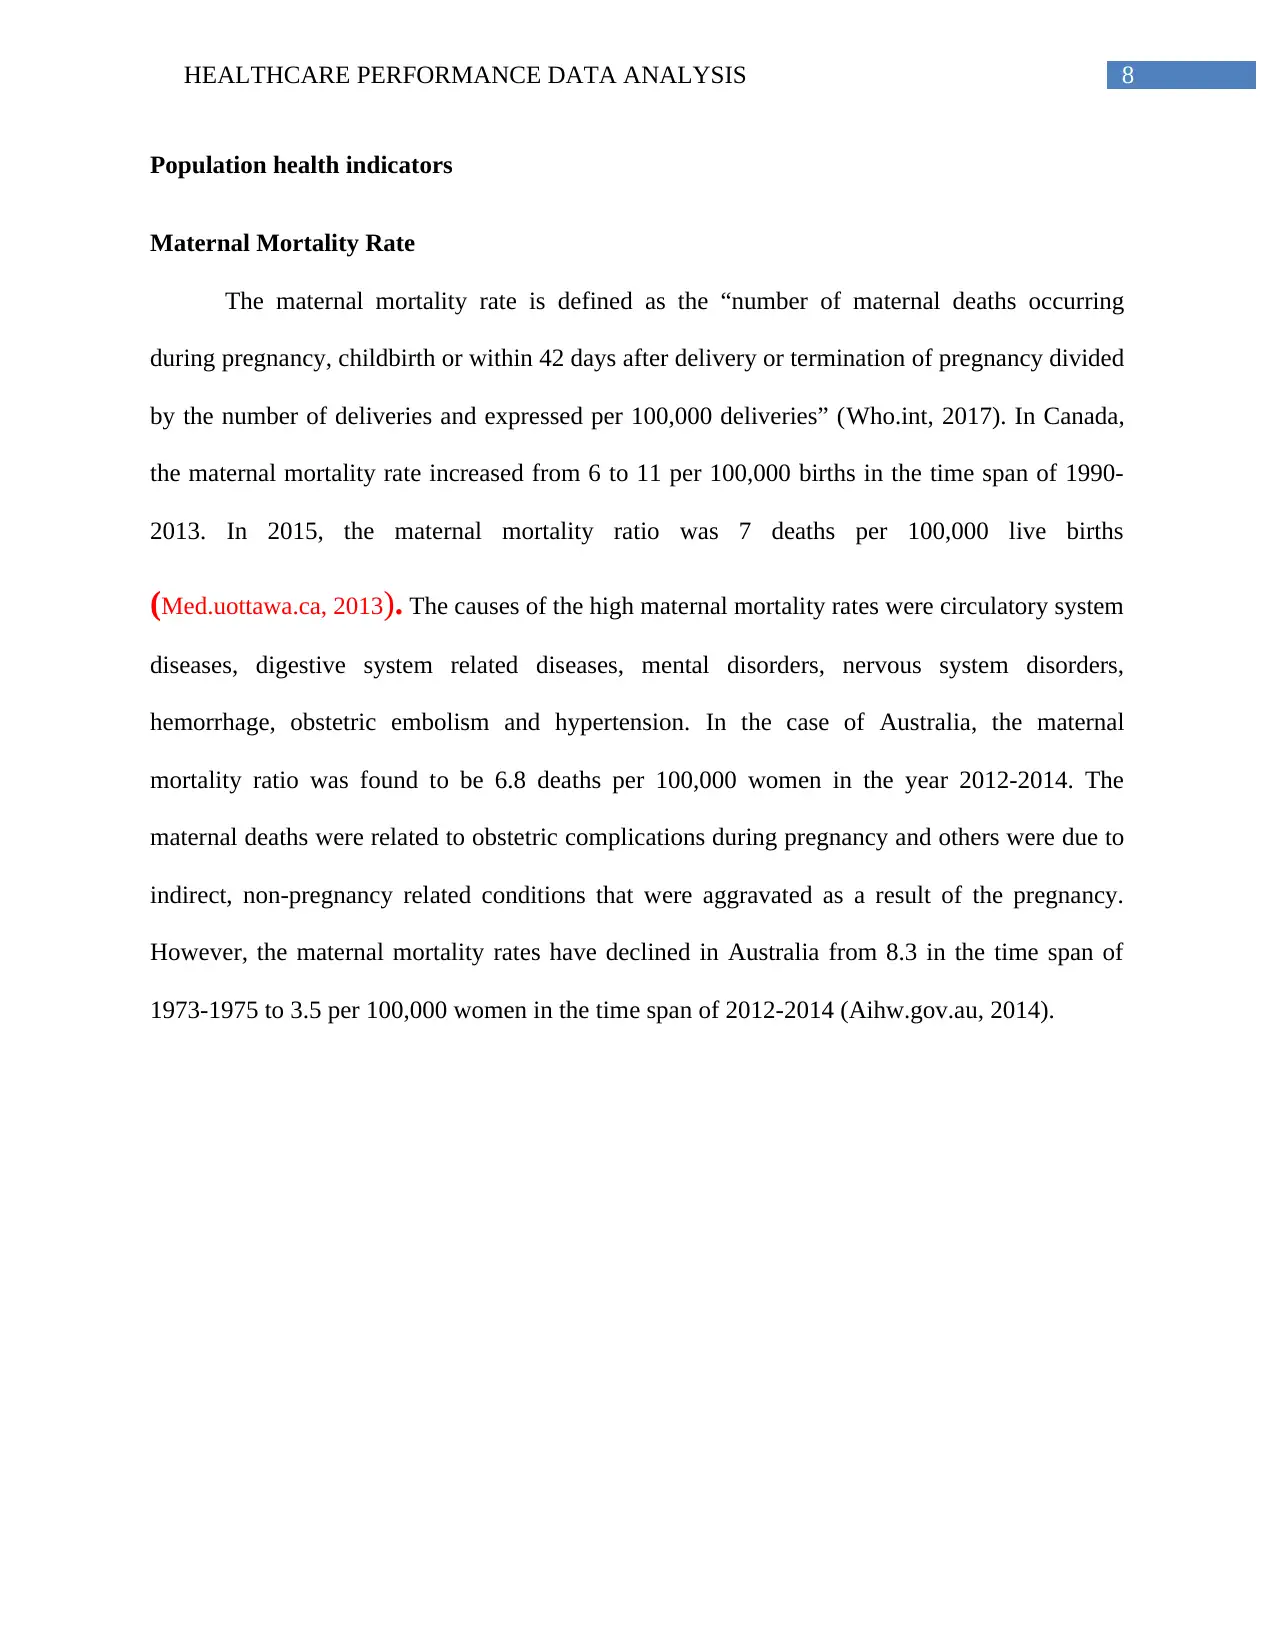
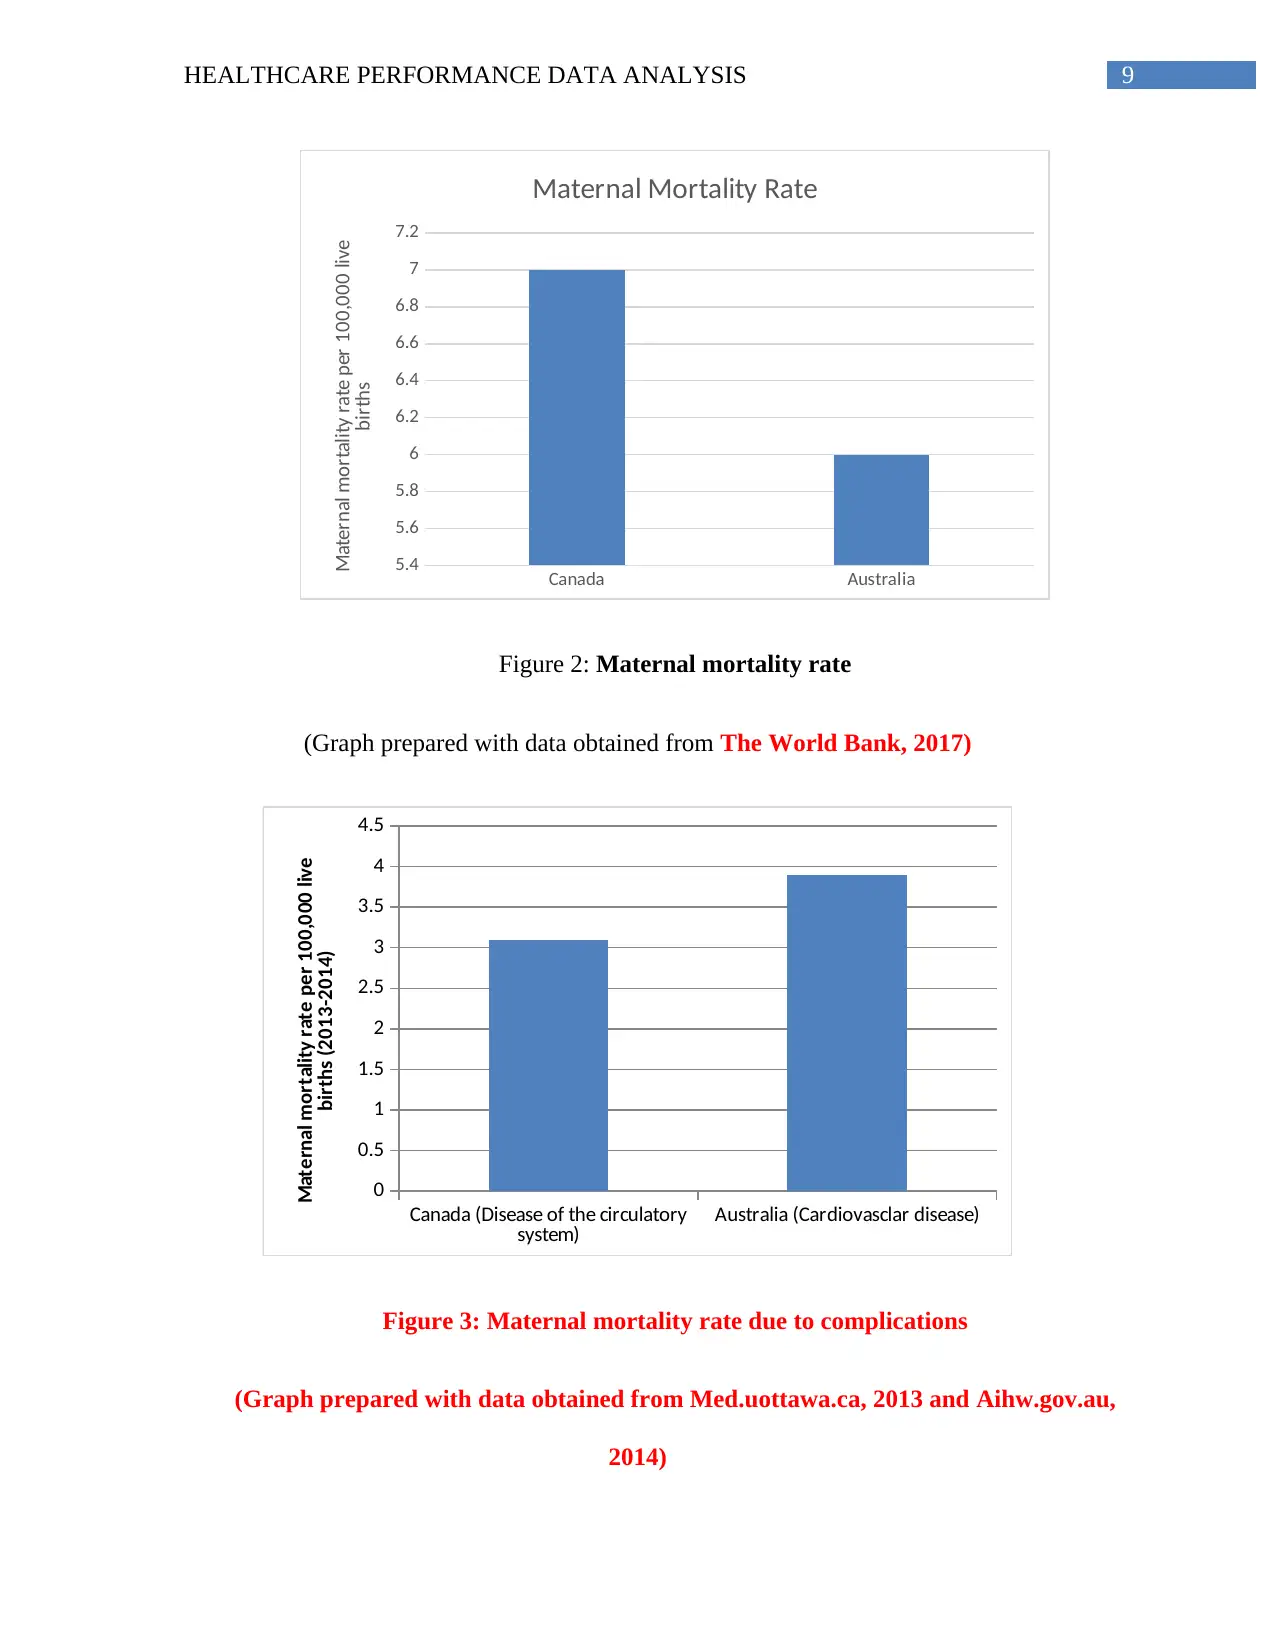
Population health indicators
Maternal Mortality Rate
The maternal mortality rate is defined as the “number of maternal deaths occurring
during pregnancy, childbirth or within 42 days after delivery or termination of pregnancy divided
by the number of deliveries and expressed per 100,000 deliveries” (Who.int, 2017). In Canada,
the maternal mortality rate increased from 6 to 11 per 100,000 births in the time span of 1990-
2013. In 2015, the maternal mortality ratio was 7 deaths per 100,000 live births
(Med.uottawa.ca, 2013). The causes of the high maternal mortality rates were circulatory system
diseases, digestive system related diseases, mental disorders, nervous system disorders,
hemorrhage, obstetric embolism and hypertension. In the case of Australia, the maternal
mortality ratio was found to be 6.8 deaths per 100,000 women in the year 2012-2014. The
maternal deaths were related to obstetric complications during pregnancy and others were due to
indirect, non-pregnancy related conditions that were aggravated as a result of the pregnancy.
However, the maternal mortality rates have declined in Australia from 8.3 in the time span of
1973-1975 to 3.5 per 100,000 women in the time span of 2012-2014 (Aihw.gov.au, 2014).
⊘ This is a preview!⊘
Do you want full access?
Subscribe today to unlock all pages.
Trusted by 1+ million students worldwide
9HEALTHCARE PERFORMANCE DATA ANALYSIS
Canada Australia
5.4
5.6
5.8
6
6.2
6.4
6.6
6.8
7
7.2
Maternal Mortality Rate
Maternal mortality rate per 100,000 live
births
Figure 2: Maternal mortality rate
(Graph prepared with data obtained from The World Bank, 2017)
Canada (Disease of the circulatory
system) Australia (Cardiovasclar disease)
0
0.5
1
1.5
2
2.5
3
3.5
4
4.5
Maternal mortality rate per 100,000 live
births (2013-2014)
Figure 3: Maternal mortality rate due to complications
(Graph prepared with data obtained from Med.uottawa.ca, 2013 and Aihw.gov.au,
2014)
Paraphrase This Document
Need a fresh take? Get an instant paraphrase of this document with our AI Paraphraser
10HEALTHCARE PERFORMANCE DATA ANALYSIS
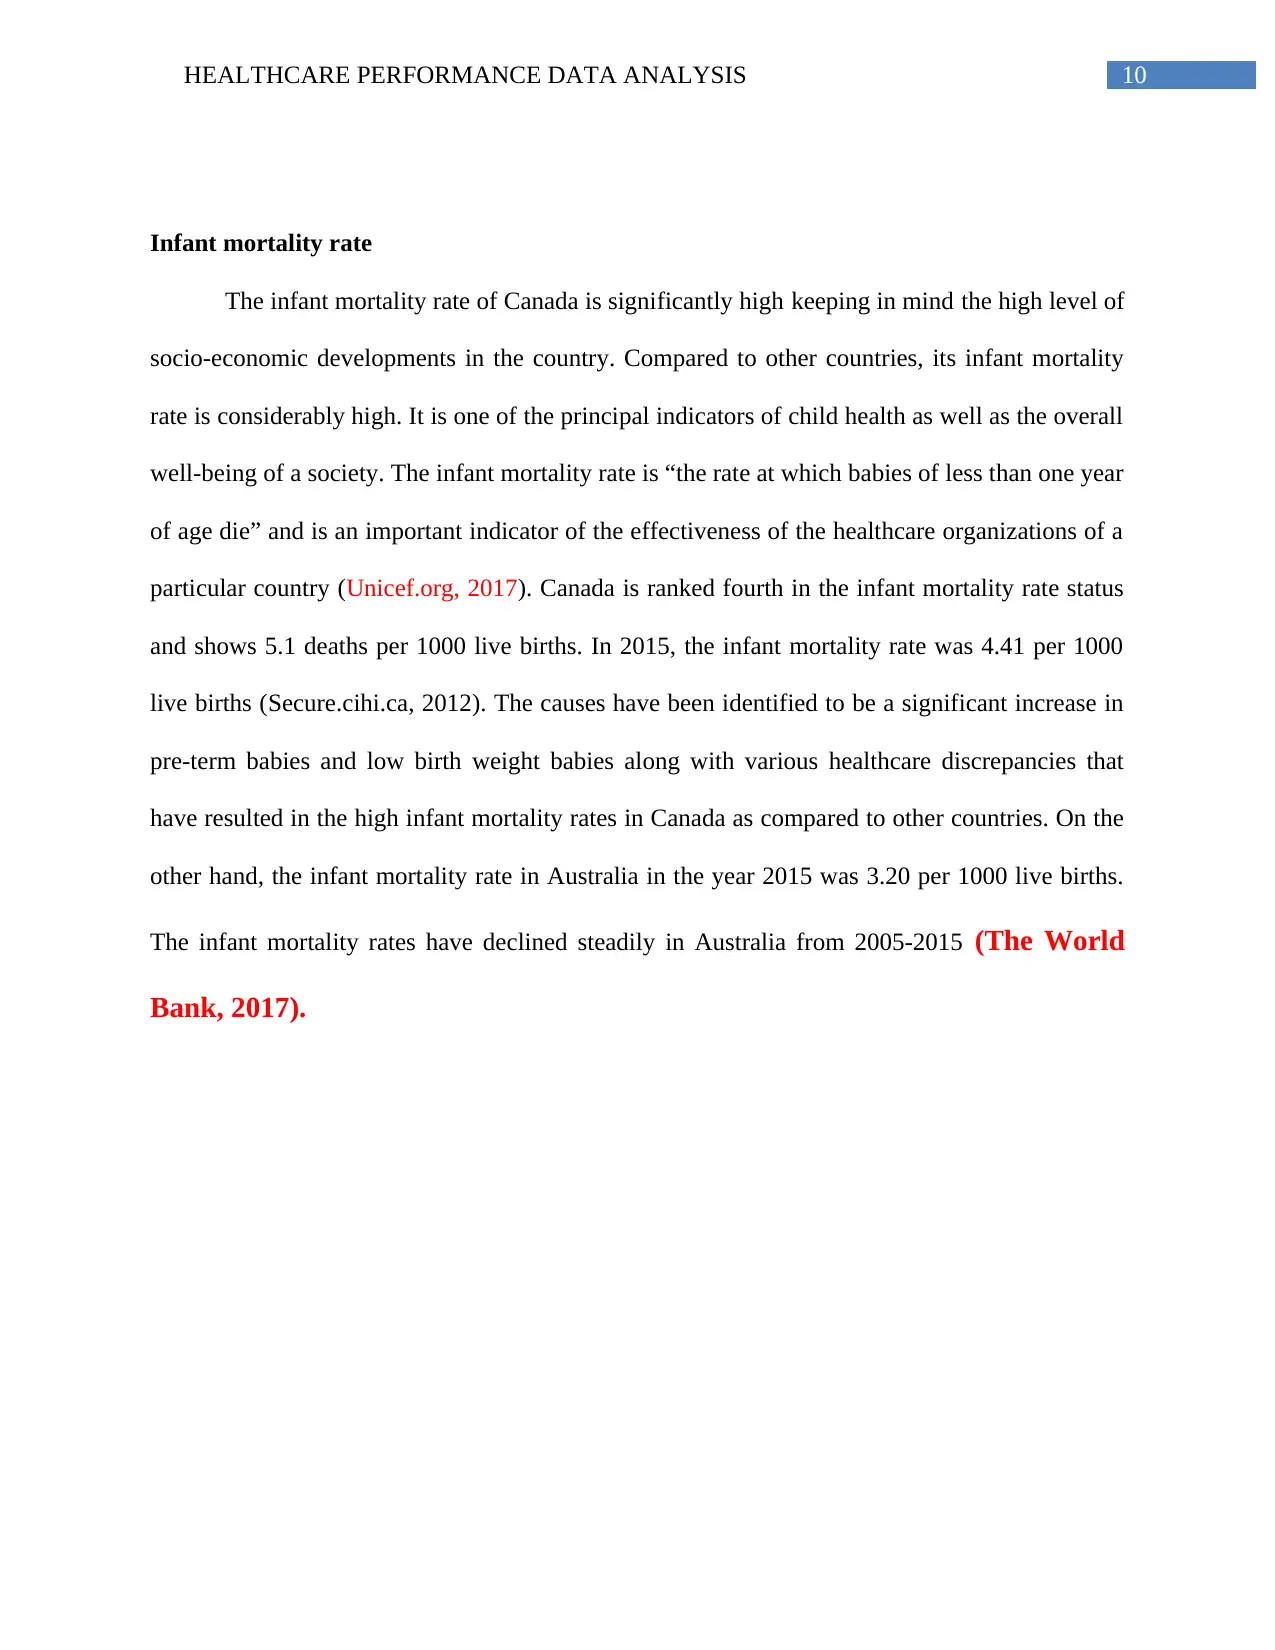
Infant mortality rate
The infant mortality rate of Canada is significantly high keeping in mind the high level of
socio-economic developments in the country. Compared to other countries, its infant mortality
rate is considerably high. It is one of the principal indicators of child health as well as the overall
well-being of a society. The infant mortality rate is “the rate at which babies of less than one year
of age die” and is an important indicator of the effectiveness of the healthcare organizations of a
particular country (Unicef.org, 2017). Canada is ranked fourth in the infant mortality rate status
and shows 5.1 deaths per 1000 live births. In 2015, the infant mortality rate was 4.41 per 1000
live births (Secure.cihi.ca, 2012). The causes have been identified to be a significant increase in
pre-term babies and low birth weight babies along with various healthcare discrepancies that
have resulted in the high infant mortality rates in Canada as compared to other countries. On the
other hand, the infant mortality rate in Australia in the year 2015 was 3.20 per 1000 live births.
The infant mortality rates have declined steadily in Australia from 2005-2015 (The World
Bank, 2017).
11HEALTHCARE PERFORMANCE DATA ANALYSIS
Canada Australia
0
0.5
1
1.5
2
2.5
3
3.5
4
4.5
5
Infant mortality rate due to congenital
malformations
Mortality rate per 100,000 live births in
the year 2016
Figure 3: Infant mortality rate
(Graph prepared with data obtained from The World Bank, 2017)
Life Expectancy at birth
Life expectancy at birth is defined as “how long on average a newborn can expect to live,
if current death rates do not change” (Who.int, 2017). Life expectancy is one of the most
important indicators of the health status of a country. It is represented as a total per gender and is
measured in years. According to the World Bank, the life expectancy rates are same for both
Australia and Canada, which is 82 years in 2015 that has improved from 71 years as was
reported in 1960. Both countries have experienced dramatic improvements in their life
expectancies at birth over the recent years (The World Bank, 2017).
⊘ This is a preview!⊘
Do you want full access?
Subscribe today to unlock all pages.
Trusted by 1+ million students worldwide
1 out of 30
Related Documents


Your All-in-One AI-Powered Toolkit for Academic Success.
+13062052269
info@desklib.com
Available 24*7 on WhatsApp / Email
![[object Object]](/_next/static/media/star-bottom.7253800d.svg)
Unlock your academic potential
Copyright © 2020–2026 A2Z Services. All Rights Reserved. Developed and managed by ZUCOL.