Final Exam: Healthcare Research, Chapters 1-12, Questions
VerifiedAdded on 2022/09/28
|14
|4734
|20
Quiz and Exam
AI Summary
This document presents the solutions to a final exam in healthcare research, encompassing multiple-choice and true/false questions derived from chapters 1-12. The exam covers various topics, including clinical trial design, randomization, prevalence calculations, variable types, sensitivity analysis, confidence intervals, hypothesis testing, and statistical significance. The questions assess understanding of study design, statistical methods, and interpretation of results. Specific questions address topics such as exclusion criteria in clinical trials, the definition of randomization, prevalence calculations, interpreting sensitivity and confidence intervals, and hypothesis testing. The answers demonstrate the application of statistical concepts to real-world healthcare scenarios and research findings.

Final Exam Week 8
Chapters 1-12
44 questions, 200 points
Place answers here
1.D 23.True
2.C 24.True
3.D 25.False
4.C 26.True
5.B 27.False
6.B 28. C.I =[27.93,35.40]
7.A 29.35
8.D 30. S.D=5.883
9.D 31. The value of z is -20.27 The value of p is < .00001. The result is significant at p < .05
10.True 32. P>.05 hence not statistically significant.There is there no statistical evidence of a lower mean PEF in
children with chronic bronchitis at alpha=.05
11.True 33. Conclusion:Since the p-value is less than 5%, reject Ho.There is a statistical difference in the proportions.
12.False 34. C.I =[-13.056, -3.744]
13.True 35. Yes. p<.05 hence there is a significant difference among the treatments at alpha=.05
14.True 36. The result is not significant at alpha=.05 since p > .05.
15.True 37. The value of z is -1.4676. The value of p is .14156. The result is not significant at p < .05.
16.True 38.
Source of Variation SS df MS F
Between Groups 1524.4 3 508.133 2.186
Within Groups 3719.48 16 232.468
Total 5,243.88 19
P=.129
17.False 39. No.There is no significant increase in body weight following supplementation t(5)=-
0.5,p>.05
18.True 40. p-value equals 0.1797, Since p-value > α, H0 is accepted. There is therefore no significant
difference in self-reported improvement in pain
19.False 41. No.There is no statistical significant difference (p>.05) in the characteristics shown among the
treatments .The age, female and annual income.
However significant differences were observed in insurance and disease stage (p<.05)
20.False 42. Chi-square test
21.False 43. Mean 1196.25
Standard deviation=1806.828
Median=580
Paraphrase This Document
Need a fresh take? Get an instant paraphrase of this document with our AI Paraphraser
First Quartile=427.5
Third Quartile=825
22.False 44. No.There is no statistical significant difference (p>.05) in the mean age,highschool education and Systolic
Blood Pressure between the placebo and experimental group.
Multiple Choice
1. Which of the following individuals is likely to be excluded from a clinical trial?
A) An individual with other diseases besides the disease of interest.
B) An individual whose data is considered to be an outlier.
C) An individual of who is considered to be a minority.
D) An individual who will have difficulty complying trial protocols.
2. Randomization in a clinical trial is defined as which of the following?
A) The process by which individuals are coupled into groups for comparison in order to minimize bias and
confounding.
B) The process by which individuals are assigned a number and are selected through the usage of a pattern which
minimizes bias and confounding.
C) The process by which individuals are randomly assigned to a treatment or control group which minimizes bias
and confounding.
D) The process by which individuals are asked to volunteer for a study which minimizes bias and confounding.
3. Assuming 50,000 individuals in the United States are diagnosed every year, and of those individuals diagnosed
with HIV each year, approximately 33,500 individuals diagnosed with HIV are gay or bisexual males. What
prevalence of the new HIV cases are from members of the population of gay or bisexual males?
A) 0.67%
B) 6.70%
C) 33.0%
D) 67.0%
4. Ethnicity is best described as which type of variable?
A) Dichotomous variable
B) Ordinal variable
C) Categorical variable
D) Continuous variable
5. A researcher wants to determine the sensitivity of mammograms to determine how effective they are at
diagnosing women who have breast cancer. Assume the researcher obtained the above results from a study, calculate
and interpret the sensitivity of mammograms for detecting breast cancer.
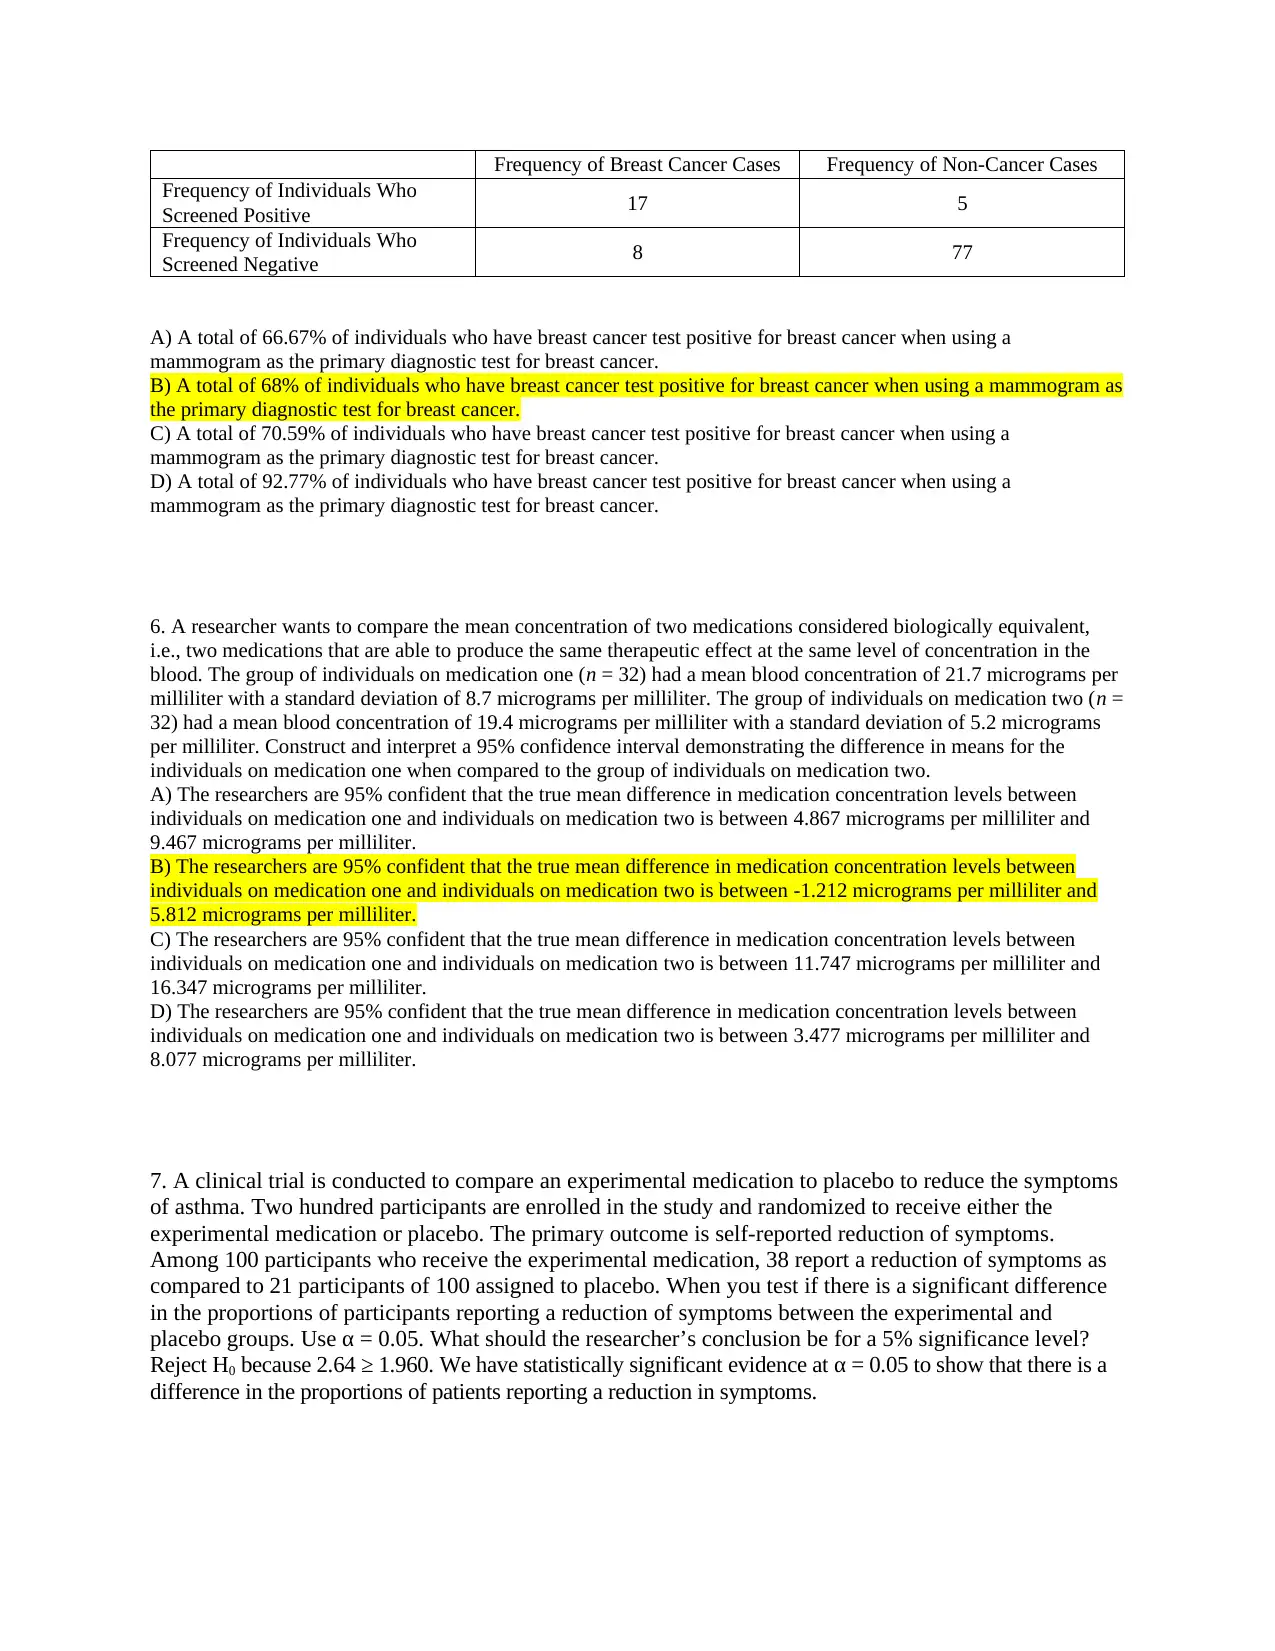
Frequency of Breast Cancer Cases Frequency of Non-Cancer Cases
Frequency of Individuals Who
Screened Positive 17 5
Frequency of Individuals Who
Screened Negative 8 77
A) A total of 66.67% of individuals who have breast cancer test positive for breast cancer when using a
mammogram as the primary diagnostic test for breast cancer.
B) A total of 68% of individuals who have breast cancer test positive for breast cancer when using a mammogram as
the primary diagnostic test for breast cancer.
C) A total of 70.59% of individuals who have breast cancer test positive for breast cancer when using a
mammogram as the primary diagnostic test for breast cancer.
D) A total of 92.77% of individuals who have breast cancer test positive for breast cancer when using a
mammogram as the primary diagnostic test for breast cancer.
6. A researcher wants to compare the mean concentration of two medications considered biologically equivalent,
i.e., two medications that are able to produce the same therapeutic effect at the same level of concentration in the
blood. The group of individuals on medication one (n = 32) had a mean blood concentration of 21.7 micrograms per
milliliter with a standard deviation of 8.7 micrograms per milliliter. The group of individuals on medication two (n =
32) had a mean blood concentration of 19.4 micrograms per milliliter with a standard deviation of 5.2 micrograms
per milliliter. Construct and interpret a 95% confidence interval demonstrating the difference in means for the
individuals on medication one when compared to the group of individuals on medication two.
A) The researchers are 95% confident that the true mean difference in medication concentration levels between
individuals on medication one and individuals on medication two is between 4.867 micrograms per milliliter and
9.467 micrograms per milliliter.
B) The researchers are 95% confident that the true mean difference in medication concentration levels between
individuals on medication one and individuals on medication two is between -1.212 micrograms per milliliter and
5.812 micrograms per milliliter.
C) The researchers are 95% confident that the true mean difference in medication concentration levels between
individuals on medication one and individuals on medication two is between 11.747 micrograms per milliliter and
16.347 micrograms per milliliter.
D) The researchers are 95% confident that the true mean difference in medication concentration levels between
individuals on medication one and individuals on medication two is between 3.477 micrograms per milliliter and
8.077 micrograms per milliliter.
7. A clinical trial is conducted to compare an experimental medication to placebo to reduce the symptoms
of asthma. Two hundred participants are enrolled in the study and randomized to receive either the
experimental medication or placebo. The primary outcome is self-reported reduction of symptoms.
Among 100 participants who receive the experimental medication, 38 report a reduction of symptoms as
compared to 21 participants of 100 assigned to placebo. When you test if there is a significant difference
in the proportions of participants reporting a reduction of symptoms between the experimental and
placebo groups. Use α = 0.05. What should the researcher’s conclusion be for a 5% significance level?
Reject H0 because 2.64 ≥ 1.960. We have statistically significant evidence at α = 0.05 to show that there is a
difference in the proportions of patients reporting a reduction in symptoms.
Frequency of Individuals Who
Screened Positive 17 5
Frequency of Individuals Who
Screened Negative 8 77
A) A total of 66.67% of individuals who have breast cancer test positive for breast cancer when using a
mammogram as the primary diagnostic test for breast cancer.
B) A total of 68% of individuals who have breast cancer test positive for breast cancer when using a mammogram as
the primary diagnostic test for breast cancer.
C) A total of 70.59% of individuals who have breast cancer test positive for breast cancer when using a
mammogram as the primary diagnostic test for breast cancer.
D) A total of 92.77% of individuals who have breast cancer test positive for breast cancer when using a
mammogram as the primary diagnostic test for breast cancer.
6. A researcher wants to compare the mean concentration of two medications considered biologically equivalent,
i.e., two medications that are able to produce the same therapeutic effect at the same level of concentration in the
blood. The group of individuals on medication one (n = 32) had a mean blood concentration of 21.7 micrograms per
milliliter with a standard deviation of 8.7 micrograms per milliliter. The group of individuals on medication two (n =
32) had a mean blood concentration of 19.4 micrograms per milliliter with a standard deviation of 5.2 micrograms
per milliliter. Construct and interpret a 95% confidence interval demonstrating the difference in means for the
individuals on medication one when compared to the group of individuals on medication two.
A) The researchers are 95% confident that the true mean difference in medication concentration levels between
individuals on medication one and individuals on medication two is between 4.867 micrograms per milliliter and
9.467 micrograms per milliliter.
B) The researchers are 95% confident that the true mean difference in medication concentration levels between
individuals on medication one and individuals on medication two is between -1.212 micrograms per milliliter and
5.812 micrograms per milliliter.
C) The researchers are 95% confident that the true mean difference in medication concentration levels between
individuals on medication one and individuals on medication two is between 11.747 micrograms per milliliter and
16.347 micrograms per milliliter.
D) The researchers are 95% confident that the true mean difference in medication concentration levels between
individuals on medication one and individuals on medication two is between 3.477 micrograms per milliliter and
8.077 micrograms per milliliter.
7. A clinical trial is conducted to compare an experimental medication to placebo to reduce the symptoms
of asthma. Two hundred participants are enrolled in the study and randomized to receive either the
experimental medication or placebo. The primary outcome is self-reported reduction of symptoms.
Among 100 participants who receive the experimental medication, 38 report a reduction of symptoms as
compared to 21 participants of 100 assigned to placebo. When you test if there is a significant difference
in the proportions of participants reporting a reduction of symptoms between the experimental and
placebo groups. Use α = 0.05. What should the researcher’s conclusion be for a 5% significance level?
Reject H0 because 2.64 ≥ 1.960. We have statistically significant evidence at α = 0.05 to show that there is a
difference in the proportions of patients reporting a reduction in symptoms.
⊘ This is a preview!⊘
Do you want full access?
Subscribe today to unlock all pages.
Trusted by 1+ million students worldwide
A) We reject H0 at the 5% level because 2.64 is greater than 1.96. We do have statistically significant
evidence at α = 0.05 to show that there is a difference in the proportions of patients reporting a reduction in
symptoms.
B) We fail to reject H0 at the 5% because -2.64 is less than 1.645. We do not have statistically significant
evidence to show that there is a difference in the proportions of patients reporting a reduction in symptoms.
C) We fail to reject H0 at the 5% because -2.64 is less than 1.96. We do have statistically significant
evidence at α = 0.05 to show that there is a difference in the proportions of patients reporting a reduction in
symptoms.
D) We fail to reject H0 at the 5% because 2.64 is greater than -1.645. We do have statistically significant
evidence at α = 0.05 to show that there is a difference in the proportions of patients reporting a reduction in
symptoms.
8. A clinical trial is being conducted in order to determine the efficacy of a new drug used to treat Rheumatoid
arthritis. The efficacy of the medication will not only be determined by the physical improvement of symptoms but
also by using a blood test to examine the concentration C-reactive protein (an inflammatory marker) in an
individual’s blood. If the researcher wants a margin of error for the level of C-reactive protein to be less than or
equal to 3.0 mg/dL, and if the standard deviation for C-reactive protein concentrations among arthritis patients was
previously documented at 8 mg/dL, how many patients should be recruited for each group in the study assuming a
95% confidence interval will be used to quantify the mean differences between the control group and the treatment
group?
A) n for the treatment group = 112; n for the control group = 111
B) n for the treatment group = 56; n for the control group = 57
C) n for the treatment group = 55; n for the control group = 55
D) n for the treatment group = 112; n for the control group = 112
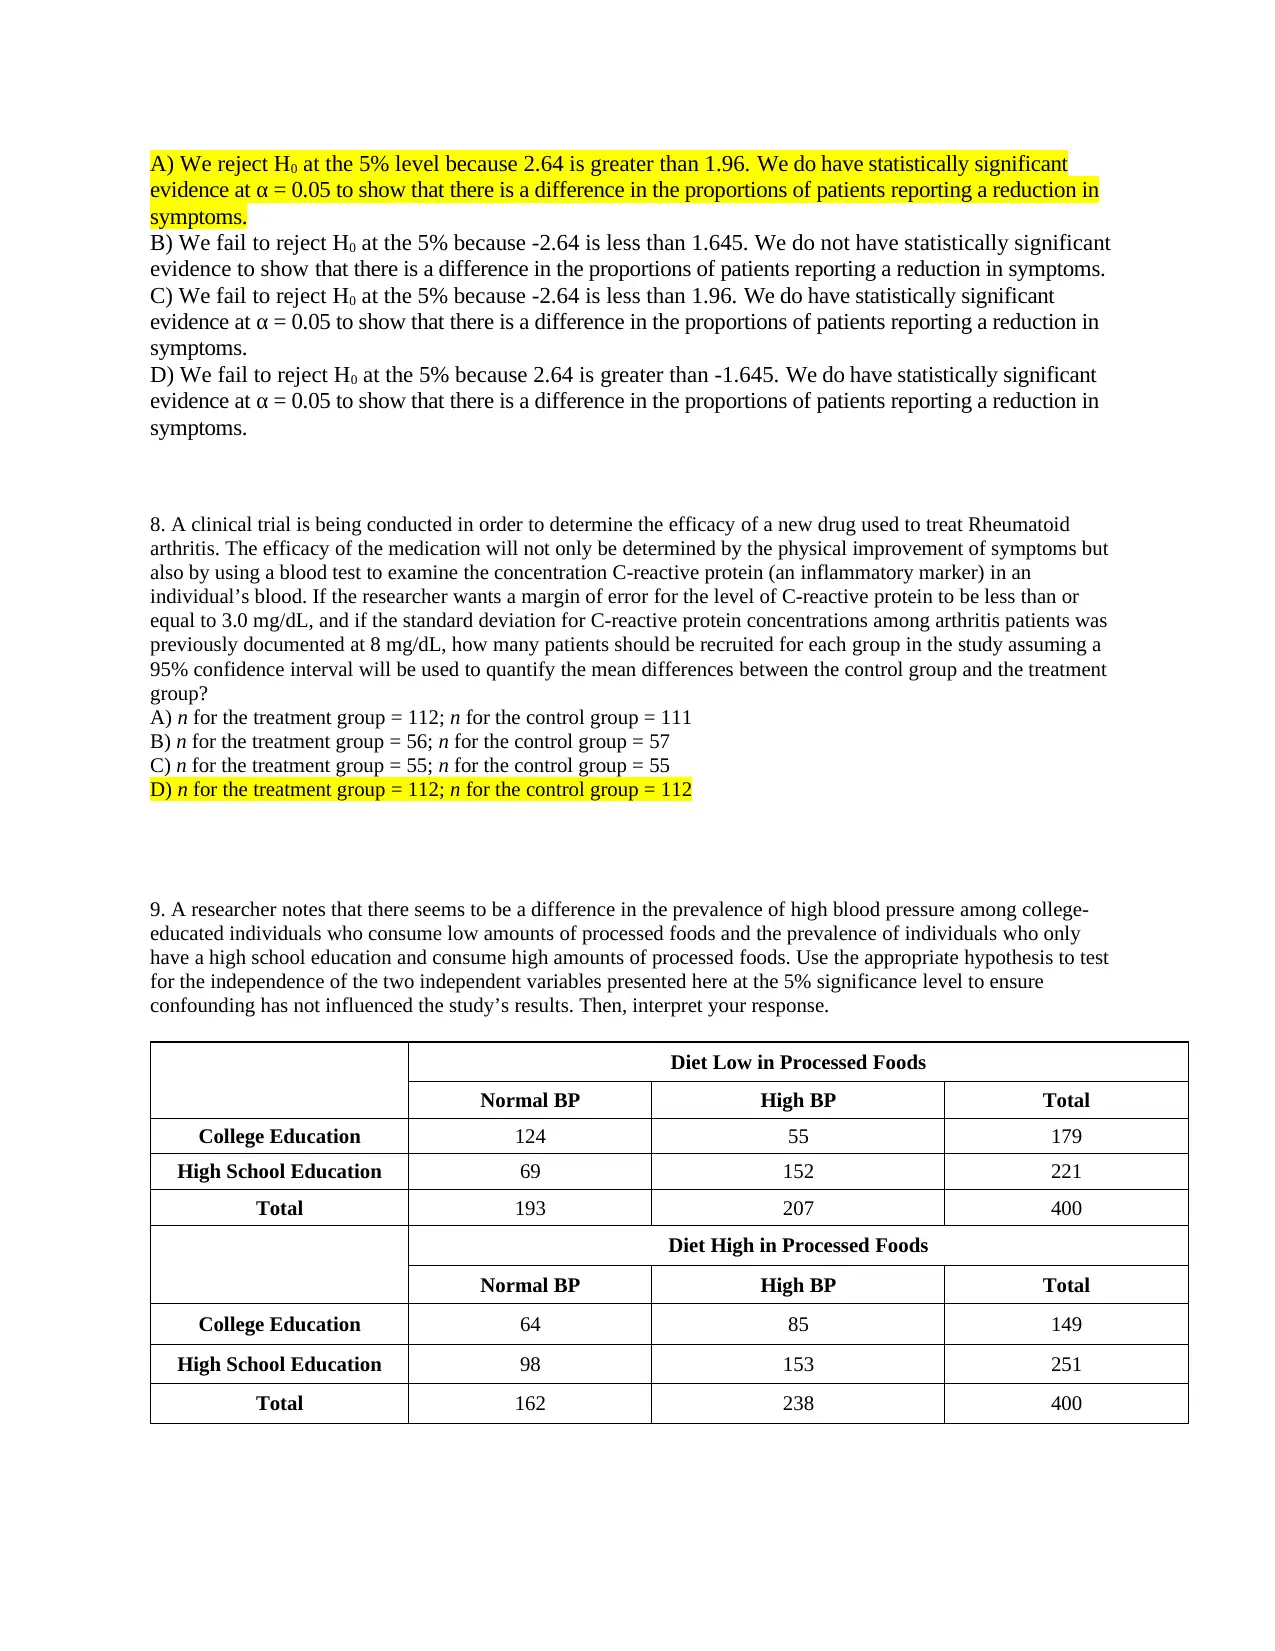
9. A researcher notes that there seems to be a difference in the prevalence of high blood pressure among college-
educated individuals who consume low amounts of processed foods and the prevalence of individuals who only
have a high school education and consume high amounts of processed foods. Use the appropriate hypothesis to test
for the independence of the two independent variables presented here at the 5% significance level to ensure
confounding has not influenced the study’s results. Then, interpret your response.
Diet Low in Processed Foods
Normal BP High BP Total
College Education 124 55 179
High School Education 69 152 221
Total 193 207 400
Diet High in Processed Foods
Normal BP High BP Total
College Education 64 85 149
High School Education 98 153 251
Total 162 238 400
evidence at α = 0.05 to show that there is a difference in the proportions of patients reporting a reduction in
symptoms.
B) We fail to reject H0 at the 5% because -2.64 is less than 1.645. We do not have statistically significant
evidence to show that there is a difference in the proportions of patients reporting a reduction in symptoms.
C) We fail to reject H0 at the 5% because -2.64 is less than 1.96. We do have statistically significant
evidence at α = 0.05 to show that there is a difference in the proportions of patients reporting a reduction in
symptoms.
D) We fail to reject H0 at the 5% because 2.64 is greater than -1.645. We do have statistically significant
evidence at α = 0.05 to show that there is a difference in the proportions of patients reporting a reduction in
symptoms.
8. A clinical trial is being conducted in order to determine the efficacy of a new drug used to treat Rheumatoid
arthritis. The efficacy of the medication will not only be determined by the physical improvement of symptoms but
also by using a blood test to examine the concentration C-reactive protein (an inflammatory marker) in an
individual’s blood. If the researcher wants a margin of error for the level of C-reactive protein to be less than or
equal to 3.0 mg/dL, and if the standard deviation for C-reactive protein concentrations among arthritis patients was
previously documented at 8 mg/dL, how many patients should be recruited for each group in the study assuming a
95% confidence interval will be used to quantify the mean differences between the control group and the treatment
group?
A) n for the treatment group = 112; n for the control group = 111
B) n for the treatment group = 56; n for the control group = 57
C) n for the treatment group = 55; n for the control group = 55
D) n for the treatment group = 112; n for the control group = 112
9. A researcher notes that there seems to be a difference in the prevalence of high blood pressure among college-
educated individuals who consume low amounts of processed foods and the prevalence of individuals who only
have a high school education and consume high amounts of processed foods. Use the appropriate hypothesis to test
for the independence of the two independent variables presented here at the 5% significance level to ensure
confounding has not influenced the study’s results. Then, interpret your response.
Diet Low in Processed Foods
Normal BP High BP Total
College Education 124 55 179
High School Education 69 152 221
Total 193 207 400
Diet High in Processed Foods
Normal BP High BP Total
College Education 64 85 149
High School Education 98 153 251
Total 162 238 400
Paraphrase This Document
Need a fresh take? Get an instant paraphrase of this document with our AI Paraphraser
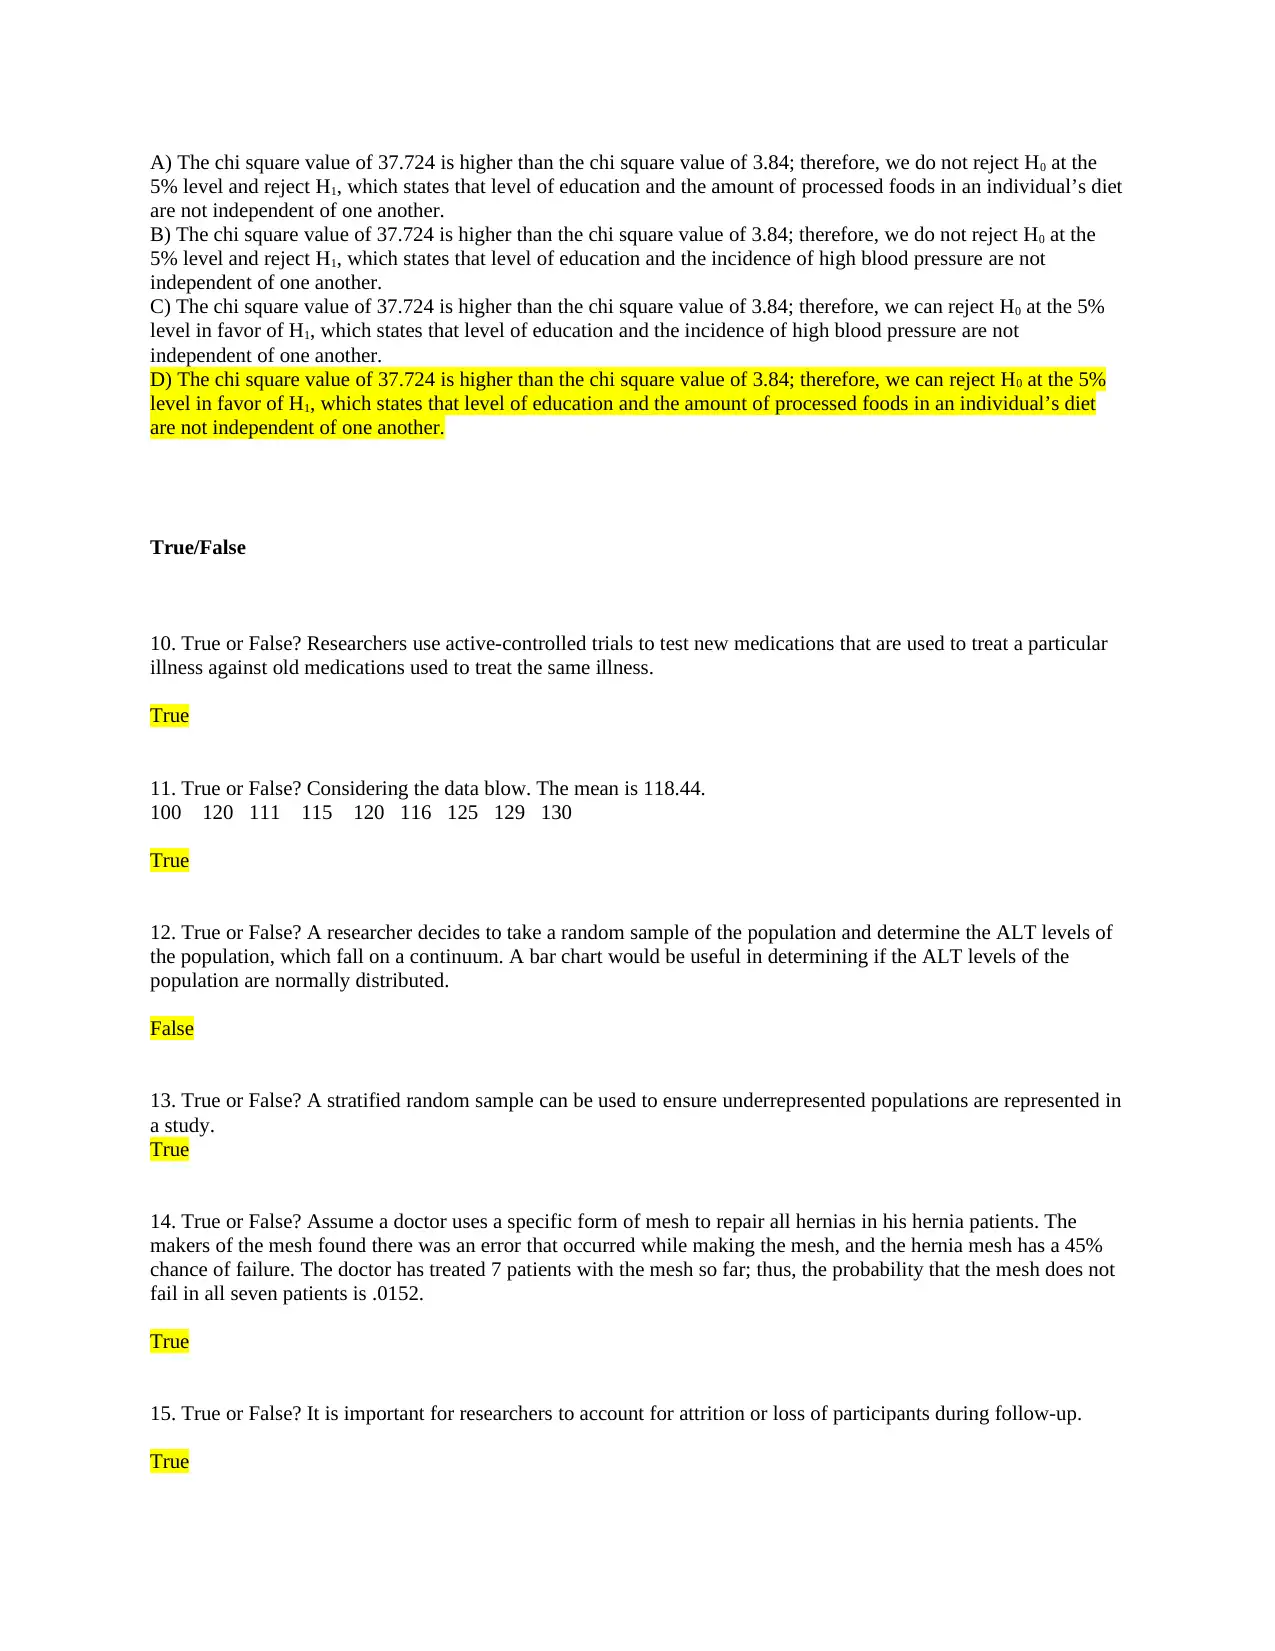
A) The chi square value of 37.724 is higher than the chi square value of 3.84; therefore, we do not reject H0 at the
5% level and reject H1, which states that level of education and the amount of processed foods in an individual’s diet
are not independent of one another.
B) The chi square value of 37.724 is higher than the chi square value of 3.84; therefore, we do not reject H0 at the
5% level and reject H1, which states that level of education and the incidence of high blood pressure are not
independent of one another.
C) The chi square value of 37.724 is higher than the chi square value of 3.84; therefore, we can reject H0 at the 5%
level in favor of H1, which states that level of education and the incidence of high blood pressure are not
independent of one another.
D) The chi square value of 37.724 is higher than the chi square value of 3.84; therefore, we can reject H0 at the 5%
level in favor of H1, which states that level of education and the amount of processed foods in an individual’s diet
are not independent of one another.
True/False
10. True or False? Researchers use active-controlled trials to test new medications that are used to treat a particular
illness against old medications used to treat the same illness.
True
11. True or False? Considering the data blow. The mean is 118.44.
100 120 111 115 120 116 125 129 130
True
12. True or False? A researcher decides to take a random sample of the population and determine the ALT levels of
the population, which fall on a continuum. A bar chart would be useful in determining if the ALT levels of the
population are normally distributed.
False
13. True or False? A stratified random sample can be used to ensure underrepresented populations are represented in
a study.
True
14. True or False? Assume a doctor uses a specific form of mesh to repair all hernias in his hernia patients. The
makers of the mesh found there was an error that occurred while making the mesh, and the hernia mesh has a 45%
chance of failure. The doctor has treated 7 patients with the mesh so far; thus, the probability that the mesh does not
fail in all seven patients is .0152.
True
15. True or False? It is important for researchers to account for attrition or loss of participants during follow-up.
True

16. True or False? An r value of .8 indicates a strong positive correlation.
True
17. True or False? When performing a Mann-Whitney U test, one should always use the higher value of the
calculated U values to compare to the critical U value while making the decision rule.
False
18. True or False? Considering the data blow. The median is 120.
100 120 111 115 120 116 125 129 130
True
19. True or False? The margin of error is always greater than or equal to the standard error.
False
20. True or False? If a test is run and p = 0.0356, then we can reject H0 at = 0.01.
False
21. True or False? If a 95% confidence interval for the difference in two independent means is (-4.5 to 2.1), then the
point estimate is -2.1.
False
22. True or False? If a 95% confidence interval for the difference in two independent means is (2.1 to 4.5), there is
no significant difference in means.
False
23. True or False? If a 90% confidence interval for the mean is (75.3 to 80.9), we would reject H0: =70 in favor
of H1: ≠ 70 at = 0.05.
True
24. True or False? In logistic regression, the predictors are dichotomous, and the outcome is a continuous variable.
True
25. True or False? The level of significance is the probability that we reject the null hypothesis (in favor of the
alternative) when it is actually true.
True
17. True or False? When performing a Mann-Whitney U test, one should always use the higher value of the
calculated U values to compare to the critical U value while making the decision rule.
False
18. True or False? Considering the data blow. The median is 120.
100 120 111 115 120 116 125 129 130
True
19. True or False? The margin of error is always greater than or equal to the standard error.
False
20. True or False? If a test is run and p = 0.0356, then we can reject H0 at = 0.01.
False
21. True or False? If a 95% confidence interval for the difference in two independent means is (-4.5 to 2.1), then the
point estimate is -2.1.
False
22. True or False? If a 95% confidence interval for the difference in two independent means is (2.1 to 4.5), there is
no significant difference in means.
False
23. True or False? If a 90% confidence interval for the mean is (75.3 to 80.9), we would reject H0: =70 in favor
of H1: ≠ 70 at = 0.05.
True
24. True or False? In logistic regression, the predictors are dichotomous, and the outcome is a continuous variable.
True
25. True or False? The level of significance is the probability that we reject the null hypothesis (in favor of the
alternative) when it is actually true.
⊘ This is a preview!⊘
Do you want full access?
Subscribe today to unlock all pages.
Trusted by 1+ million students worldwide
False
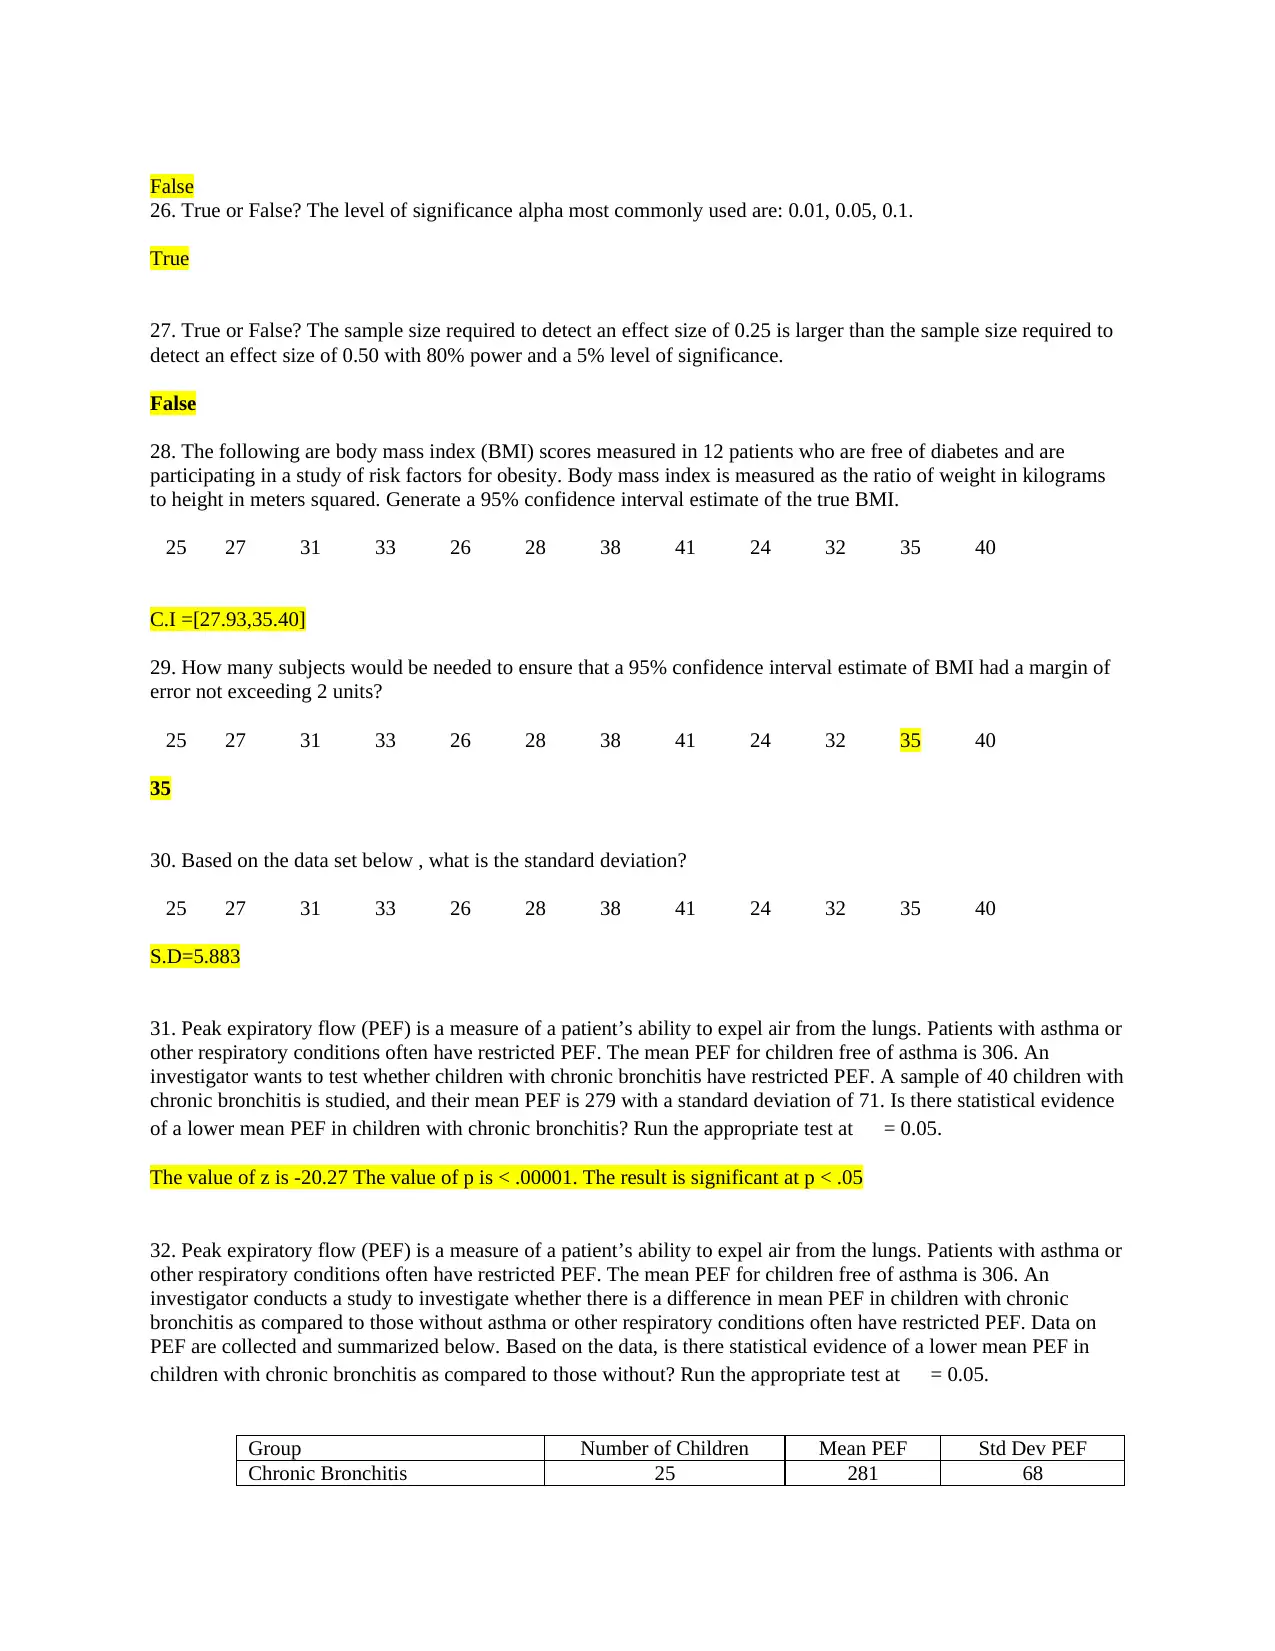
26. True or False? The level of significance alpha most commonly used are: 0.01, 0.05, 0.1.
True
27. True or False? The sample size required to detect an effect size of 0.25 is larger than the sample size required to
detect an effect size of 0.50 with 80% power and a 5% level of significance.
False
28. The following are body mass index (BMI) scores measured in 12 patients who are free of diabetes and are
participating in a study of risk factors for obesity. Body mass index is measured as the ratio of weight in kilograms
to height in meters squared. Generate a 95% confidence interval estimate of the true BMI.
25 27 31 33 26 28 38 41 24 32 35 40
C.I =[27.93,35.40]
29. How many subjects would be needed to ensure that a 95% confidence interval estimate of BMI had a margin of
error not exceeding 2 units?
25 27 31 33 26 28 38 41 24 32 35 40
35
30. Based on the data set below , what is the standard deviation?
25 27 31 33 26 28 38 41 24 32 35 40
S.D=5.883
31. Peak expiratory flow (PEF) is a measure of a patient’s ability to expel air from the lungs. Patients with asthma or
other respiratory conditions often have restricted PEF. The mean PEF for children free of asthma is 306. An
investigator wants to test whether children with chronic bronchitis have restricted PEF. A sample of 40 children with
chronic bronchitis is studied, and their mean PEF is 279 with a standard deviation of 71. Is there statistical evidence
of a lower mean PEF in children with chronic bronchitis? Run the appropriate test at = 0.05.
The value of z is -20.27 The value of p is < .00001. The result is significant at p < .05
32. Peak expiratory flow (PEF) is a measure of a patient’s ability to expel air from the lungs. Patients with asthma or
other respiratory conditions often have restricted PEF. The mean PEF for children free of asthma is 306. An
investigator conducts a study to investigate whether there is a difference in mean PEF in children with chronic
bronchitis as compared to those without asthma or other respiratory conditions often have restricted PEF. Data on
PEF are collected and summarized below. Based on the data, is there statistical evidence of a lower mean PEF in
children with chronic bronchitis as compared to those without? Run the appropriate test at = 0.05.
Group Number of Children Mean PEF Std Dev PEF
Chronic Bronchitis 25 281 68
Paraphrase This Document
Need a fresh take? Get an instant paraphrase of this document with our AI Paraphraser
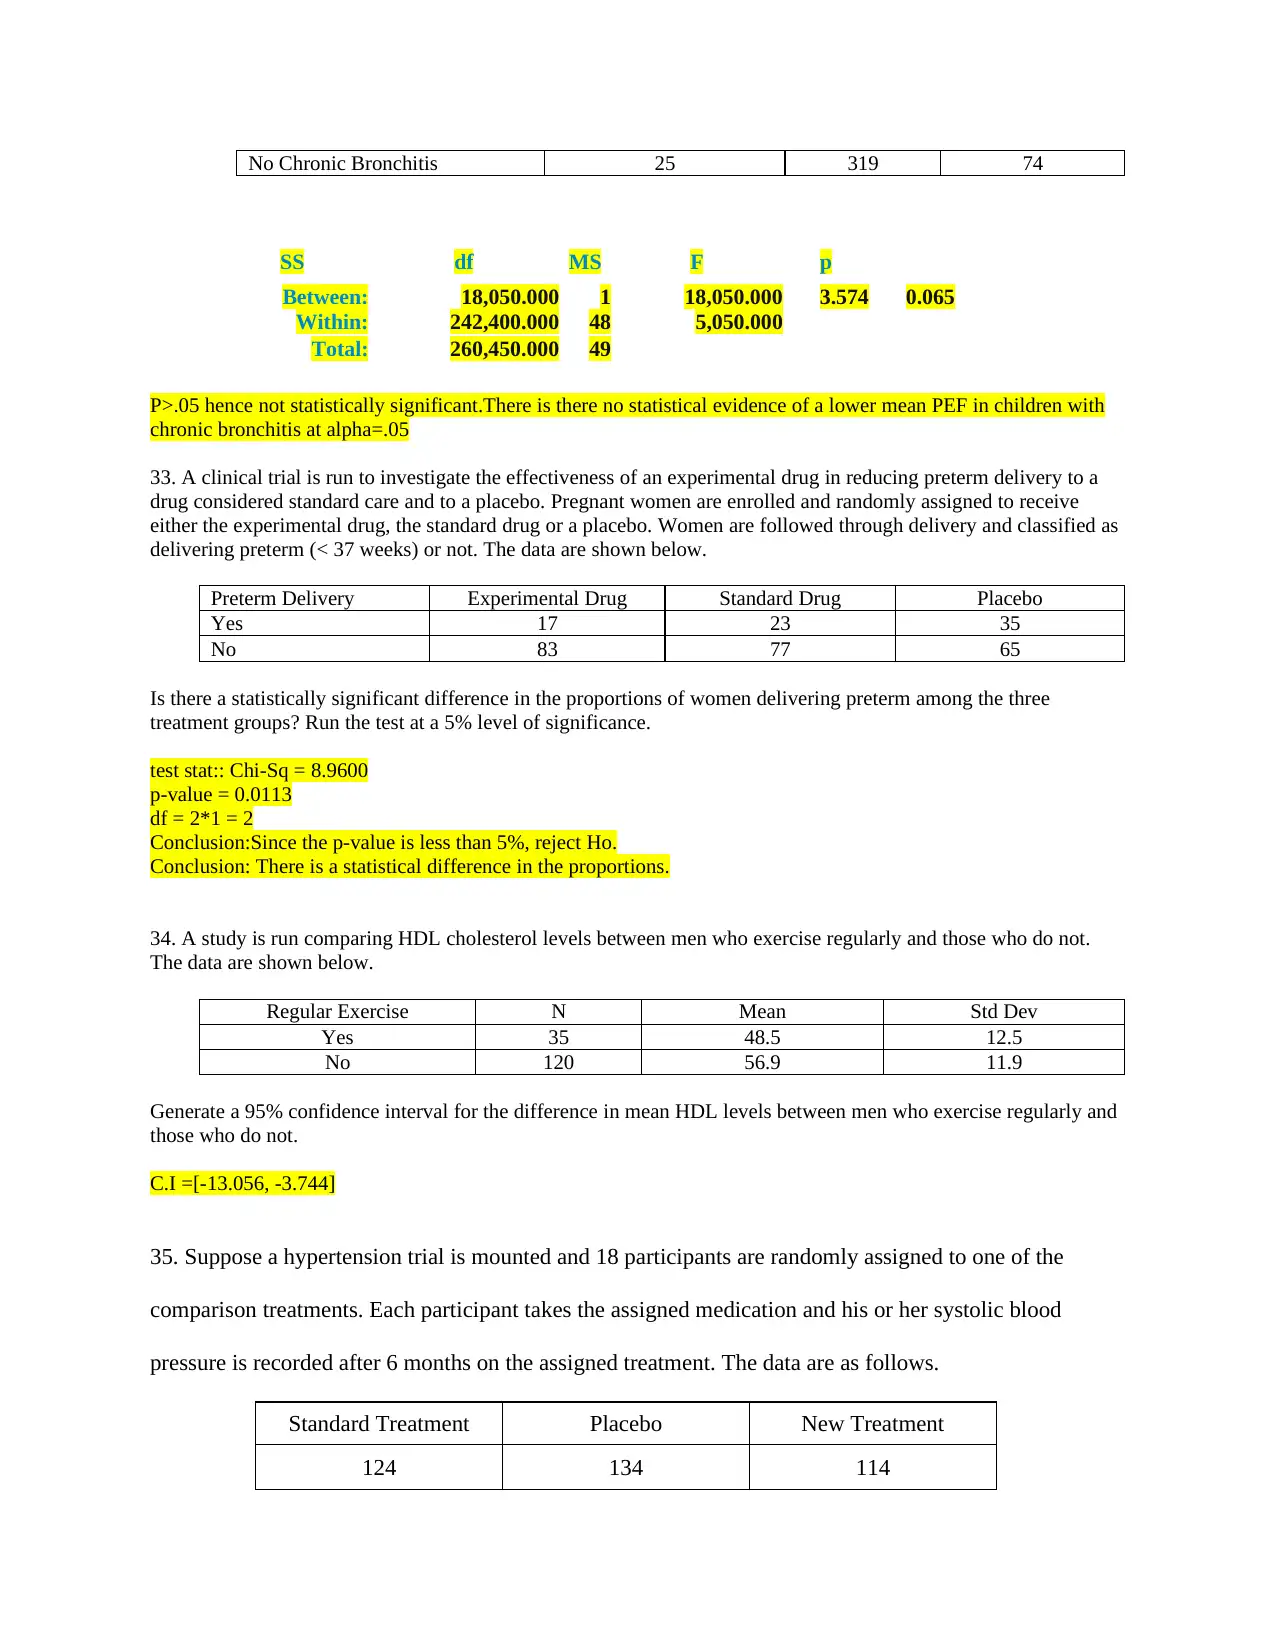
No Chronic Bronchitis 25 319 74
P>.05 hence not statistically significant.There is there no statistical evidence of a lower mean PEF in children with
chronic bronchitis at alpha=.05
33. A clinical trial is run to investigate the effectiveness of an experimental drug in reducing preterm delivery to a
drug considered standard care and to a placebo. Pregnant women are enrolled and randomly assigned to receive
either the experimental drug, the standard drug or a placebo. Women are followed through delivery and classified as
delivering preterm (< 37 weeks) or not. The data are shown below.
Preterm Delivery Experimental Drug Standard Drug Placebo
Yes 17 23 35
No 83 77 65
Is there a statistically significant difference in the proportions of women delivering preterm among the three
treatment groups? Run the test at a 5% level of significance.
test stat:: Chi-Sq = 8.9600
p-value = 0.0113
df = 2*1 = 2
Conclusion:Since the p-value is less than 5%, reject Ho.
Conclusion: There is a statistical difference in the proportions.
34. A study is run comparing HDL cholesterol levels between men who exercise regularly and those who do not.
The data are shown below.
Regular Exercise N Mean Std Dev
Yes 35 48.5 12.5
No 120 56.9 11.9
Generate a 95% confidence interval for the difference in mean HDL levels between men who exercise regularly and
those who do not.
C.I =[-13.056, -3.744]
35. Suppose a hypertension trial is mounted and 18 participants are randomly assigned to one of the
comparison treatments. Each participant takes the assigned medication and his or her systolic blood
pressure is recorded after 6 months on the assigned treatment. The data are as follows.
Standard Treatment Placebo New Treatment
124 134 114
SS df MS F p
Between: 18,050.000 1 18,050.000 3.574 0.065
Within: 242,400.000 48 5,050.000
Total: 260,450.000 49
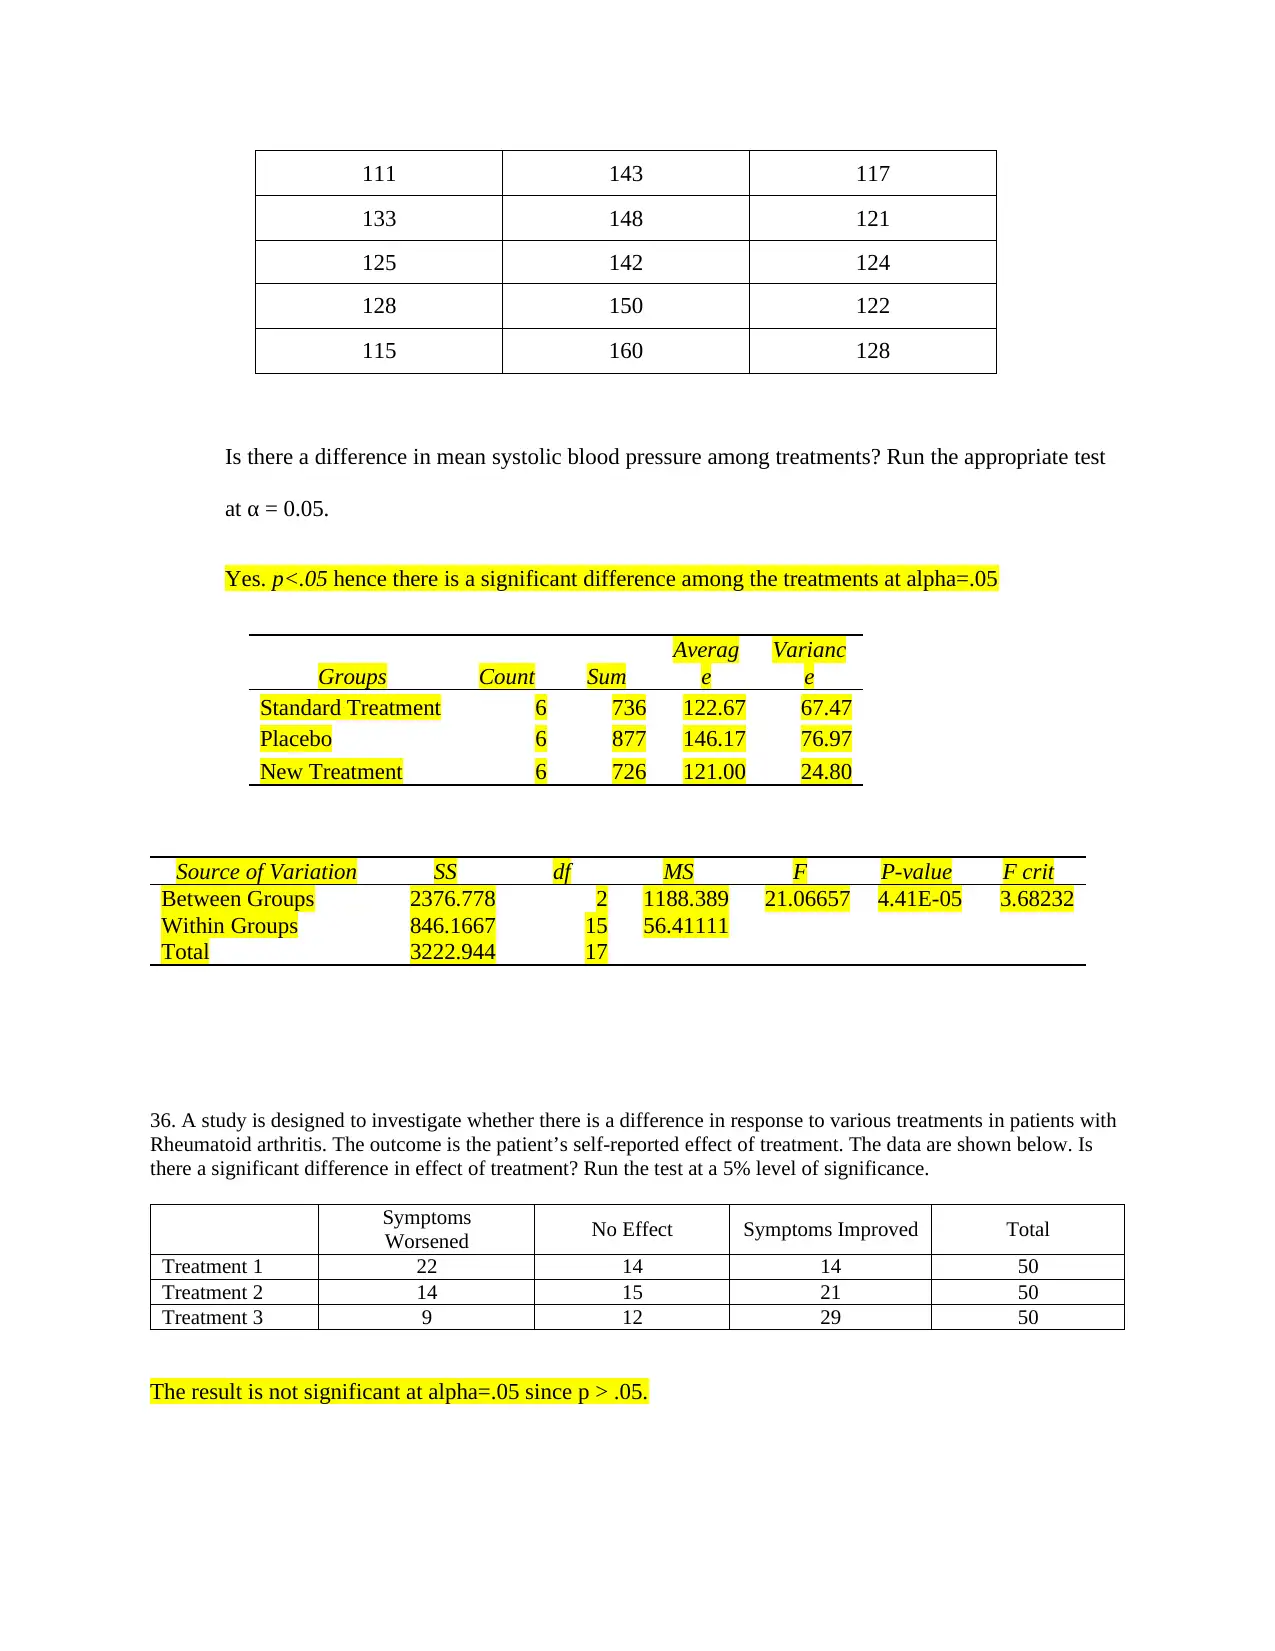
111 143 117
133 148 121
125 142 124
128 150 122
115 160 128
Is there a difference in mean systolic blood pressure among treatments? Run the appropriate test
at α = 0.05.
Yes. p<.05 hence there is a significant difference among the treatments at alpha=.05
Groups Count Sum
Averag
e
Varianc
e
Standard Treatment 6 736 122.67 67.47
Placebo 6 877 146.17 76.97
New Treatment 6 726 121.00 24.80
Source of Variation SS df MS F P-value F crit
Between Groups 2376.778 2 1188.389 21.06657 4.41E-05 3.68232
Within Groups 846.1667 15 56.41111
Total 3222.944 17
36. A study is designed to investigate whether there is a difference in response to various treatments in patients with
Rheumatoid arthritis. The outcome is the patient’s self-reported effect of treatment. The data are shown below. Is
there a significant difference in effect of treatment? Run the test at a 5% level of significance.
Symptoms
Worsened No Effect Symptoms Improved Total
Treatment 1 22 14 14 50
Treatment 2 14 15 21 50
Treatment 3 9 12 29 50
The result is not significant at alpha=.05 since p > .05.
⊘ This is a preview!⊘
Do you want full access?
Subscribe today to unlock all pages.
Trusted by 1+ million students worldwide
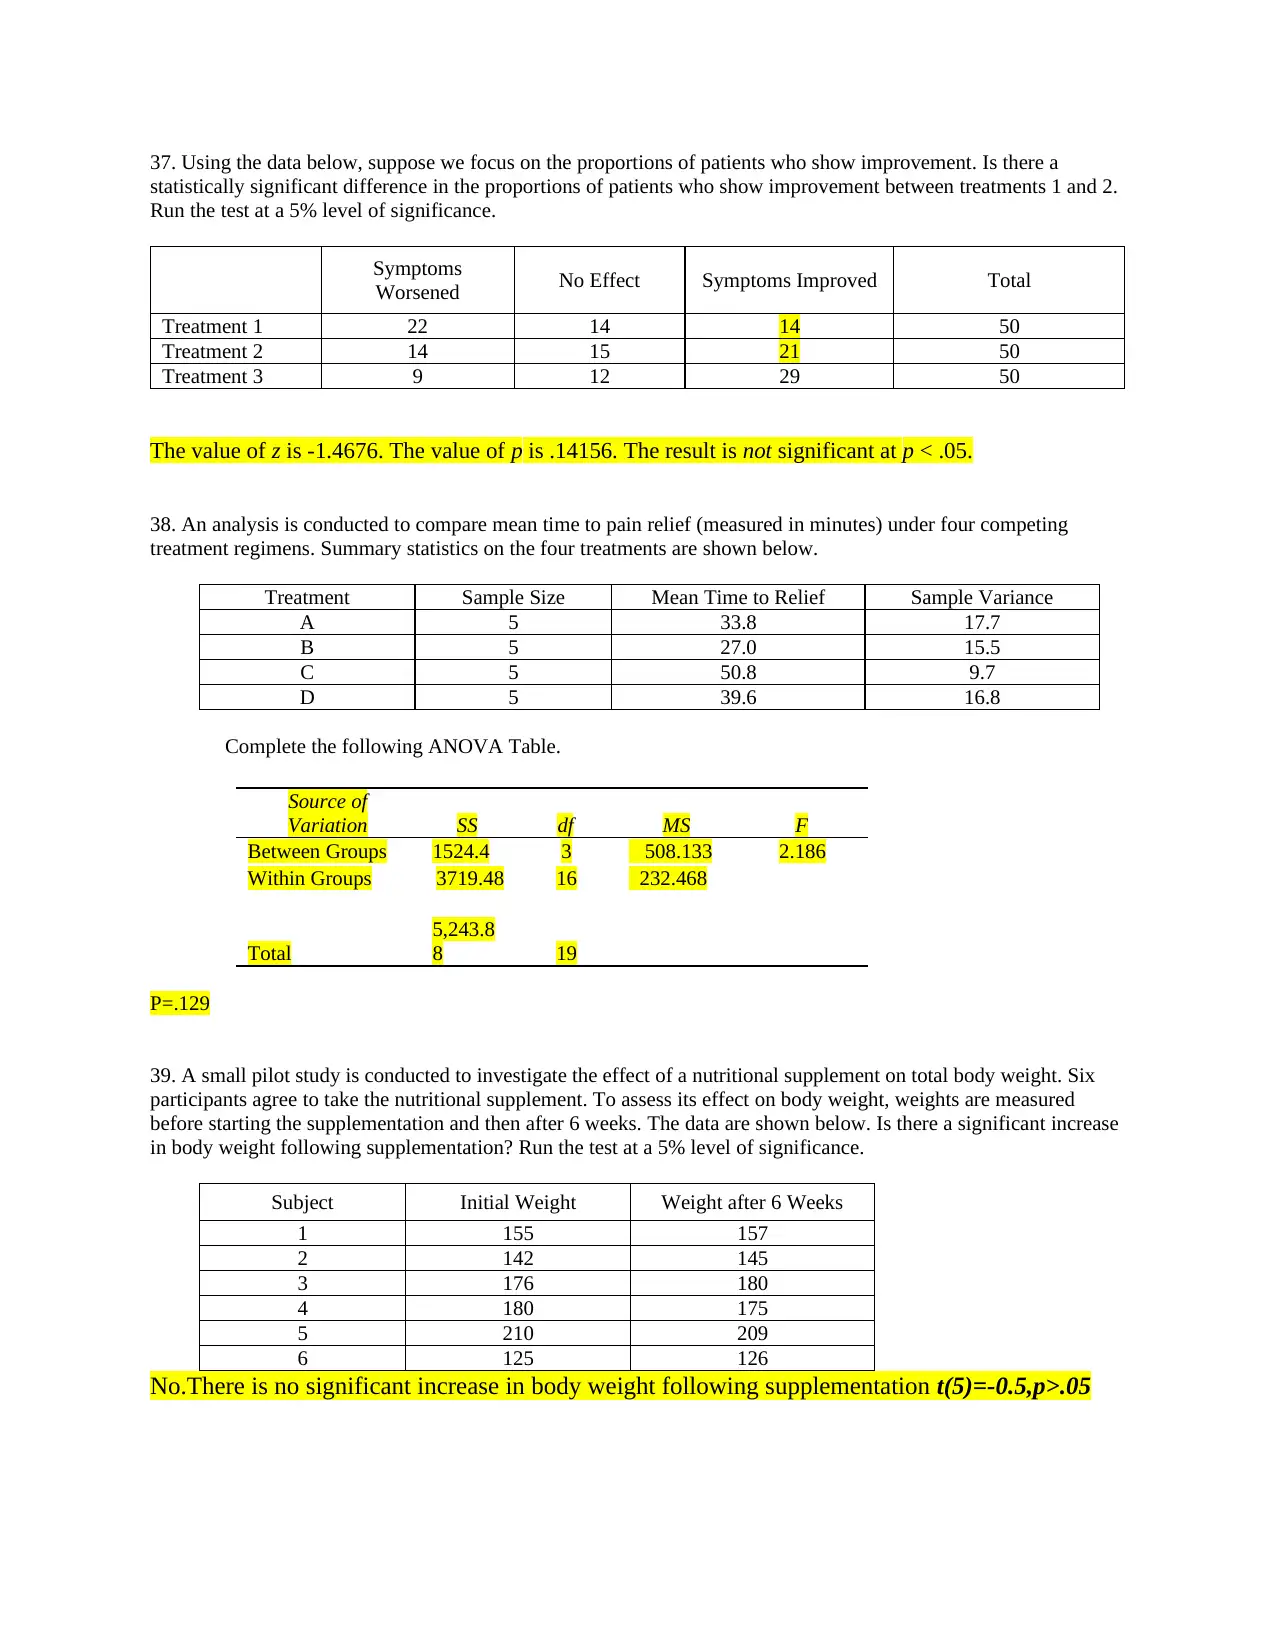
37. Using the data below, suppose we focus on the proportions of patients who show improvement. Is there a
statistically significant difference in the proportions of patients who show improvement between treatments 1 and 2.
Run the test at a 5% level of significance.
Symptoms
Worsened No Effect Symptoms Improved Total
Treatment 1 22 14 14 50
Treatment 2 14 15 21 50
Treatment 3 9 12 29 50
The value of z is -1.4676. The value of p is .14156. The result is not significant at p < .05.
38. An analysis is conducted to compare mean time to pain relief (measured in minutes) under four competing
treatment regimens. Summary statistics on the four treatments are shown below.
Treatment Sample Size Mean Time to Relief Sample Variance
A 5 33.8 17.7
B 5 27.0 15.5
C 5 50.8 9.7
D 5 39.6 16.8
Complete the following ANOVA Table.
Source of
Variation SS df MS F
Between Groups 1524.4 3 508.133 2.186
Within Groups 3719.48 16 232.468
Total
5,243.8
8 19
P=.129
39. A small pilot study is conducted to investigate the effect of a nutritional supplement on total body weight. Six
participants agree to take the nutritional supplement. To assess its effect on body weight, weights are measured
before starting the supplementation and then after 6 weeks. The data are shown below. Is there a significant increase
in body weight following supplementation? Run the test at a 5% level of significance.
Subject Initial Weight Weight after 6 Weeks
1 155 157
2 142 145
3 176 180
4 180 175
5 210 209
6 125 126
No.There is no significant increase in body weight following supplementation t(5)=-0.5,p>.05
Paraphrase This Document
Need a fresh take? Get an instant paraphrase of this document with our AI Paraphraser
Pr(T < t) = 0.3191 Pr(|T| > |t|) = 0.6383 Pr(T > t) = 0.6809
Ha: mean(diff) < 0 Ha: mean(diff) != 0 Ha: mean(diff) > 0
Ho: mean(diff) = 0 degrees of freedom = 5
mean(diff) = mean(initialweight - weightafter6we~s) t = -0.5000
diff 6 -.6666667 1.333333 3.265986 -4.094109 2.760776
weight~s 6 165.3333 11.89584 29.13875 134.7541 195.9126
initia~t 6 164.6667 12.38189 30.3293 132.838 196.4953
Variable Obs Mean Std. Err. Std. Dev. [95% Conf. Interval]
Paired t test
Paired Sample t-test
Initial Weight Weight after 6 Weeks
Mean 164.6666667 165.3333333
Variance 919.8666667 849.0666667
Observations 6 6
Pearson Correlation 0.994767094
Hypothesized Mean Difference 0
df 5
t Stat -0.5
P(T<=t) one-tail 0.319149436
t Critical one-tail 2.015048373
P(T<=t) two-tail 0.638298872
t Critical two-tail 2.570581836
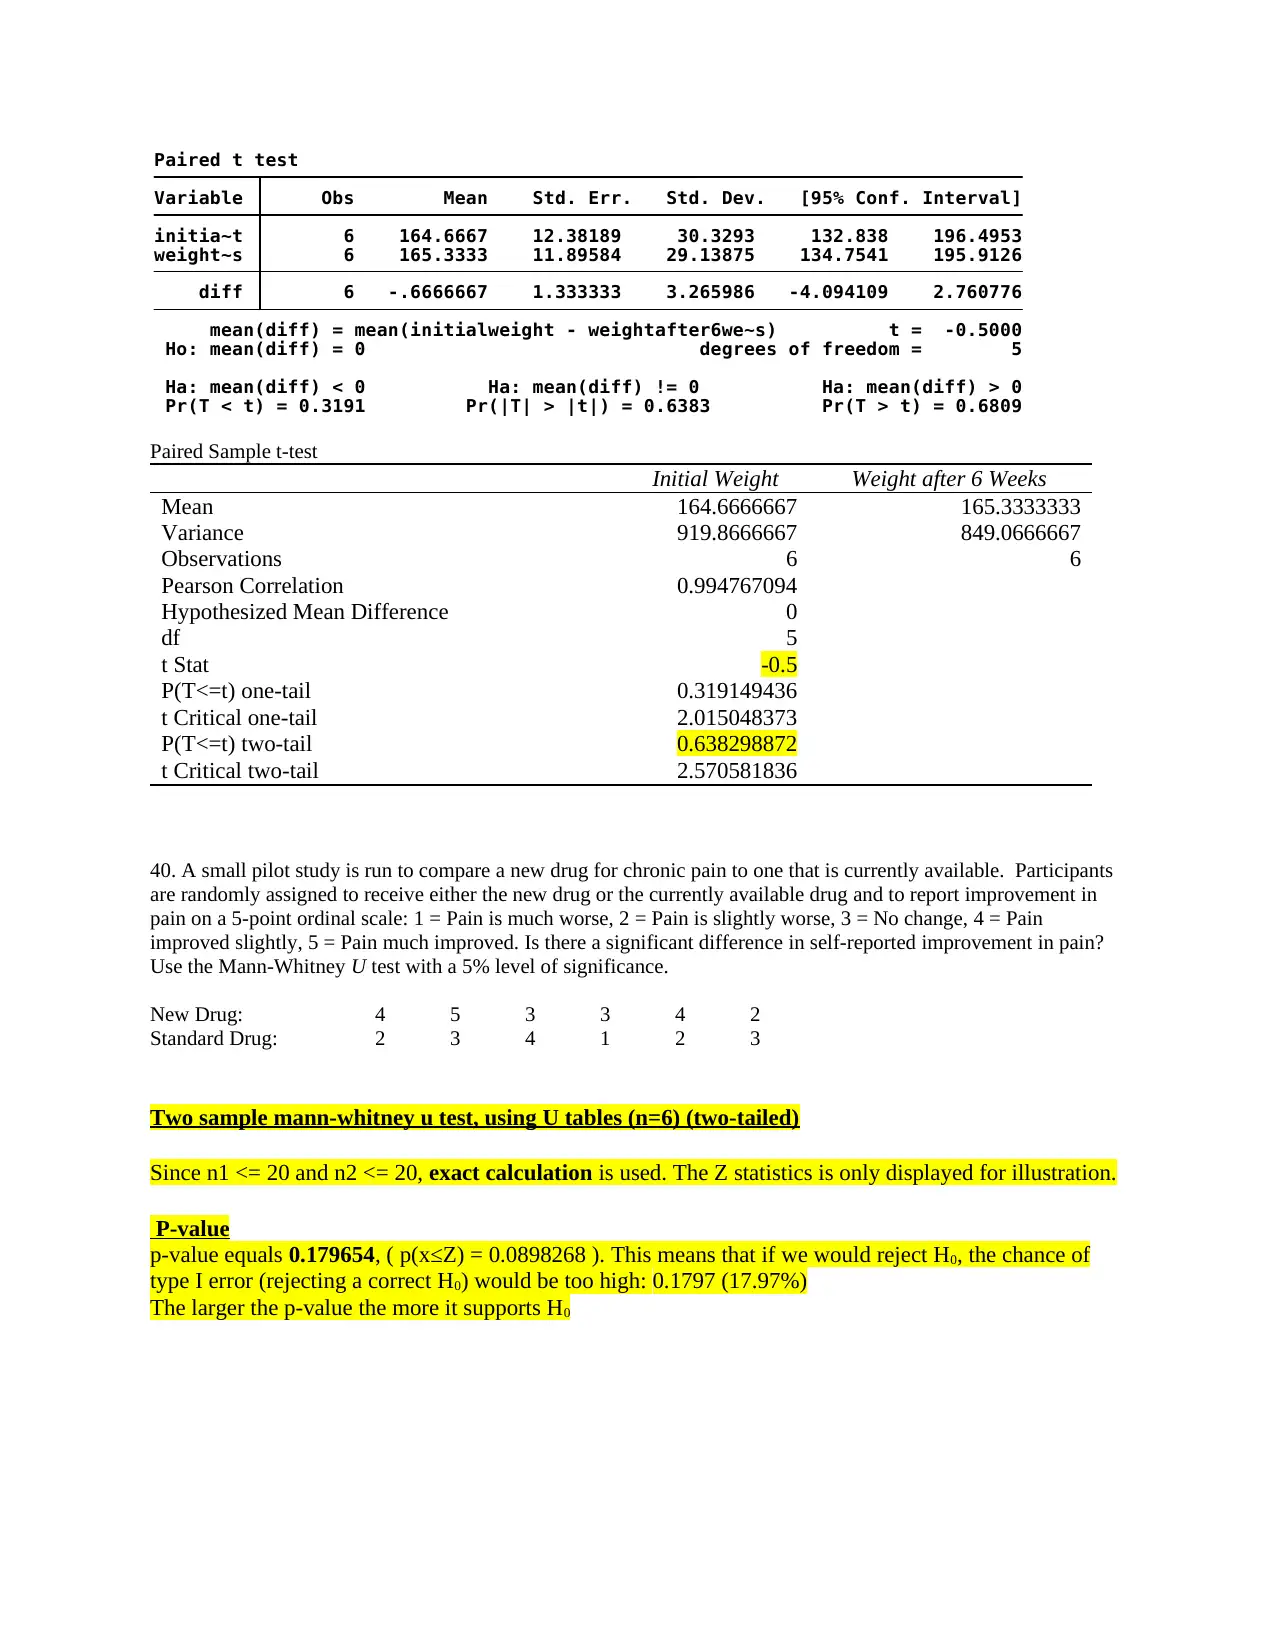
40. A small pilot study is run to compare a new drug for chronic pain to one that is currently available. Participants
are randomly assigned to receive either the new drug or the currently available drug and to report improvement in
pain on a 5-point ordinal scale: 1 = Pain is much worse, 2 = Pain is slightly worse, 3 = No change, 4 = Pain
improved slightly, 5 = Pain much improved. Is there a significant difference in self-reported improvement in pain?
Use the Mann-Whitney U test with a 5% level of significance.
New Drug: 4 5 3 3 4 2
Standard Drug: 2 3 4 1 2 3
Two sample mann-whitney u test, using U tables (n=6) (two-tailed)
Since n1 <= 20 and n2 <= 20, exact calculation is used. The Z statistics is only displayed for illustration.
P-value
p-value equals 0.179654, ( p(x≤Z) = 0.0898268 ). This means that if we would reject H0, the chance of
type I error (rejecting a correct H0) would be too high: 0.1797 (17.97%)
The larger the p-value the more it supports H0
Ha: mean(diff) < 0 Ha: mean(diff) != 0 Ha: mean(diff) > 0
Ho: mean(diff) = 0 degrees of freedom = 5
mean(diff) = mean(initialweight - weightafter6we~s) t = -0.5000
diff 6 -.6666667 1.333333 3.265986 -4.094109 2.760776
weight~s 6 165.3333 11.89584 29.13875 134.7541 195.9126
initia~t 6 164.6667 12.38189 30.3293 132.838 196.4953
Variable Obs Mean Std. Err. Std. Dev. [95% Conf. Interval]
Paired t test
Paired Sample t-test
Initial Weight Weight after 6 Weeks
Mean 164.6666667 165.3333333
Variance 919.8666667 849.0666667
Observations 6 6
Pearson Correlation 0.994767094
Hypothesized Mean Difference 0
df 5
t Stat -0.5
P(T<=t) one-tail 0.319149436
t Critical one-tail 2.015048373
P(T<=t) two-tail 0.638298872
t Critical two-tail 2.570581836
40. A small pilot study is run to compare a new drug for chronic pain to one that is currently available. Participants
are randomly assigned to receive either the new drug or the currently available drug and to report improvement in
pain on a 5-point ordinal scale: 1 = Pain is much worse, 2 = Pain is slightly worse, 3 = No change, 4 = Pain
improved slightly, 5 = Pain much improved. Is there a significant difference in self-reported improvement in pain?
Use the Mann-Whitney U test with a 5% level of significance.
New Drug: 4 5 3 3 4 2
Standard Drug: 2 3 4 1 2 3
Two sample mann-whitney u test, using U tables (n=6) (two-tailed)
Since n1 <= 20 and n2 <= 20, exact calculation is used. The Z statistics is only displayed for illustration.
P-value
p-value equals 0.179654, ( p(x≤Z) = 0.0898268 ). This means that if we would reject H0, the chance of
type I error (rejecting a correct H0) would be too high: 0.1797 (17.97%)
The larger the p-value the more it supports H0
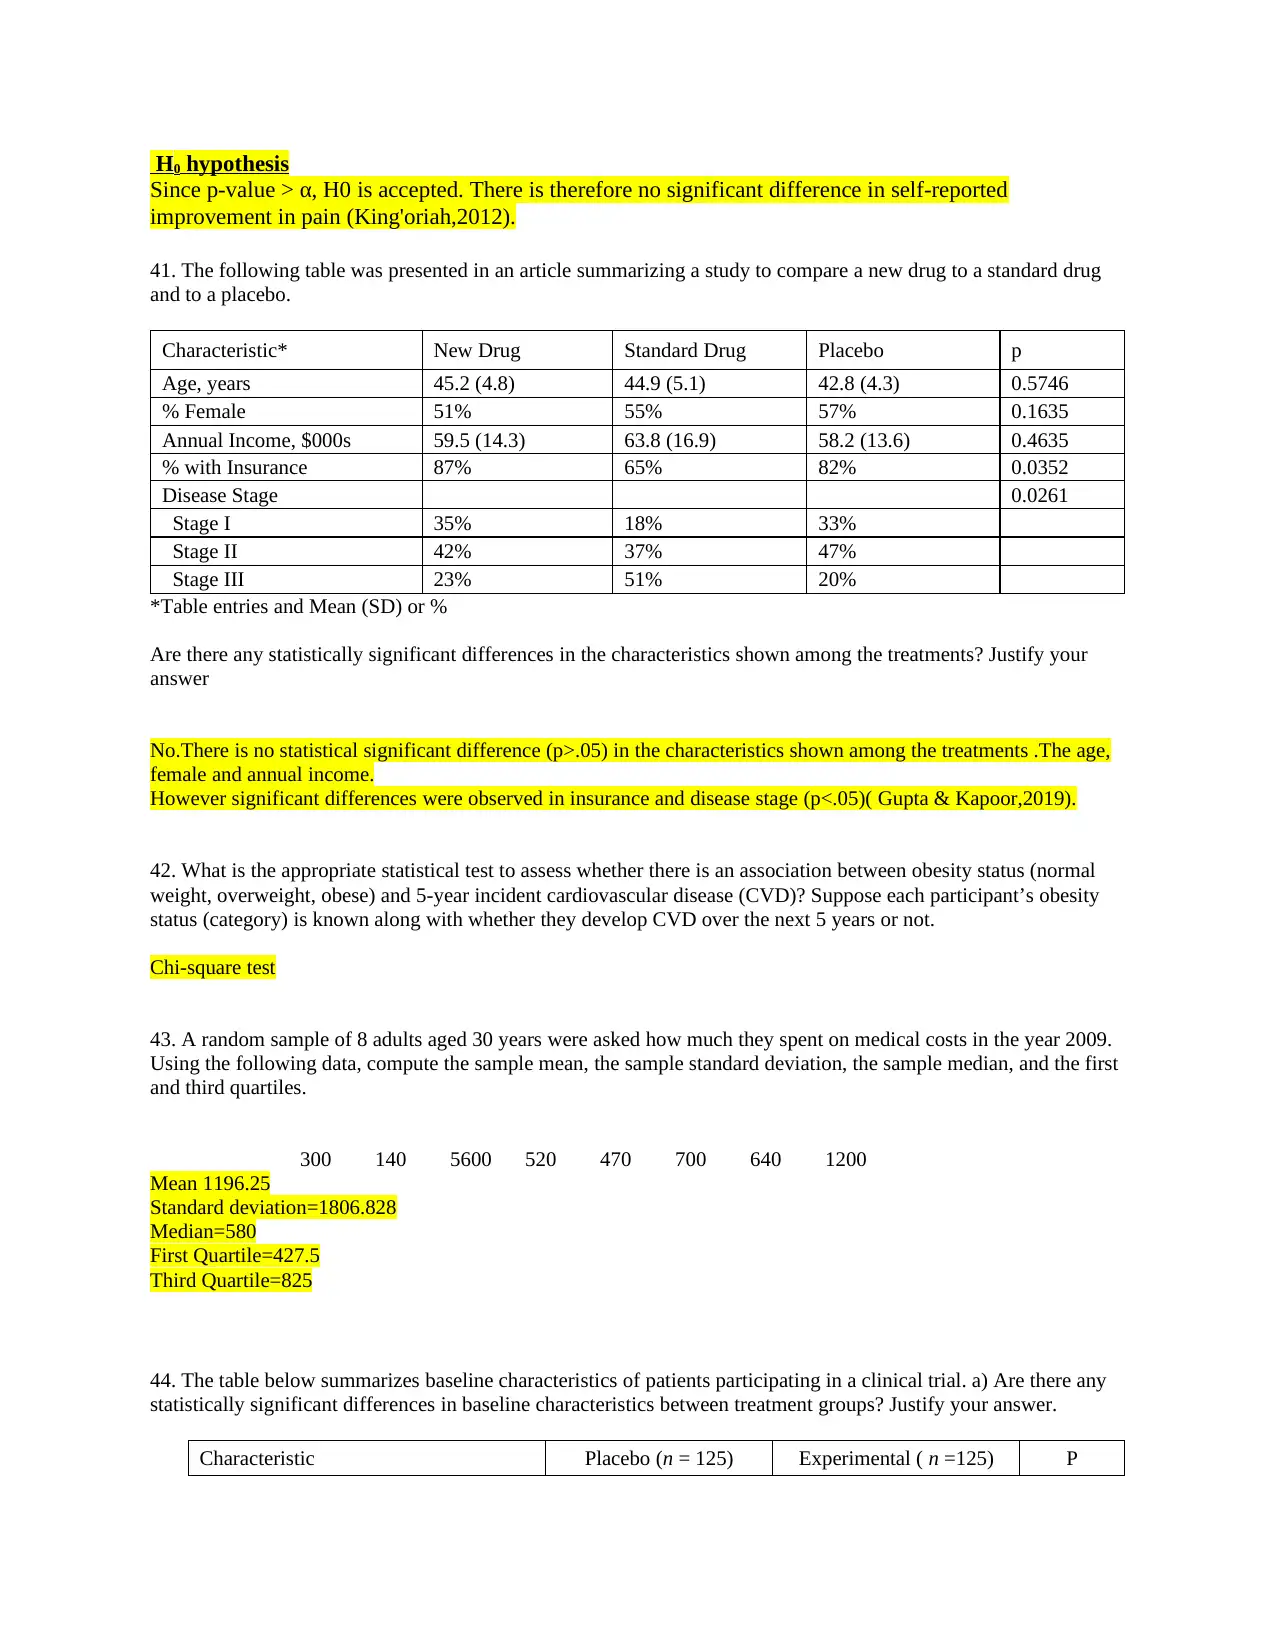
H0 hypothesis
Since p-value > α, H0 is accepted. There is therefore no significant difference in self-reported
improvement in pain (King'oriah,2012).
41. The following table was presented in an article summarizing a study to compare a new drug to a standard drug
and to a placebo.
Characteristic* New Drug Standard Drug Placebo p
Age, years 45.2 (4.8) 44.9 (5.1) 42.8 (4.3) 0.5746
% Female 51% 55% 57% 0.1635
Annual Income, $000s 59.5 (14.3) 63.8 (16.9) 58.2 (13.6) 0.4635
% with Insurance 87% 65% 82% 0.0352
Disease Stage 0.0261
Stage I 35% 18% 33%
Stage II 42% 37% 47%
Stage III 23% 51% 20%
*Table entries and Mean (SD) or %
Are there any statistically significant differences in the characteristics shown among the treatments? Justify your
answer
No.There is no statistical significant difference (p>.05) in the characteristics shown among the treatments .The age,
female and annual income.
However significant differences were observed in insurance and disease stage (p<.05)( Gupta & Kapoor,2019).
42. What is the appropriate statistical test to assess whether there is an association between obesity status (normal
weight, overweight, obese) and 5-year incident cardiovascular disease (CVD)? Suppose each participant’s obesity
status (category) is known along with whether they develop CVD over the next 5 years or not.
Chi-square test
43. A random sample of 8 adults aged 30 years were asked how much they spent on medical costs in the year 2009.
Using the following data, compute the sample mean, the sample standard deviation, the sample median, and the first
and third quartiles.
300 140 5600 520 470 700 640 1200
Mean 1196.25
Standard deviation=1806.828
Median=580
First Quartile=427.5
Third Quartile=825
44. The table below summarizes baseline characteristics of patients participating in a clinical trial. a) Are there any
statistically significant differences in baseline characteristics between treatment groups? Justify your answer.
Characteristic Placebo (n = 125) Experimental ( n =125) P
⊘ This is a preview!⊘
Do you want full access?
Subscribe today to unlock all pages.
Trusted by 1+ million students worldwide
1 out of 14


Your All-in-One AI-Powered Toolkit for Academic Success.
+13062052269
info@desklib.com
Available 24*7 on WhatsApp / Email
![[object Object]](/_next/static/media/star-bottom.7253800d.svg)
Unlock your academic potential
Copyright © 2020–2026 A2Z Services. All Rights Reserved. Developed and managed by ZUCOL.