Analysis of Heart Rate, VO2 Max, and Fitness Levels Report (SE4100)
VerifiedAdded on 2023/04/26
|9
|2547
|296
Report
AI Summary
This report presents an analysis of heart rate and VO2 max data collected from 24 participants during a practical session. The study investigates heart rate responses to exercise, including fluctuations during activity and recovery phases. The report examines the correlation between age, body weight, and heart rate, as well as the estimation of VO2 max through both exercise and non-exercise tests. Statistical analyses, including the student t-Test, are used to compare the results of different tests. The Cooper Run Test is also discussed as a method for assessing aerobic fitness. The findings highlight the relationship between body weight, oxygen transport, and cardiovascular fitness, offering insights into the assessment of athletic performance and overall health.
Assessment
SE4100- Practical Session Evaluation/ Discussion
Student ID…
University of East London
SE4100- Practical Session Evaluation/ Discussion
Student ID…
University of East London
Paraphrase This Document
Need a fresh take? Get an instant paraphrase of this document with our AI Paraphraser
Student Number- …………………. 2
Introduction
The heart rate refers to a condition where the heart has to pump least amount of blood required
by the body (Arai, 2009). A normal resting heart rate of the adults lies from 60-100 beats per
minute and may have different values for different people. A low heart rate reflects a more
efficient functioning of heart and better cardio vascular condition. The heart rate changes with
the activity levels of the body. The HR is lower when the person is at rest while it is higher when
the person is doing exercise to provide all the body muscles with adequate amount of oxygen to
maintain the high level functioning (Sullivan et al, 2014).
Heart Rate Response to Exercise
An average heart rate is 40-60 bpm for well trained athletes (Blackwood, 2016). By regular
engagement in exercise activities, such as walking, swimming and cycling, we can help the heart
to turn more efficient (Mike, 2010). During cycling, the maximum heart rate of an average
athlete turns to be 190 bpm. During moderate cycling the average heart rate turns out to be 95 to
133 bpm while at high speed cycling exercise the heart rate may increase as high as from 133 to
162 bpm. While cycling the maximum heart rate is 50-85 % of the maximum heart rate which is
generally calculated as 220 minus the age of the person.
The experiment recorded HR of 24 participants during Resting heart Rate, during physical
exercise 12 times during the activity and later on the measured the heart rate at the recovery
phase. During the exercise, the heart rate seemed to be fluctuating amidst the minimum and
maximum range values while at the recovery phase the heart rate came down gradually as
measured in three instances.
Table 1. Showing the Heart Rate during Exercise
Instances
(min)
Mean Heart Rate during Exercise Mean Standard Deviation
1 90.1 16.24
2 89.6 16.84
3 91.9 18.43
4 101.7 19.38
5 105 20.74
6 107.1 22.09
7 122 19
8 129.9 22.34
9 136.2 21.67
10 145.7 21.16
11 152.8 21.5
Student Number- …………………. 3
12 153.2 23.4
1 2 3 4 5 6 7 8 9 10 11 12
0
20
40
60
80
100
120
140
160
180
200
Mean Standard Deviation
Mean Heart Rate during
Exercise
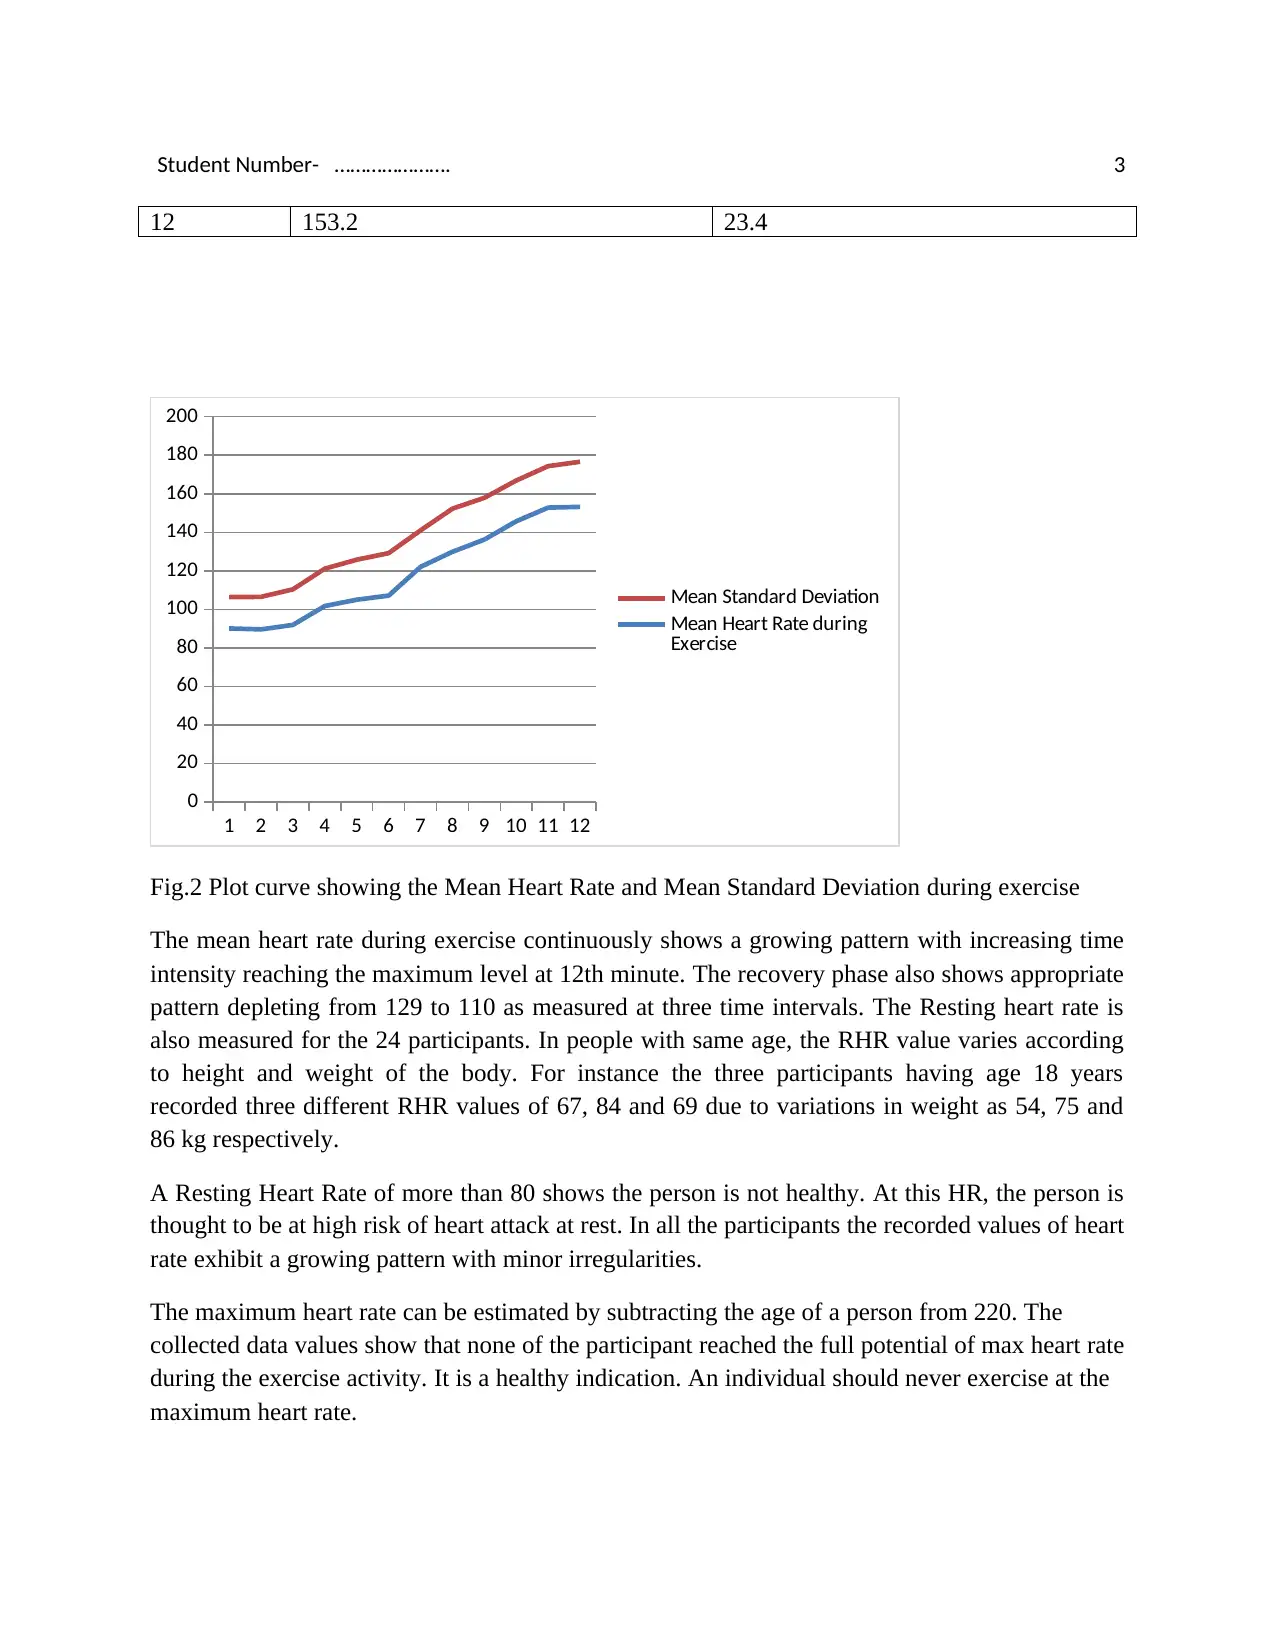
Fig.2 Plot curve showing the Mean Heart Rate and Mean Standard Deviation during exercise
The mean heart rate during exercise continuously shows a growing pattern with increasing time
intensity reaching the maximum level at 12th minute. The recovery phase also shows appropriate
pattern depleting from 129 to 110 as measured at three time intervals. The Resting heart rate is
also measured for the 24 participants. In people with same age, the RHR value varies according
to height and weight of the body. For instance the three participants having age 18 years
recorded three different RHR values of 67, 84 and 69 due to variations in weight as 54, 75 and
86 kg respectively.
A Resting Heart Rate of more than 80 shows the person is not healthy. At this HR, the person is
thought to be at high risk of heart attack at rest. In all the participants the recorded values of heart
rate exhibit a growing pattern with minor irregularities.
The maximum heart rate can be estimated by subtracting the age of a person from 220. The
collected data values show that none of the participant reached the full potential of max heart rate
during the exercise activity. It is a healthy indication. An individual should never exercise at the
maximum heart rate.
12 153.2 23.4
1 2 3 4 5 6 7 8 9 10 11 12
0
20
40
60
80
100
120
140
160
180
200
Mean Standard Deviation
Mean Heart Rate during
Exercise
Fig.2 Plot curve showing the Mean Heart Rate and Mean Standard Deviation during exercise
The mean heart rate during exercise continuously shows a growing pattern with increasing time
intensity reaching the maximum level at 12th minute. The recovery phase also shows appropriate
pattern depleting from 129 to 110 as measured at three time intervals. The Resting heart rate is
also measured for the 24 participants. In people with same age, the RHR value varies according
to height and weight of the body. For instance the three participants having age 18 years
recorded three different RHR values of 67, 84 and 69 due to variations in weight as 54, 75 and
86 kg respectively.
A Resting Heart Rate of more than 80 shows the person is not healthy. At this HR, the person is
thought to be at high risk of heart attack at rest. In all the participants the recorded values of heart
rate exhibit a growing pattern with minor irregularities.
The maximum heart rate can be estimated by subtracting the age of a person from 220. The
collected data values show that none of the participant reached the full potential of max heart rate
during the exercise activity. It is a healthy indication. An individual should never exercise at the
maximum heart rate.
⊘ This is a preview!⊘
Do you want full access?
Subscribe today to unlock all pages.
Trusted by 1+ million students worldwide
Student Number- …………………. 4
The correlation between the age and heart rate at the 12th minute in the collected data does not
show any significant pattern. The data does not exhibits any particular graph slope or curve
however the values are variable and do not depend on the age of the participant. As we observe
the collected data, we find that the heart rate at the 12th minute of exercise does not show any
significant correlation depending on the age. Most of the participants have reached the VO2 max
value of more than 100 however none of the participant reached a VO2 max value. It is an ideal
condition.
Correlation between recovery rate and age, at minute 3 following exercise shows a range of 61 to
138 with irregular pattern. The results depend on many body functions and health of individual.
The correlation between the mass in kg and the heart rate at minute 3 also shows irregular
pattern. The participants with mass 54 shows heart rate of 61 while the person with mass 135
also exhibits nearly similar heart rate
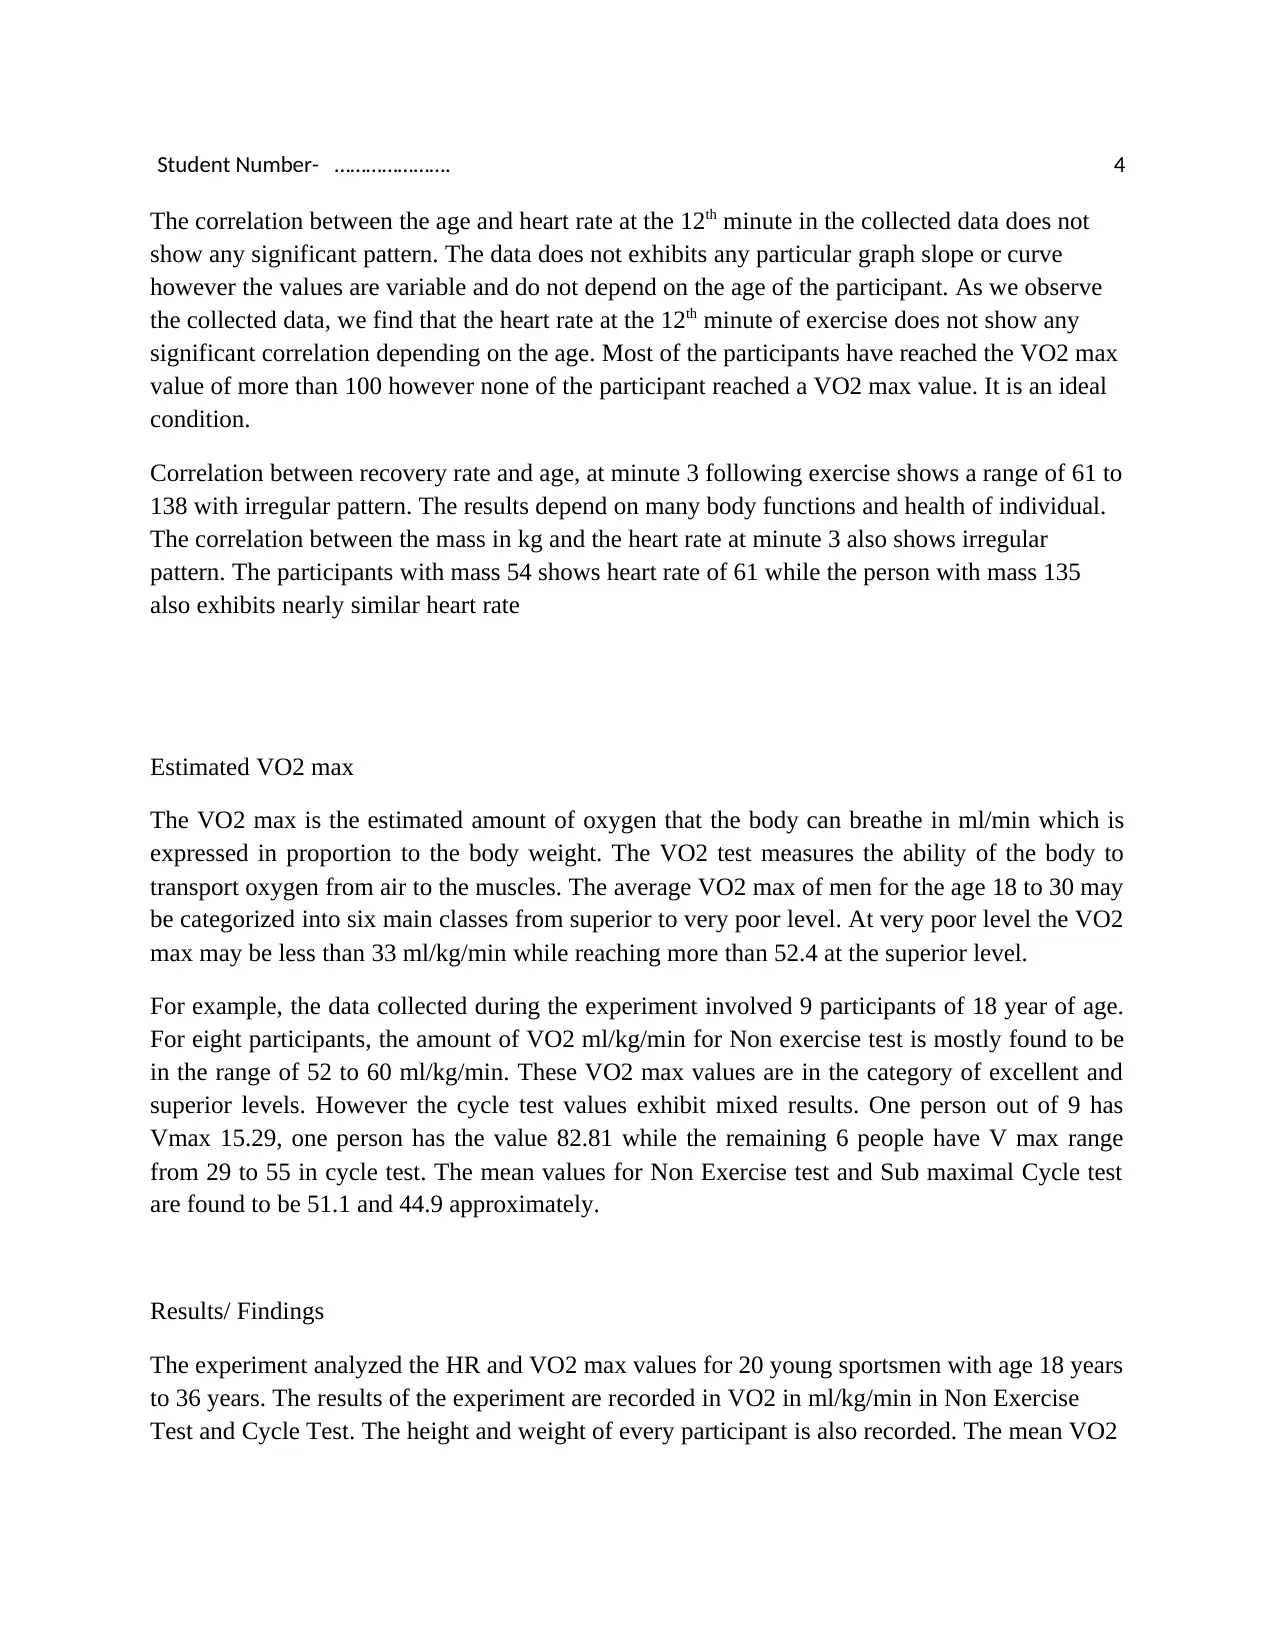
Estimated VO2 max
The VO2 max is the estimated amount of oxygen that the body can breathe in ml/min which is
expressed in proportion to the body weight. The VO2 test measures the ability of the body to
transport oxygen from air to the muscles. The average VO2 max of men for the age 18 to 30 may
be categorized into six main classes from superior to very poor level. At very poor level the VO2
max may be less than 33 ml/kg/min while reaching more than 52.4 at the superior level.
For example, the data collected during the experiment involved 9 participants of 18 year of age.
For eight participants, the amount of VO2 ml/kg/min for Non exercise test is mostly found to be
in the range of 52 to 60 ml/kg/min. These VO2 max values are in the category of excellent and
superior levels. However the cycle test values exhibit mixed results. One person out of 9 has
Vmax 15.29, one person has the value 82.81 while the remaining 6 people have V max range
from 29 to 55 in cycle test. The mean values for Non Exercise test and Sub maximal Cycle test
are found to be 51.1 and 44.9 approximately.
Results/ Findings
The experiment analyzed the HR and VO2 max values for 20 young sportsmen with age 18 years
to 36 years. The results of the experiment are recorded in VO2 in ml/kg/min in Non Exercise
Test and Cycle Test. The height and weight of every participant is also recorded. The mean VO2
The correlation between the age and heart rate at the 12th minute in the collected data does not
show any significant pattern. The data does not exhibits any particular graph slope or curve
however the values are variable and do not depend on the age of the participant. As we observe
the collected data, we find that the heart rate at the 12th minute of exercise does not show any
significant correlation depending on the age. Most of the participants have reached the VO2 max
value of more than 100 however none of the participant reached a VO2 max value. It is an ideal
condition.
Correlation between recovery rate and age, at minute 3 following exercise shows a range of 61 to
138 with irregular pattern. The results depend on many body functions and health of individual.
The correlation between the mass in kg and the heart rate at minute 3 also shows irregular
pattern. The participants with mass 54 shows heart rate of 61 while the person with mass 135
also exhibits nearly similar heart rate
Estimated VO2 max
The VO2 max is the estimated amount of oxygen that the body can breathe in ml/min which is
expressed in proportion to the body weight. The VO2 test measures the ability of the body to
transport oxygen from air to the muscles. The average VO2 max of men for the age 18 to 30 may
be categorized into six main classes from superior to very poor level. At very poor level the VO2
max may be less than 33 ml/kg/min while reaching more than 52.4 at the superior level.
For example, the data collected during the experiment involved 9 participants of 18 year of age.
For eight participants, the amount of VO2 ml/kg/min for Non exercise test is mostly found to be
in the range of 52 to 60 ml/kg/min. These VO2 max values are in the category of excellent and
superior levels. However the cycle test values exhibit mixed results. One person out of 9 has
Vmax 15.29, one person has the value 82.81 while the remaining 6 people have V max range
from 29 to 55 in cycle test. The mean values for Non Exercise test and Sub maximal Cycle test
are found to be 51.1 and 44.9 approximately.
Results/ Findings
The experiment analyzed the HR and VO2 max values for 20 young sportsmen with age 18 years
to 36 years. The results of the experiment are recorded in VO2 in ml/kg/min in Non Exercise
Test and Cycle Test. The height and weight of every participant is also recorded. The mean VO2
Paraphrase This Document
Need a fresh take? Get an instant paraphrase of this document with our AI Paraphraser
Student Number- …………………. 5
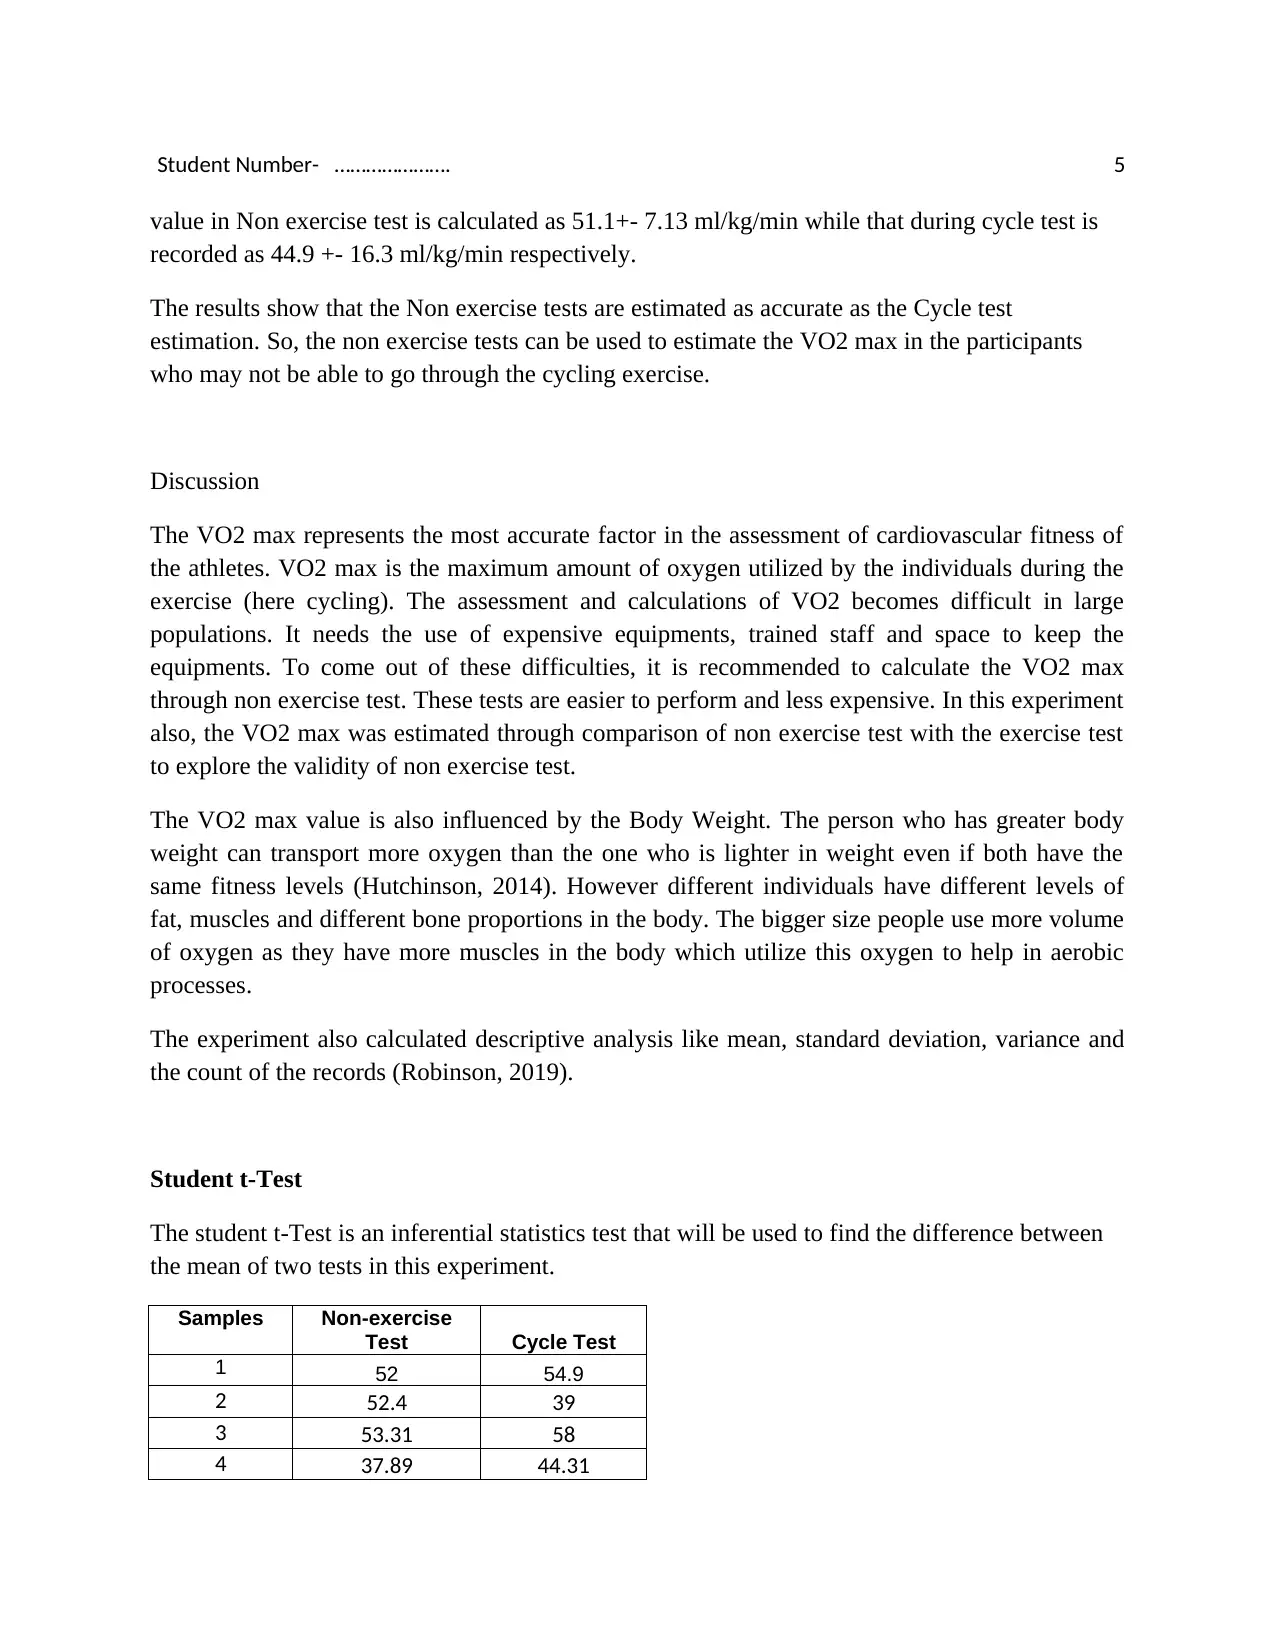
value in Non exercise test is calculated as 51.1+- 7.13 ml/kg/min while that during cycle test is
recorded as 44.9 +- 16.3 ml/kg/min respectively.
The results show that the Non exercise tests are estimated as accurate as the Cycle test
estimation. So, the non exercise tests can be used to estimate the VO2 max in the participants
who may not be able to go through the cycling exercise.
Discussion
The VO2 max represents the most accurate factor in the assessment of cardiovascular fitness of
the athletes. VO2 max is the maximum amount of oxygen utilized by the individuals during the
exercise (here cycling). The assessment and calculations of VO2 becomes difficult in large
populations. It needs the use of expensive equipments, trained staff and space to keep the
equipments. To come out of these difficulties, it is recommended to calculate the VO2 max
through non exercise test. These tests are easier to perform and less expensive. In this experiment
also, the VO2 max was estimated through comparison of non exercise test with the exercise test
to explore the validity of non exercise test.
The VO2 max value is also influenced by the Body Weight. The person who has greater body
weight can transport more oxygen than the one who is lighter in weight even if both have the
same fitness levels (Hutchinson, 2014). However different individuals have different levels of
fat, muscles and different bone proportions in the body. The bigger size people use more volume
of oxygen as they have more muscles in the body which utilize this oxygen to help in aerobic
processes.
The experiment also calculated descriptive analysis like mean, standard deviation, variance and
the count of the records (Robinson, 2019).
Student t-Test
The student t-Test is an inferential statistics test that will be used to find the difference between
the mean of two tests in this experiment.
Samples Non-exercise
Test Cycle Test
1 52 54.9
2 52.4 39
3 53.31 58
4 37.89 44.31
Student Number- …………………. 6
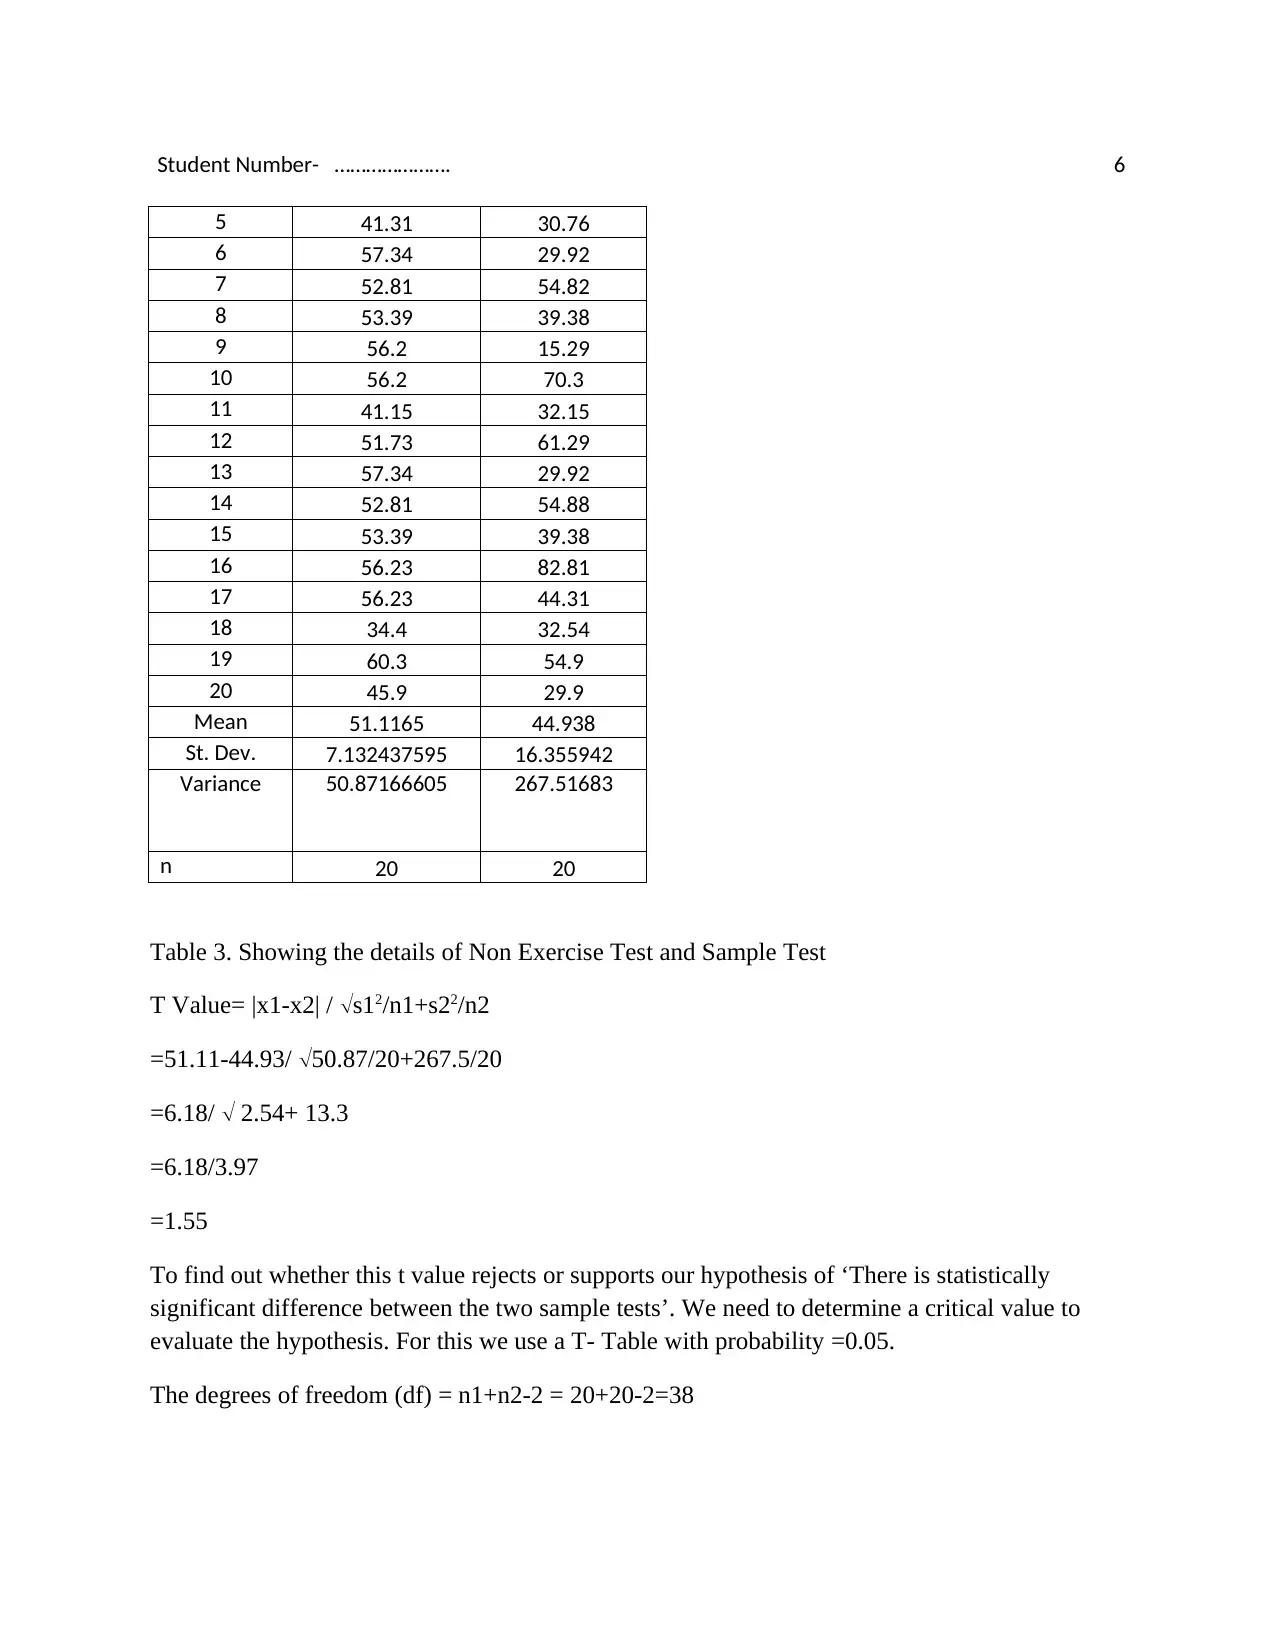
5 41.31 30.76
6 57.34 29.92
7 52.81 54.82
8 53.39 39.38
9 56.2 15.29
10 56.2 70.3
11 41.15 32.15
12 51.73 61.29
13 57.34 29.92
14 52.81 54.88
15 53.39 39.38
16 56.23 82.81
17 56.23 44.31
18 34.4 32.54
19 60.3 54.9
20 45.9 29.9
Mean 51.1165 44.938
St. Dev. 7.132437595 16.355942
Variance 50.87166605 267.51683
n 20 20
Table 3. Showing the details of Non Exercise Test and Sample Test
T Value= |x1-x2| / s12/n1+s22/n2
=51.11-44.93/ 50.87/20+267.5/20
=6.18/ 2.54+ 13.3
=6.18/3.97
=1.55
To find out whether this t value rejects or supports our hypothesis of ‘There is statistically
significant difference between the two sample tests’. We need to determine a critical value to
evaluate the hypothesis. For this we use a T- Table with probability =0.05.
The degrees of freedom (df) = n1+n2-2 = 20+20-2=38
⊘ This is a preview!⊘
Do you want full access?
Subscribe today to unlock all pages.
Trusted by 1+ million students worldwide
Student Number- …………………. 7
According to t-table, the Critical value at this point came as 2.02 which is greater than our t
Value 1.55. It means that it supports our hypothesis that there is statistical difference between the
two tests.
Cooper Run Test
The Cooper Run test is an aerobic fitness test in which the participants try to run as much
distance as possible in 12 minutes time. The test assesses the fitness condition of the individuals
while they run at a steady speed instead of fast running and sprints. There are 5 categories viz
Very Good, Good, Average, Bad and Very Bad. The standards differ on the basis of gender and
age of the participants as well. The test calculates the VO2 max by the below formula:
VO2 max= (35.97* dmiles)-11.29 where dmiles refers to distance covered in miles in 12
minutes.
While considering the mean age of 21.2 years males (shown in the collected data), if we conduct
a cooper test for the participants, we can say that the participants who will run for a distance of
1600-2199 miles, will have a bad fitness level while the participants who can run for 2400-2800
and more than that are considered good/very good.
It is recommended that the Cooper test should be performed under standard conditions like
temperature of 10-25 C with 75% humidity at the max, on a standard tartan track of 400 m. The
participants are not expected to suffer from any respiratory illness as well. The test has been
reported valid at a correlation of 0.90 between the distance covered in 12 minutes and the VO2
max. The test’s reliability depends on the pacing strategies, practice and motivation level of the
participants. The test has an advantage that large group can be tested readily at once, moreover it
is simple and less costly test. The disadvantage of Cooper test is that pacing and practice is
required and the performance of the test largely depends on the motivation factor (Sydo et
al,2014). The Cooper Run Test can be completed by running upon the treadmill for a time period
of 12 minutes. The test has many variations such as Cooper 1.5 mile.
Conclusion
The results of the experiment show a complete analysis of the test and also elaborate the t test
and Cooper test for the collected data. The person who has greater body weight can transport
more oxygen than the one who is lighter in weight even if both have the same fitness levels. The
experiment recorded HR of 24 participants during resting heart rate, during physical exercise 12
times during the activity and later on the measured the heart rate at the recovery phase. During
the exercise, the heart rate seemed to be fluctuating amidst the minimum and maximum range
values while at the recovery phase the heart rate came down gradually as measured in three
Paraphrase This Document
Need a fresh take? Get an instant paraphrase of this document with our AI Paraphraser
Student Number- …………………. 8
instances. The student t-test supports our hypothesis that there is statistical difference between
the two tests.The results are highly authentic and reliable with thorough analysis and evaluation.
References
Arai Takeshi,’The Relationship between Age and Change in Physical Functions after Exercise
Intervention. Trainability of Japanese Community-Dwelling Older Elderly’ [2009]. Journal of
the Japanese Physical Therapy Association = Rigaku ryoho, 12(1), 1-8.
Arnold Malcolm. ‘Resting heart rate: a modifiable prognostic indicator of cardiovascular risk
and outcomes?’ (2008). The Canadian journal of cardiology, 24 Suppl A(Suppl A), 3A-8A.
Cooper Kenneth.’A means of assessing maximal oxygen uptake’ (1968). Journal of the
American Medical Association. 203:201-204.
Hutchinson Alex. ‘Is VO2 max proportional to weight?’< https://www.runnersworld.com/health-
injuries/a20817982/is-vo2max-proportional-to-weight/> Accessed 5 February 2019
Kiningam Robert, Hunter Tarannum and Kumagai Arno .’Exercise and Fitness’. (2018) <
https://www.sciencedirect.com/sdfe/pdf/download/eid/3-s2.0-B9781416030003100218/first-
page-pdf >Accessed 5 Feb 2019.
Mike Bundy. ‘VO2 Max Testing-A Guide to Sports and Injury Management’ (2010) <Accessed
from https://www.sciencedirect.com/topics/medicine-and-dentistry/vo2-max> Accessed 5 Feb
2019
Rao Anita. Comparison of non-exercise test and step test in estimation of aerobic capacity.
National Journal of Physiology, Pharmacy & Pharmacology, 2014, 4(3), pp. 218 – 220. DOI:
10.5455/njppp.2014.4.150420141
Robinson Kara. ‘5 Heart Rate Myths Debunked’(2019). <https://www.webmd.com/g00/heart-
disease/features/5-heart-rate-myths-debunked?
i10c.ua=1&i10c.encReferrer=aHR0cHM6Ly93d3cuZ29vZ2xlLmNvbS8%3d&i10c.dv=20>
Sullivan Katherine.’Aerobic fitness levels and validation of a non exercise VO2max prediction
equation for HIV-infected patients on HAART’ (2014) HIV clinical trials vol. 15,2 (2014): 69-
77.
Student Number- …………………. 9
Sydo Nora, Abdelmoneim Sahar.’ THE RELATIONSHIP BETWEEN EXERCISE HEART
RATE AND AGE IN MEN VERSUS WOMEN’ (2014). Journal of the American College of
Cardiology. 63(12). April 2014. DOI: 10.1016/S0735-1097(14)61658-2
Final Word Count-………
Sydo Nora, Abdelmoneim Sahar.’ THE RELATIONSHIP BETWEEN EXERCISE HEART
RATE AND AGE IN MEN VERSUS WOMEN’ (2014). Journal of the American College of
Cardiology. 63(12). April 2014. DOI: 10.1016/S0735-1097(14)61658-2
Final Word Count-………
⊘ This is a preview!⊘
Do you want full access?
Subscribe today to unlock all pages.
Trusted by 1+ million students worldwide
1 out of 9
Related Documents


Your All-in-One AI-Powered Toolkit for Academic Success.
+13062052269
info@desklib.com
Available 24*7 on WhatsApp / Email
![[object Object]](/_next/static/media/star-bottom.7253800d.svg)
Unlock your academic potential
Copyright © 2020–2026 A2Z Services. All Rights Reserved. Developed and managed by ZUCOL.