Mechanical Engineering: Heat Treatment and Properties Analysis

Verified

Added on  2020/04/13

|11
|1749
|78
Practical Assignment
AI Summary
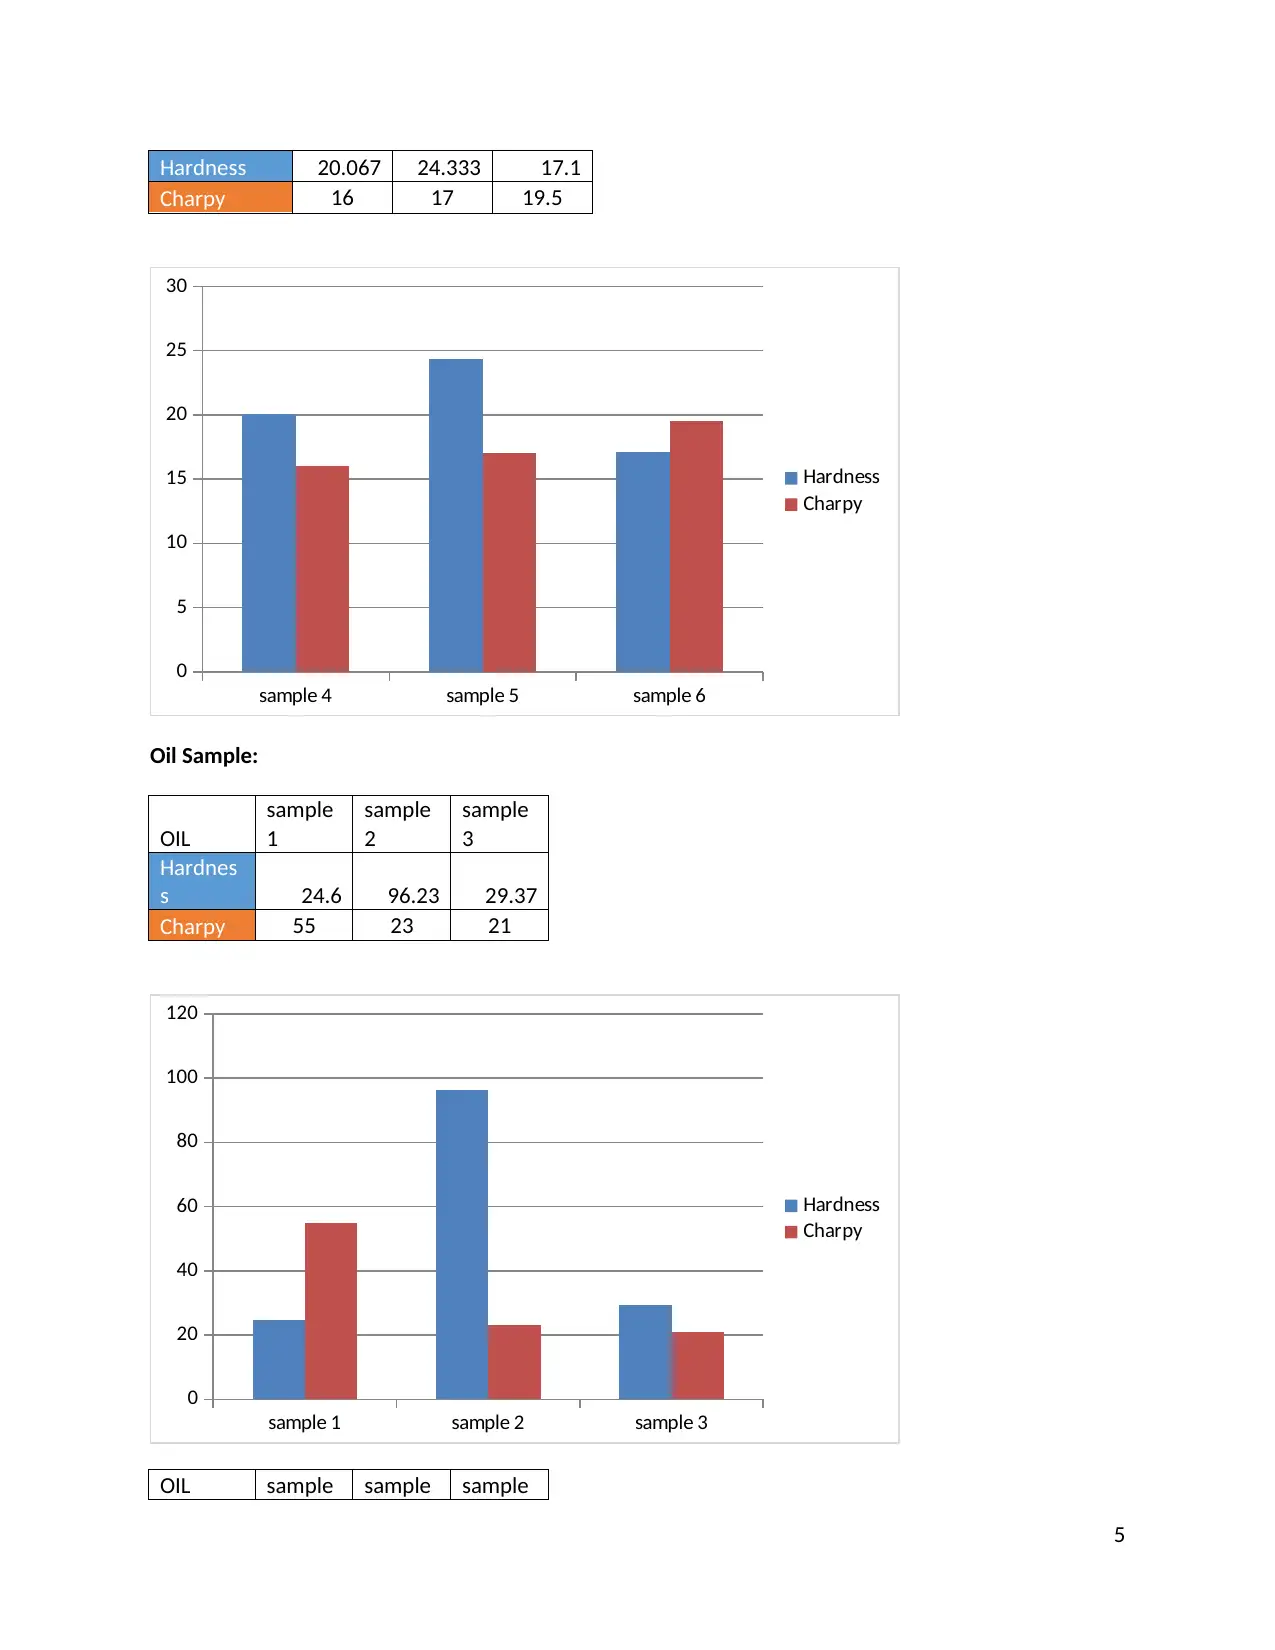
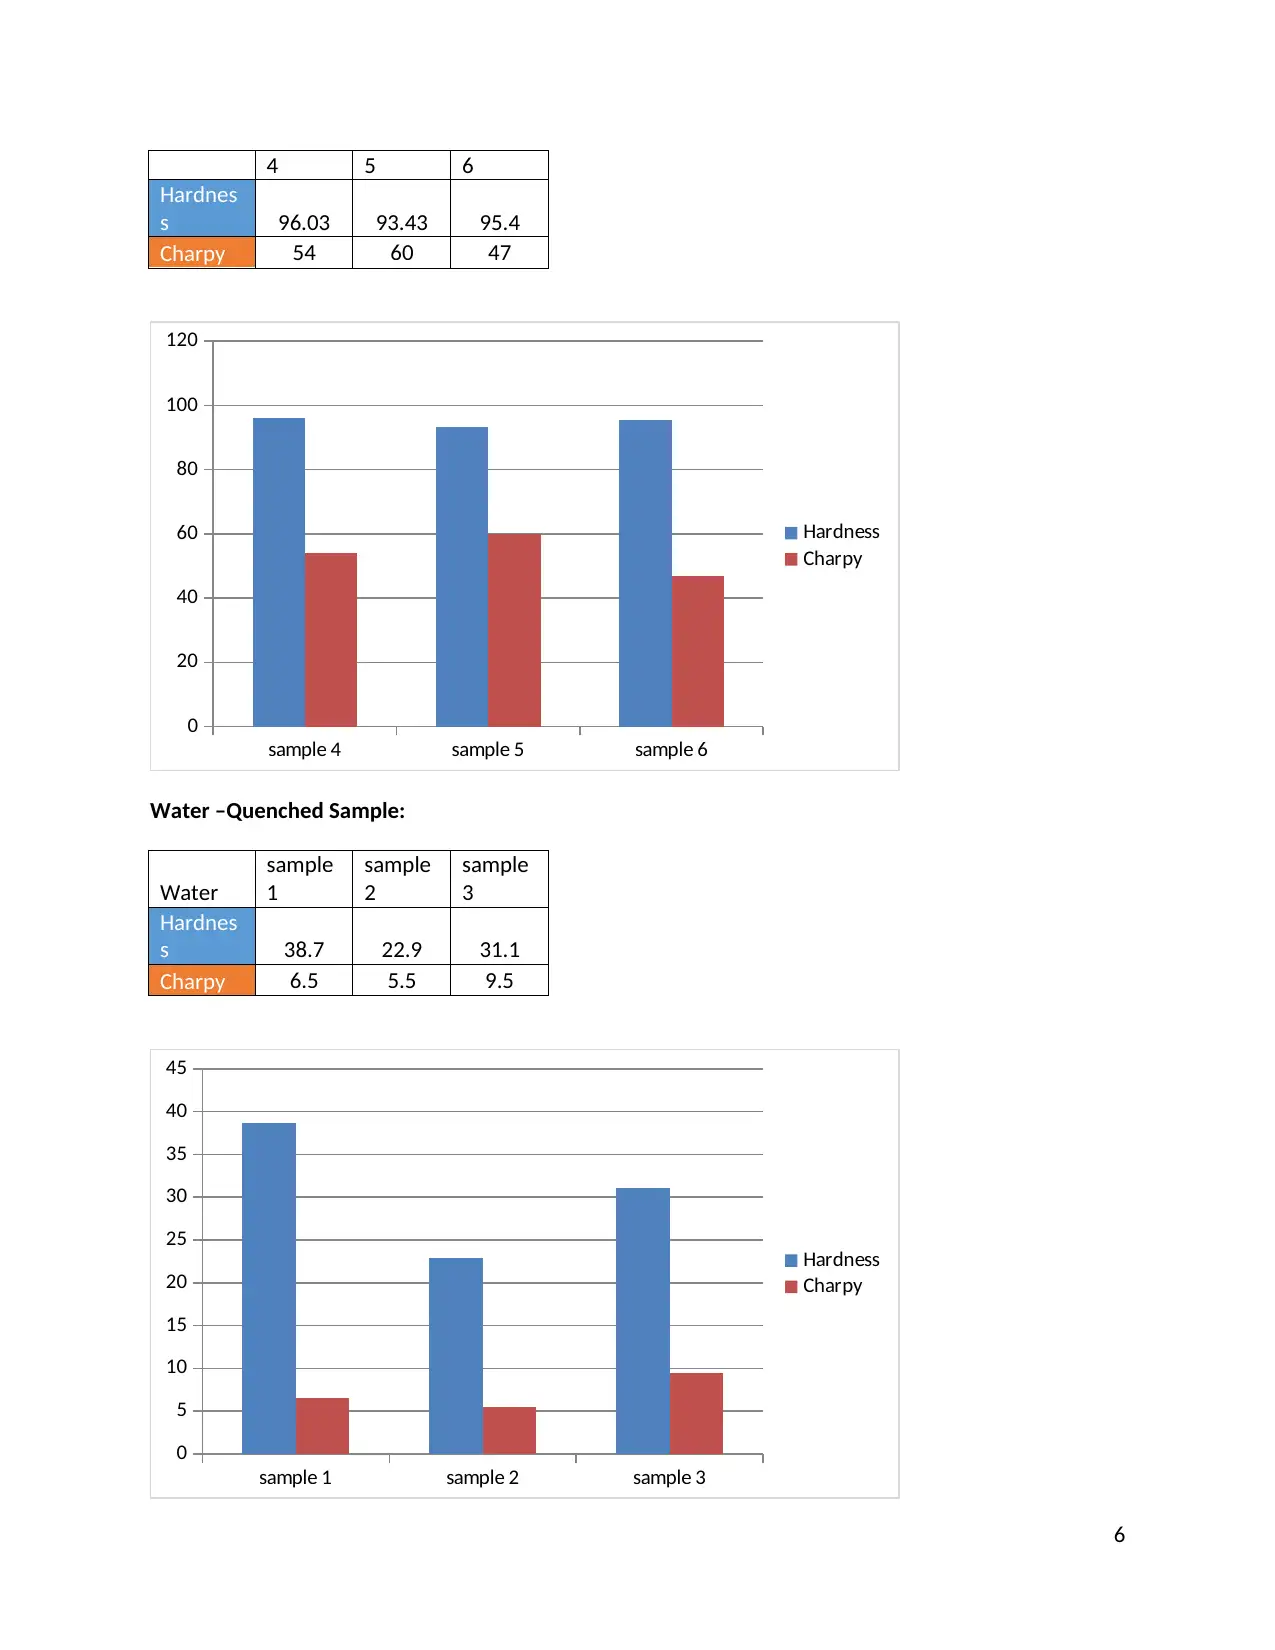
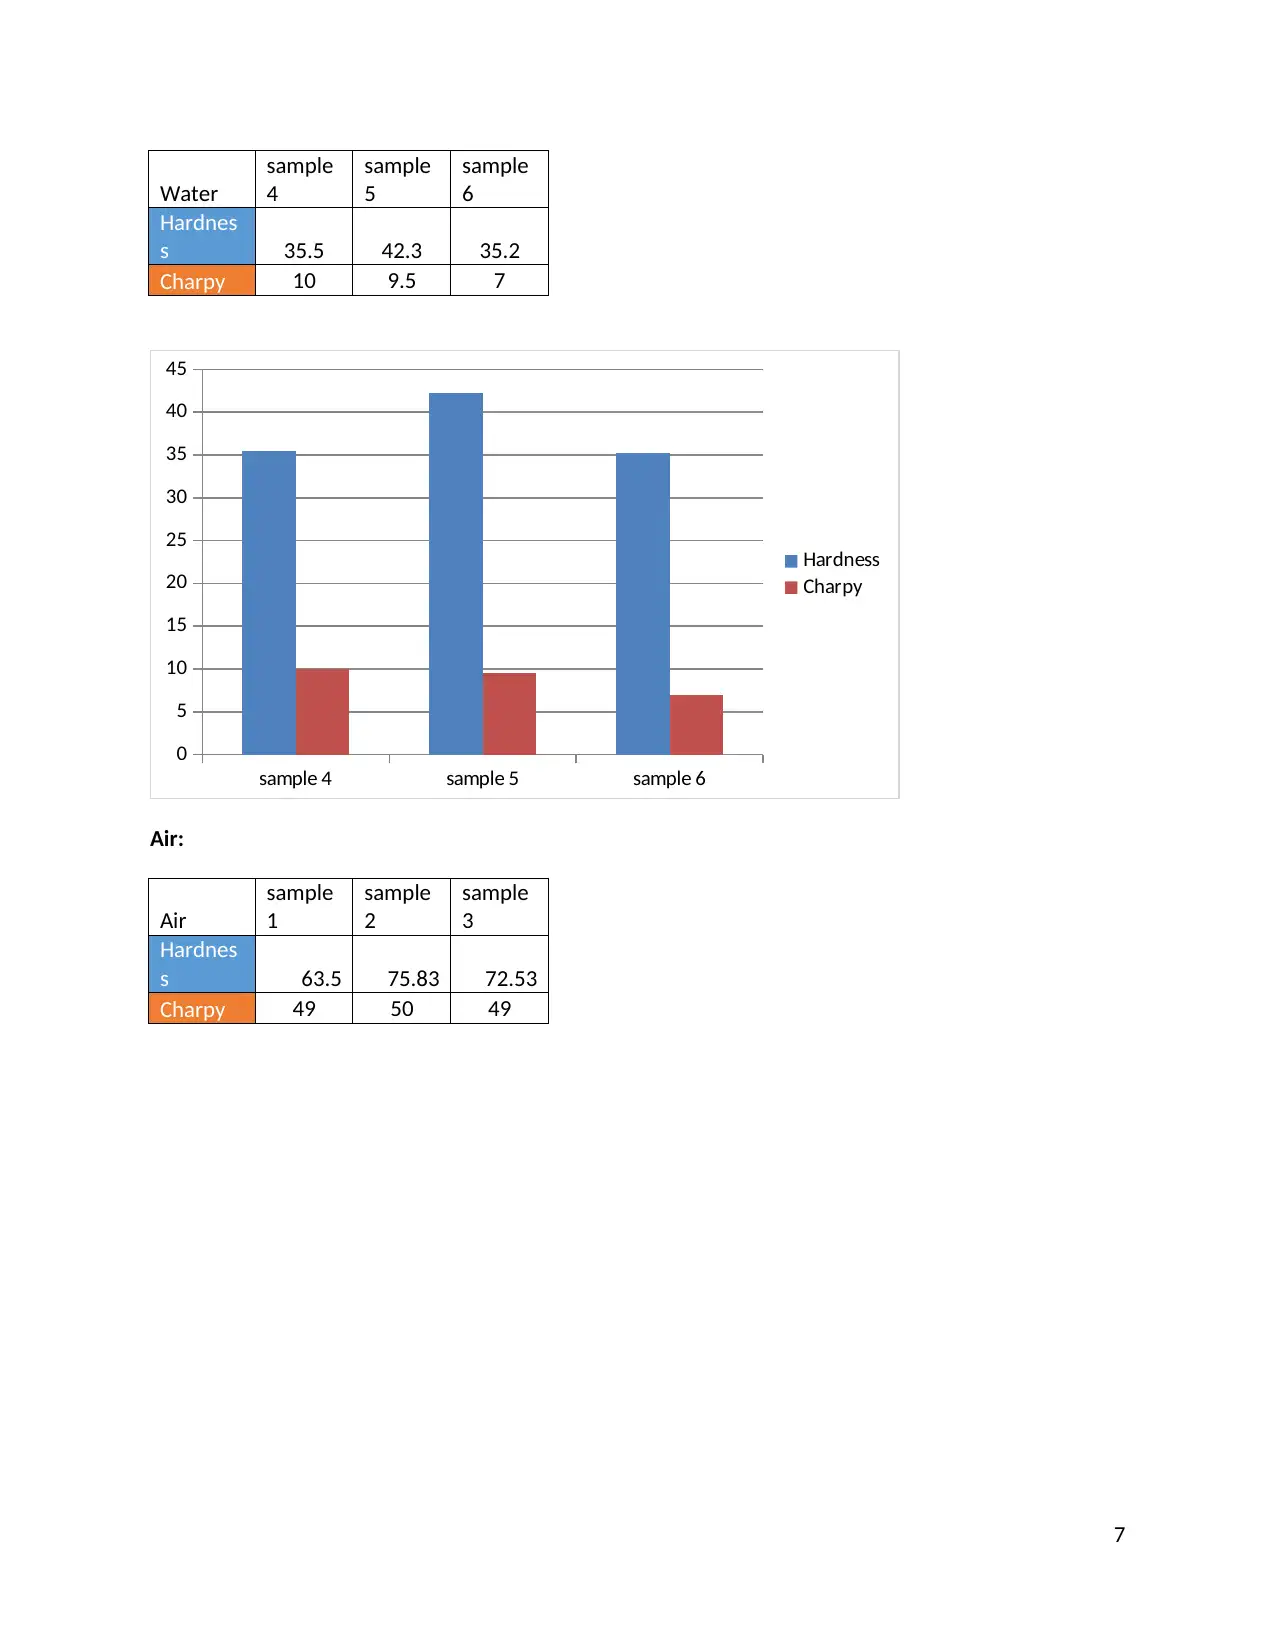
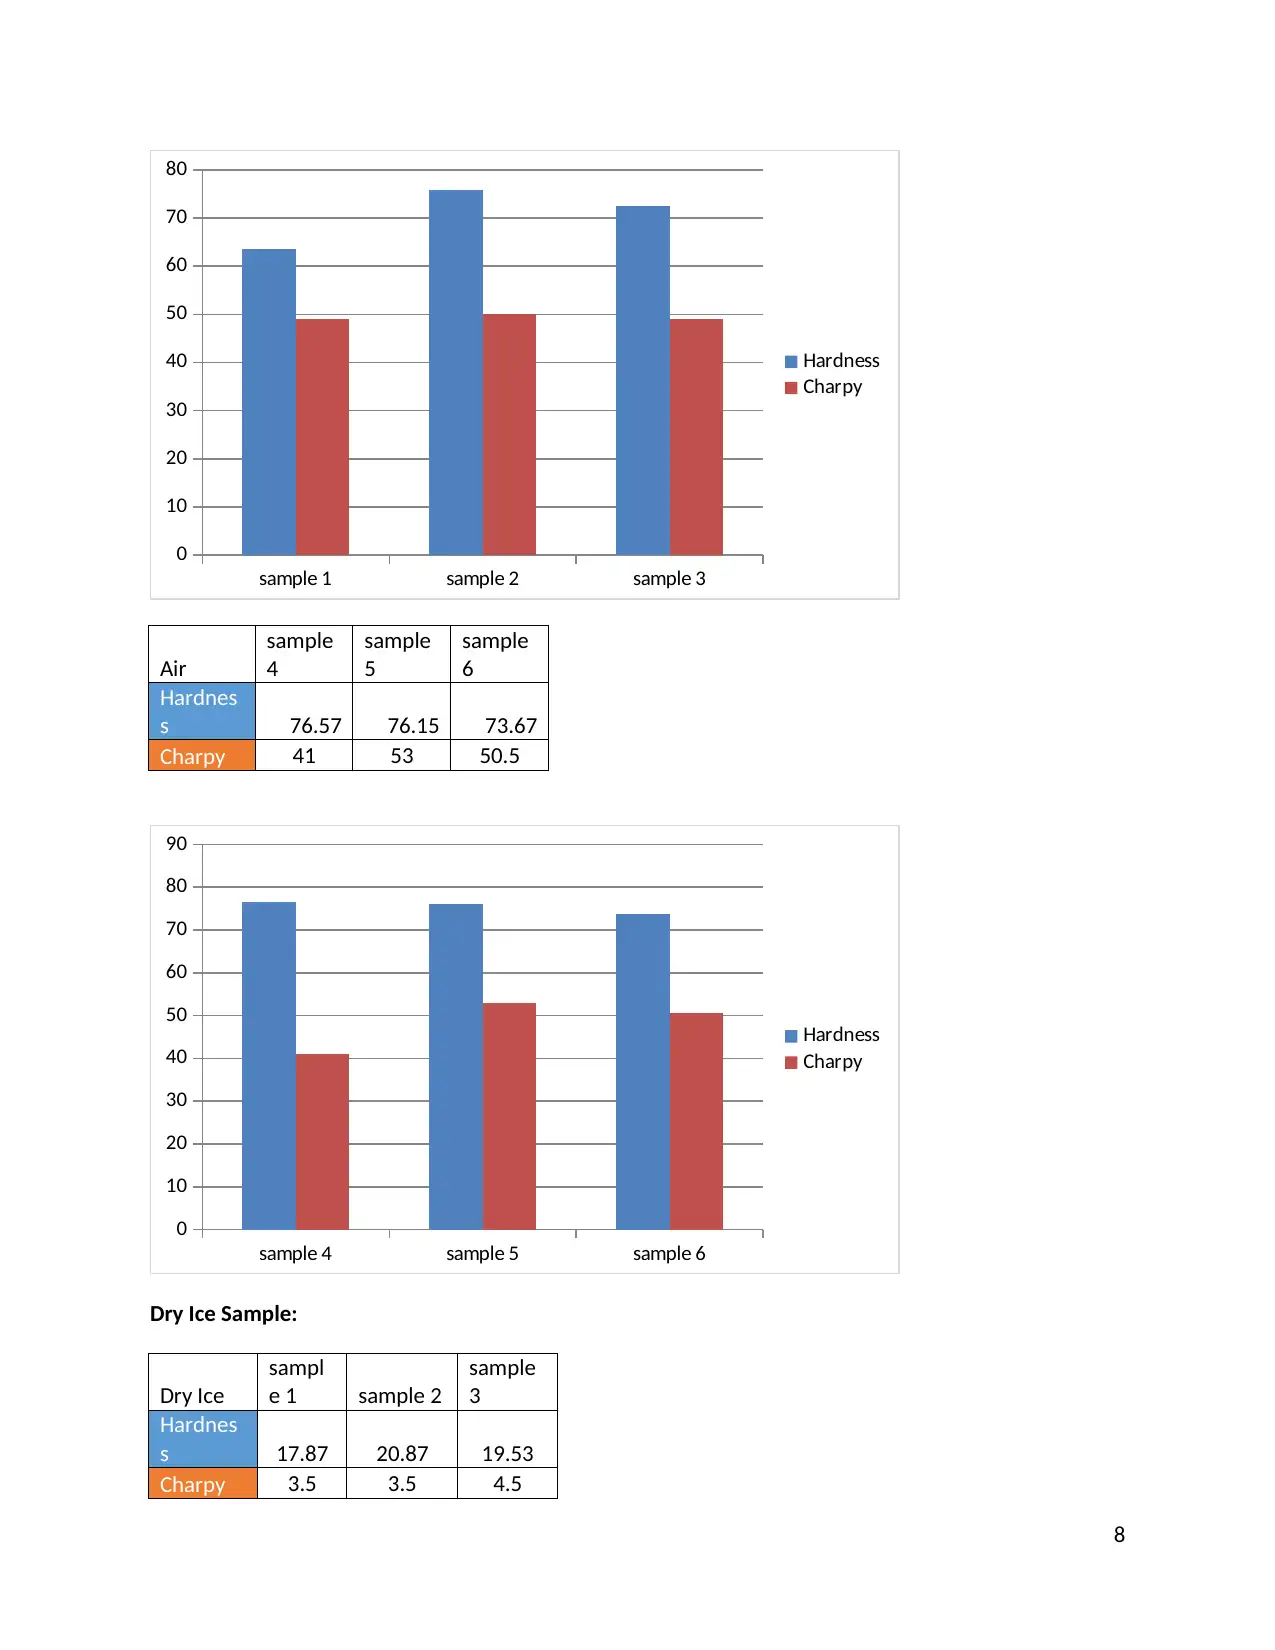
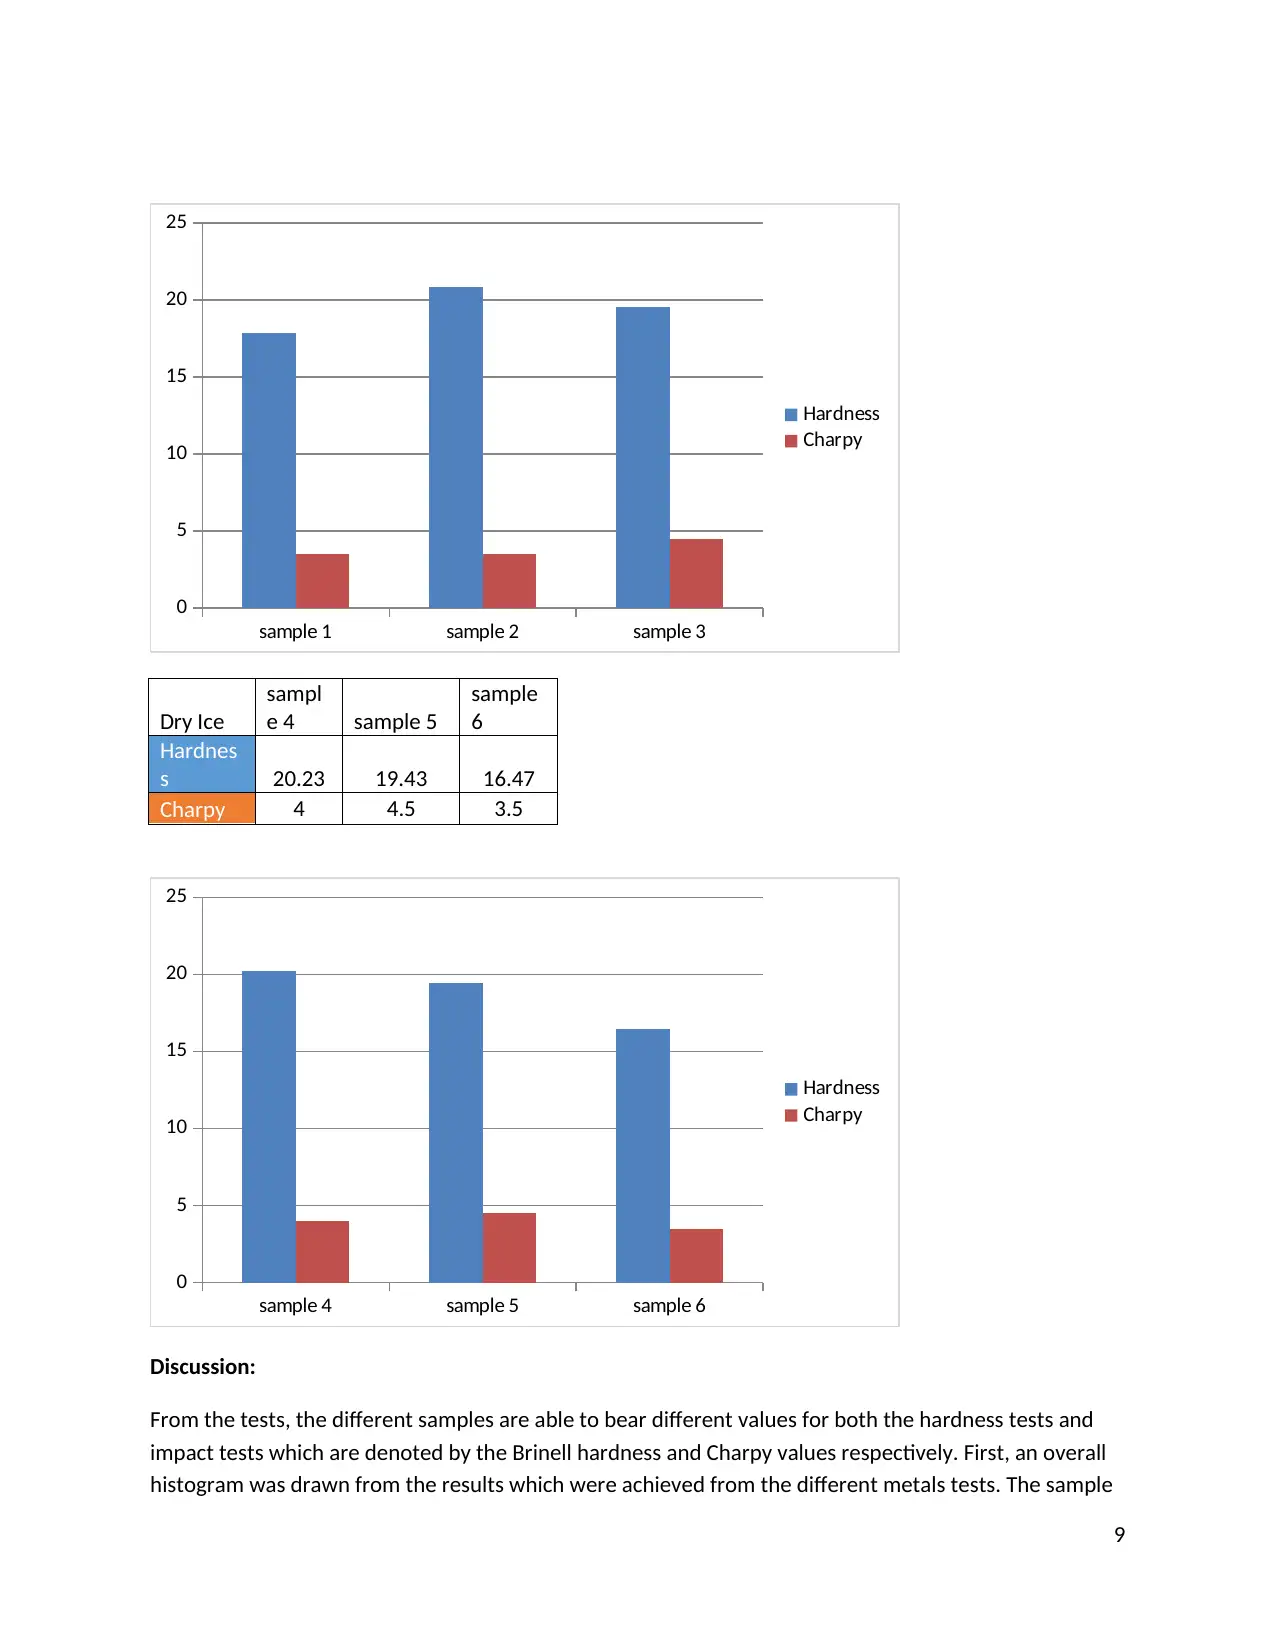
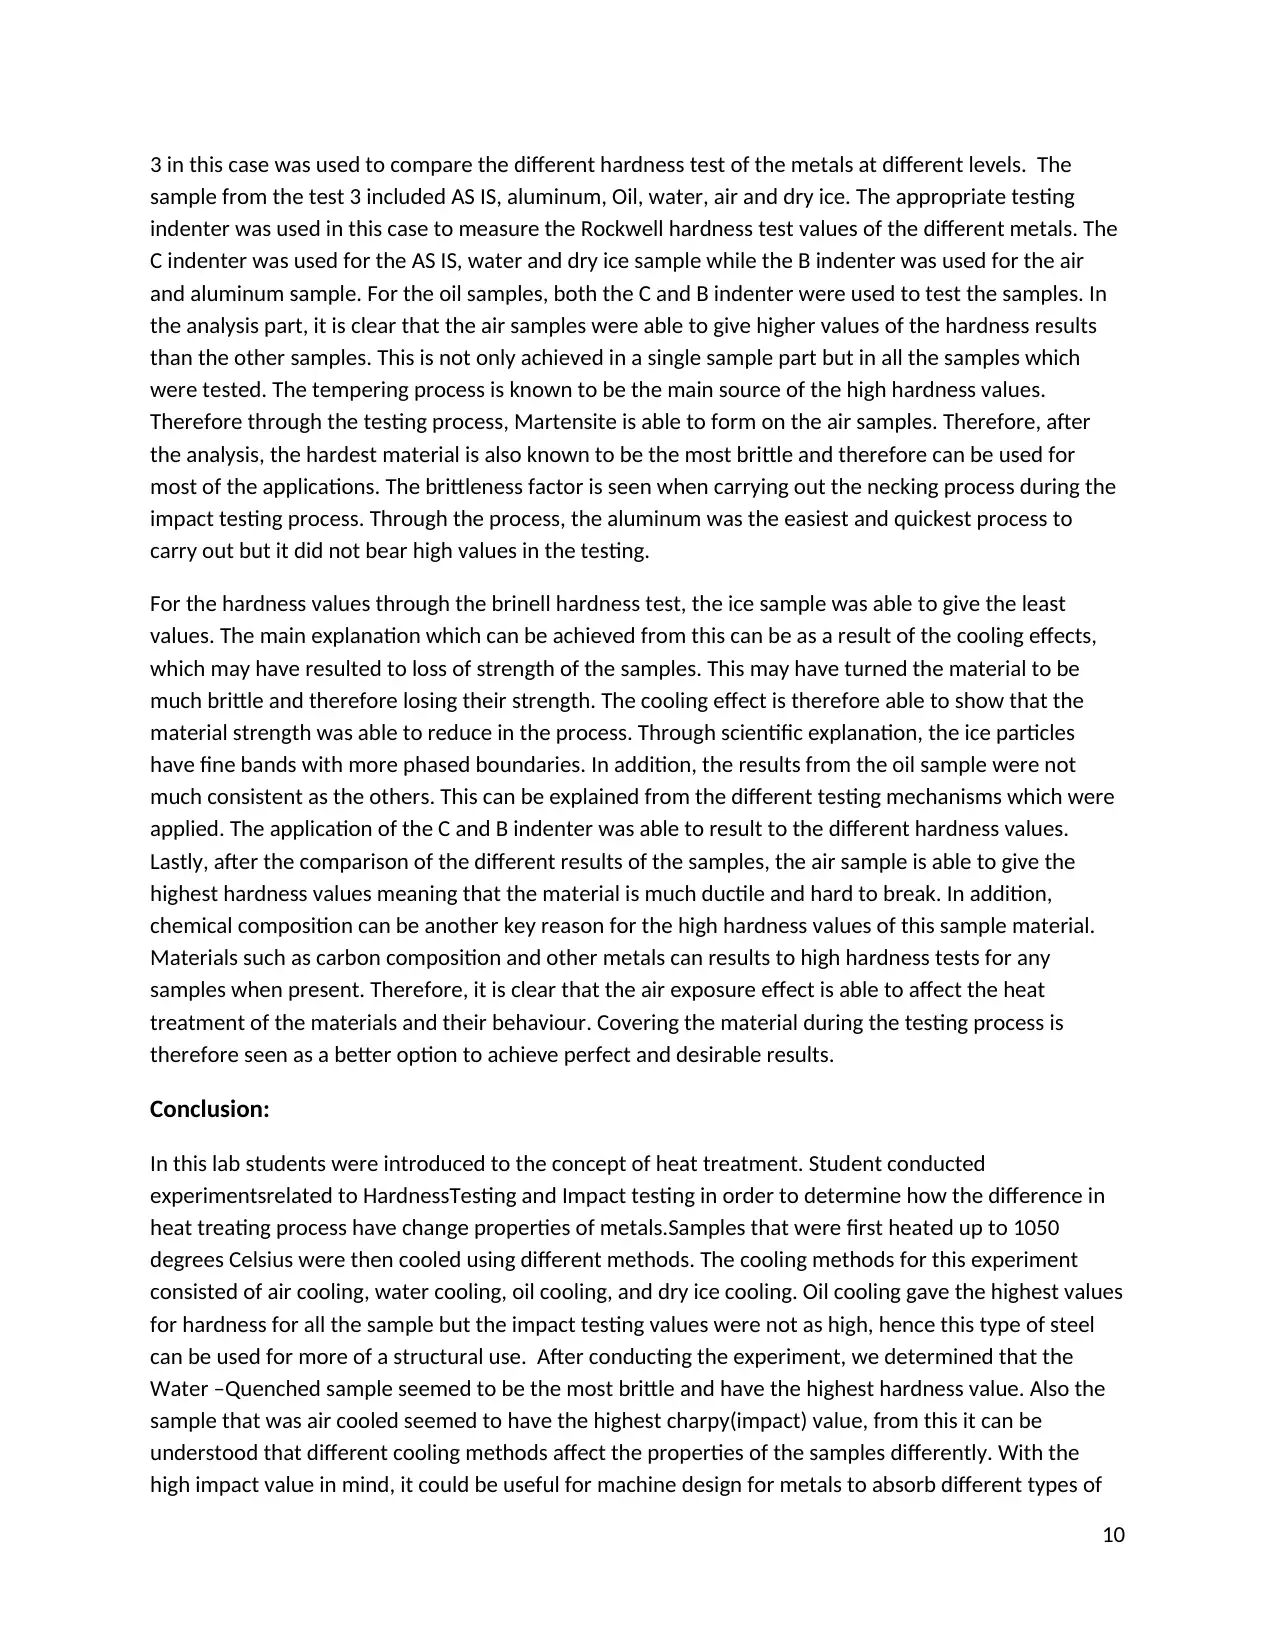
This lab report details an experiment on the heat treatment of metals, focusing on how different cooling methods affect material properties. The experiment involved heating metal samples to 1050 degrees Celsius and then cooling them using various methods: air, water, oil, and dry ice. Students conducted Rockwell hardness tests and impact tests (Charpy) to measure the resulting changes in hardness and impact resistance. The report presents the experimental procedures, equipment used (Rockwell hardness tester, impact testing machine, and materials), data tables, and graphical representations of the results. The discussion analyzes the relationship between cooling methods and material properties, noting that air-cooled samples exhibited higher hardness values, while water-quenched samples were the most brittle. The conclusion highlights an inverse relationship between hardness and impact resistance, emphasizing the importance of heat treatment in tailoring materials for specific applications, such as machine design. The report also includes recommendations for improving the experimental process, such as pre-sanding samples to save time.
Document Page
Introduction:
Heat treatment of metal is the main concept which this lab is able to introduce. Understanding the
effects of heat treatment on the microstructure of materials and the relevant changes in properties
compose the objective of the lab. Heat treatment process is essential for industrial engineers especially
the ones in machine design, civil engineers and manufacturing industry. Through this lab, the students
are able to test for hardness of the materials using equipments used to measure hardness and durability
values.
The resistance to penetration on a particular surface for an object is measured through hardness tests.
The depth of penetration on the object is usually measured and then the testing machine converts the
depth values to hardness number. On the other hand, the impact test is done by subjecting the objects
on sudden intense blow whereby the strain rate is rapid. Through the testing, the strain rate may seem
to be more brittle manner than it is observed in the tensile test. Lastly, the materials provided were heat
treated to 1050 degrees Celsius, which is above the materials crystallization point and different tests
were performed to find properties of the materials.
Equipment:
The following equipment were used in the carrying out the experiment
- Rockwell Hardness Testing Machine
- Impact Testing Machine (Charpy)
- As Is Sample
- Aluminum
- Oil(3 batch 3)
- Water-Quenched Sample
- Metal tongs
- Sand Paper
Procedure:
Different sections were used in the carrying out the experiment. The key subsections included sanding
(Preparing metal), Hardness testing (Rockwell Testing) and impact testing:
Sanding (preparing metal):
1. Get the Oil treated and As Is sample
2. Using the sand paper to sand the two samples above
3. Finish sanding until an area is exposed on the metal to use the Rockwell testing
machine.
Hardness testing (Rockwell Testing):
1. Calibration of the machine correctly is first carried out.
2. Ensuring that the correct indenters are in place for the metals. (Use C indenter for
Water Quenched, Oil and As Is materials; And use B indenter for Aluminum)
3. Lock on the metal on to the machine’s calipers until a clicking sound is heard.
1
tabler-icon-diamond-filled.svg

Secure Best Marks with AI Grader

Need help grading? Try our AI Grader for instant feedback on your assignments.
Document Page
4. Press start on the digital screen
5. Read value from the digital screen
6. Repeat process for 3 trials.
Impact testing:
1. Lift the big lever of the impact testing machine and lock the safety switch ON (the
lever should be lifted using two people).
2. Place the material sample into the slot using the metal tongs.
3. Ensure that the metal sample is in the correct spot and firmly held in place with
minimal wiggle room.
4. Step away from machine and press the switch to release the lever causing it to
swing and breaking the material sample into two pieces.
5. Obtain the charpy value off the scale and record this value
6. Examine the broken sample.
Data:
The following table shows the values recorded for hardness and impact tests:
As Is [3]
(HRC)
Aluminum
[3](HRB)
Water
Quenched
[3] (HRC) Oil [3]
Air (3) Dry ice (3)
Hard
ness
19
.1
19
.8
18
.9
19
.3
20
.3
2
0
.
8
3
2
33.
1
31
.1
2
7
.
2
26.
3
34.
6
76.
3
74.
3
67 20.
6
19 19
Char
py 12 20 9.5 21
49 4.5
The following table shows the average values recorded for the hardness and impact tests:
As Is[3] Aluminum[3] Water[3] Oil [3] Dry Ice [3] Air (3)
Hardness 19.3 20.13 31.1 29.4 19.5 72.53
Charpy 12 20 9.5 21 4.5 49
The following are histogram graphs obtained for the required for the recorded values for hardness and
impact tests:
2
Document Page
As Is[3] Aluminum
[3] Water[3] Oil [3] Dry Ice [3] Air (3)
0
10
20
30
40
50
60
70
80
Hardness
Charpy
The data found for other samples and their graphs are as follows:
As Is (Steel ) Sample:
As Is
sample
1
sample
2
sample
3
Hardnes
s 17 18.9 19.27
Charpy 17.5 15 12.0
sample 1 sample 2 sample 3
0
5
10
15
20
25
Hardness
Charpy
As Is
sample
4
sample
5
sample
6
Hardnes
s 16.9 18.6 17
3
Document Page
Charpy 12.0 9.5 9.5
sample 4 sample 5 sample 6
0
2
4
6
8
10
12
14
16
18
20
Hardness
Charpy
Aluminum Sample
Aluminum
sample
1
sample
2
sample
3
Hardness 18.467 22.1 20.133
Charpy 19.5 17.5 20
sample 1 sample 2 sample 3
0
5
10
15
20
25
Hardness
Charpy
Aluminum
sample
4
sample
5
sample
6
4
tabler-icon-diamond-filled.svg

Secure Best Marks with AI Grader

Need help grading? Try our AI Grader for instant feedback on your assignments.
Document Page
Hardness 20.067 24.333 17.1
Charpy 16 17 19.5
sample 4 sample 5 sample 6
0
5
10
15
20
25
30
Hardness
Charpy
Oil Sample:
OIL
sample
1
sample
2
sample
3
Hardnes
s 24.6 96.23 29.37
Charpy 55 23 21
sample 1 sample 2 sample 3
0
20
40
60
80
100
120
Hardness
Charpy
OIL sample sample sample
5
Document Page
4 5 6
Hardnes
s 96.03 93.43 95.4
Charpy 54 60 47
sample 4 sample 5 sample 6
0
20
40
60
80
100
120
Hardness
Charpy
Water –Quenched Sample:
Water
sample
1
sample
2
sample
3
Hardnes
s 38.7 22.9 31.1
Charpy 6.5 5.5 9.5
sample 1 sample 2 sample 3
0
5
10
15
20
25
30
35
40
45
Hardness
Charpy
6
Document Page
Water
sample
4
sample
5
sample
6
Hardnes
s 35.5 42.3 35.2
Charpy 10 9.5 7
sample 4 sample 5 sample 6
0
5
10
15
20
25
30
35
40
45
Hardness
Charpy
Air:
Air
sample
1
sample
2
sample
3
Hardnes
s 63.5 75.83 72.53
Charpy 49 50 49
7
tabler-icon-diamond-filled.svg

Paraphrase This Document

Need a fresh take? Get an instant paraphrase of this document with our AI Paraphraser
Document Page
sample 1 sample 2 sample 3
0
10
20
30
40
50
60
70
80
Hardness
Charpy
Air
sample
4
sample
5
sample
6
Hardnes
s 76.57 76.15 73.67
Charpy 41 53 50.5
sample 4 sample 5 sample 6
0
10
20
30
40
50
60
70
80
90
Hardness
Charpy
Dry Ice Sample:
Dry Ice
sampl
e 1 sample 2
sample
3
Hardnes
s 17.87 20.87 19.53
Charpy 3.5 3.5 4.5
8
Document Page
sample 1 sample 2 sample 3
0
5
10
15
20
25
Hardness
Charpy
Dry Ice
sampl
e 4 sample 5
sample
6
Hardnes
s 20.23 19.43 16.47
Charpy 4 4.5 3.5
sample 4 sample 5 sample 6
0
5
10
15
20
25
Hardness
Charpy
Discussion:
From the tests, the different samples are able to bear different values for both the hardness tests and
impact tests which are denoted by the Brinell hardness and Charpy values respectively. First, an overall
histogram was drawn from the results which were achieved from the different metals tests. The sample
9
Document Page
3 in this case was used to compare the different hardness test of the metals at different levels. The
sample from the test 3 included AS IS, aluminum, Oil, water, air and dry ice. The appropriate testing
indenter was used in this case to measure the Rockwell hardness test values of the different metals. The
C indenter was used for the AS IS, water and dry ice sample while the B indenter was used for the air
and aluminum sample. For the oil samples, both the C and B indenter were used to test the samples. In
the analysis part, it is clear that the air samples were able to give higher values of the hardness results
than the other samples. This is not only achieved in a single sample part but in all the samples which
were tested. The tempering process is known to be the main source of the high hardness values.
Therefore through the testing process, Martensite is able to form on the air samples. Therefore, after
the analysis, the hardest material is also known to be the most brittle and therefore can be used for
most of the applications. The brittleness factor is seen when carrying out the necking process during the
impact testing process. Through the process, the aluminum was the easiest and quickest process to
carry out but it did not bear high values in the testing.
For the hardness values through the brinell hardness test, the ice sample was able to give the least
values. The main explanation which can be achieved from this can be as a result of the cooling effects,
which may have resulted to loss of strength of the samples. This may have turned the material to be
much brittle and therefore losing their strength. The cooling effect is therefore able to show that the
material strength was able to reduce in the process. Through scientific explanation, the ice particles
have fine bands with more phased boundaries. In addition, the results from the oil sample were not
much consistent as the others. This can be explained from the different testing mechanisms which were
applied. The application of the C and B indenter was able to result to the different hardness values.
Lastly, after the comparison of the different results of the samples, the air sample is able to give the
highest hardness values meaning that the material is much ductile and hard to break. In addition,
chemical composition can be another key reason for the high hardness values of this sample material.
Materials such as carbon composition and other metals can results to high hardness tests for any
samples when present. Therefore, it is clear that the air exposure effect is able to affect the heat
treatment of the materials and their behaviour. Covering the material during the testing process is
therefore seen as a better option to achieve perfect and desirable results.
Conclusion:
In this lab students were introduced to the concept of heat treatment. Student conducted
experimentsrelated to HardnessTesting and Impact testing in order to determine how the difference in
heat treating process have change properties of metals.Samples that were first heated up to 1050
degrees Celsius were then cooled using different methods. The cooling methods for this experiment
consisted of air cooling, water cooling, oil cooling, and dry ice cooling. Oil cooling gave the highest values
for hardness for all the sample but the impact testing values were not as high, hence this type of steel
can be used for more of a structural use. After conducting the experiment, we determined that the
Water –Quenched sample seemed to be the most brittle and have the highest hardness value. Also the
sample that was air cooled seemed to have the highest charpy(impact) value, from this it can be
understood that different cooling methods affect the properties of the samples differently. With the
high impact value in mind, it could be useful for machine design for metals to absorb different types of
10
tabler-icon-diamond-filled.svg

Secure Best Marks with AI Grader

Need help grading? Try our AI Grader for instant feedback on your assignments.
Document Page
shock loads.Lastly it can be understood that if a sample with a high impact is needed, then a metal with
a smaller hardness valueprepared. Hence there is an inversely proportional relationship between
hardness values and impact testing values. Overall, it said this experiment was a success.
Recommendations for this experiment would be to have the oil and As Is sample sand-papered before in
order to save time and the functions of the machines should be kept in mind while performing the
experiments.
11
chevron_up_icon
1 out of 11
circle_padding
hide_on_mobile
zoom_out_icon
logo.png

Your All-in-One AI-Powered Toolkit for Academic Success.

Available 24*7 on WhatsApp / Email

[object Object]