Hydrology Report: HEC-RAS Example Application in River Analysis

Verified

Added on  2023/06/11

|12
|1769
|111
Report
AI Summary
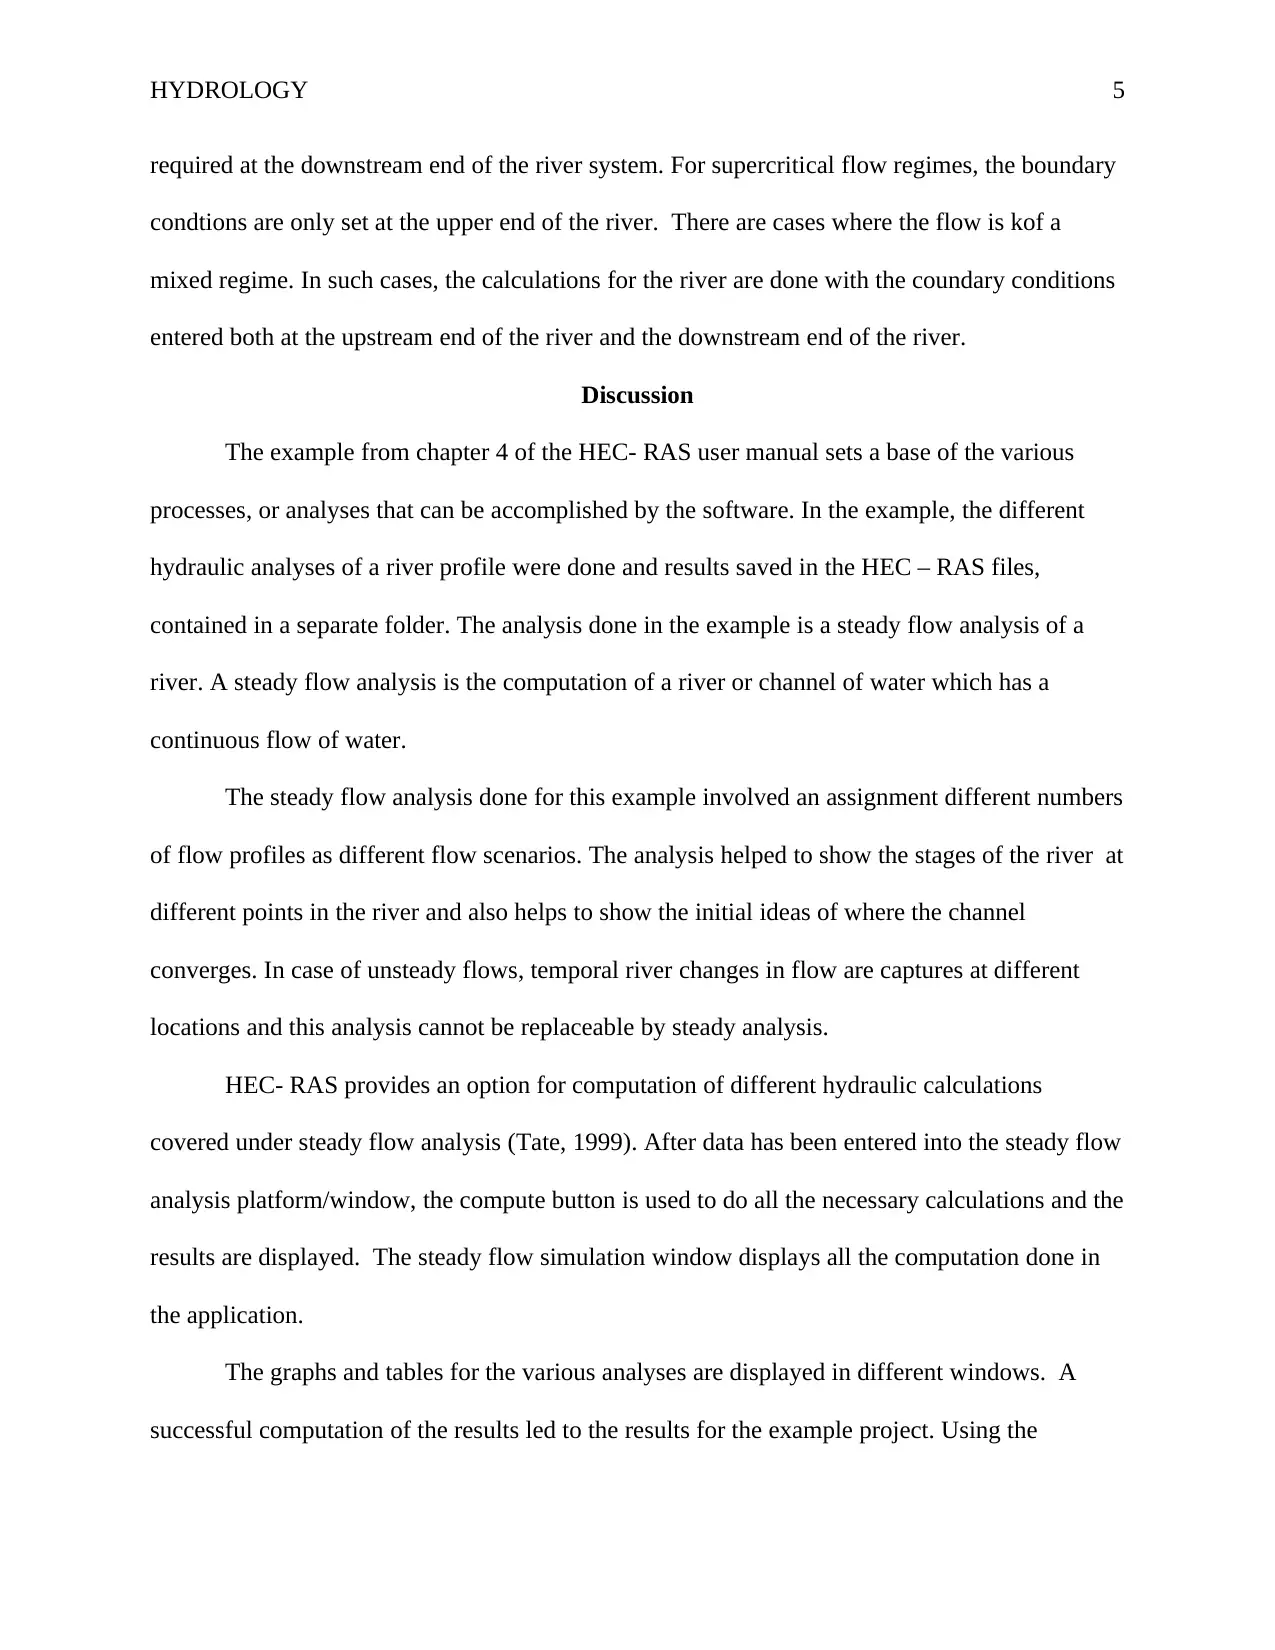
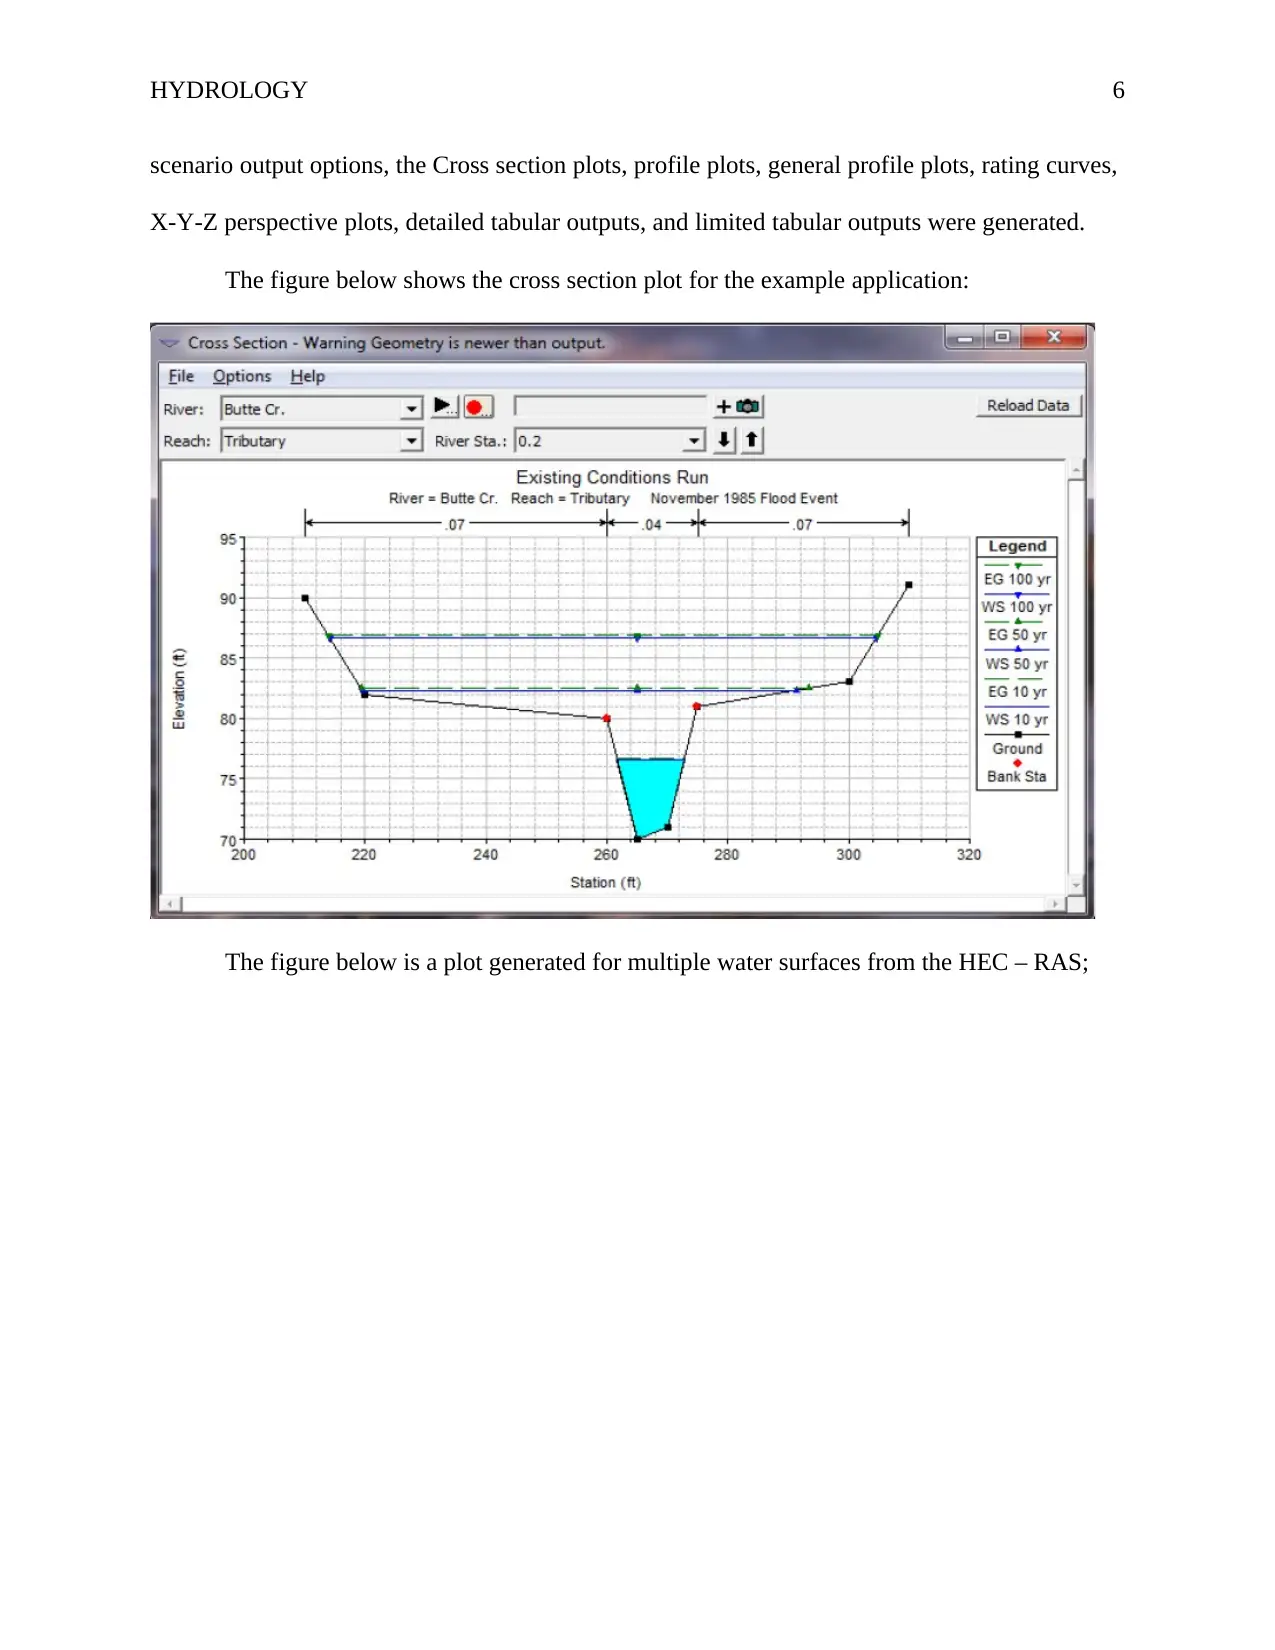
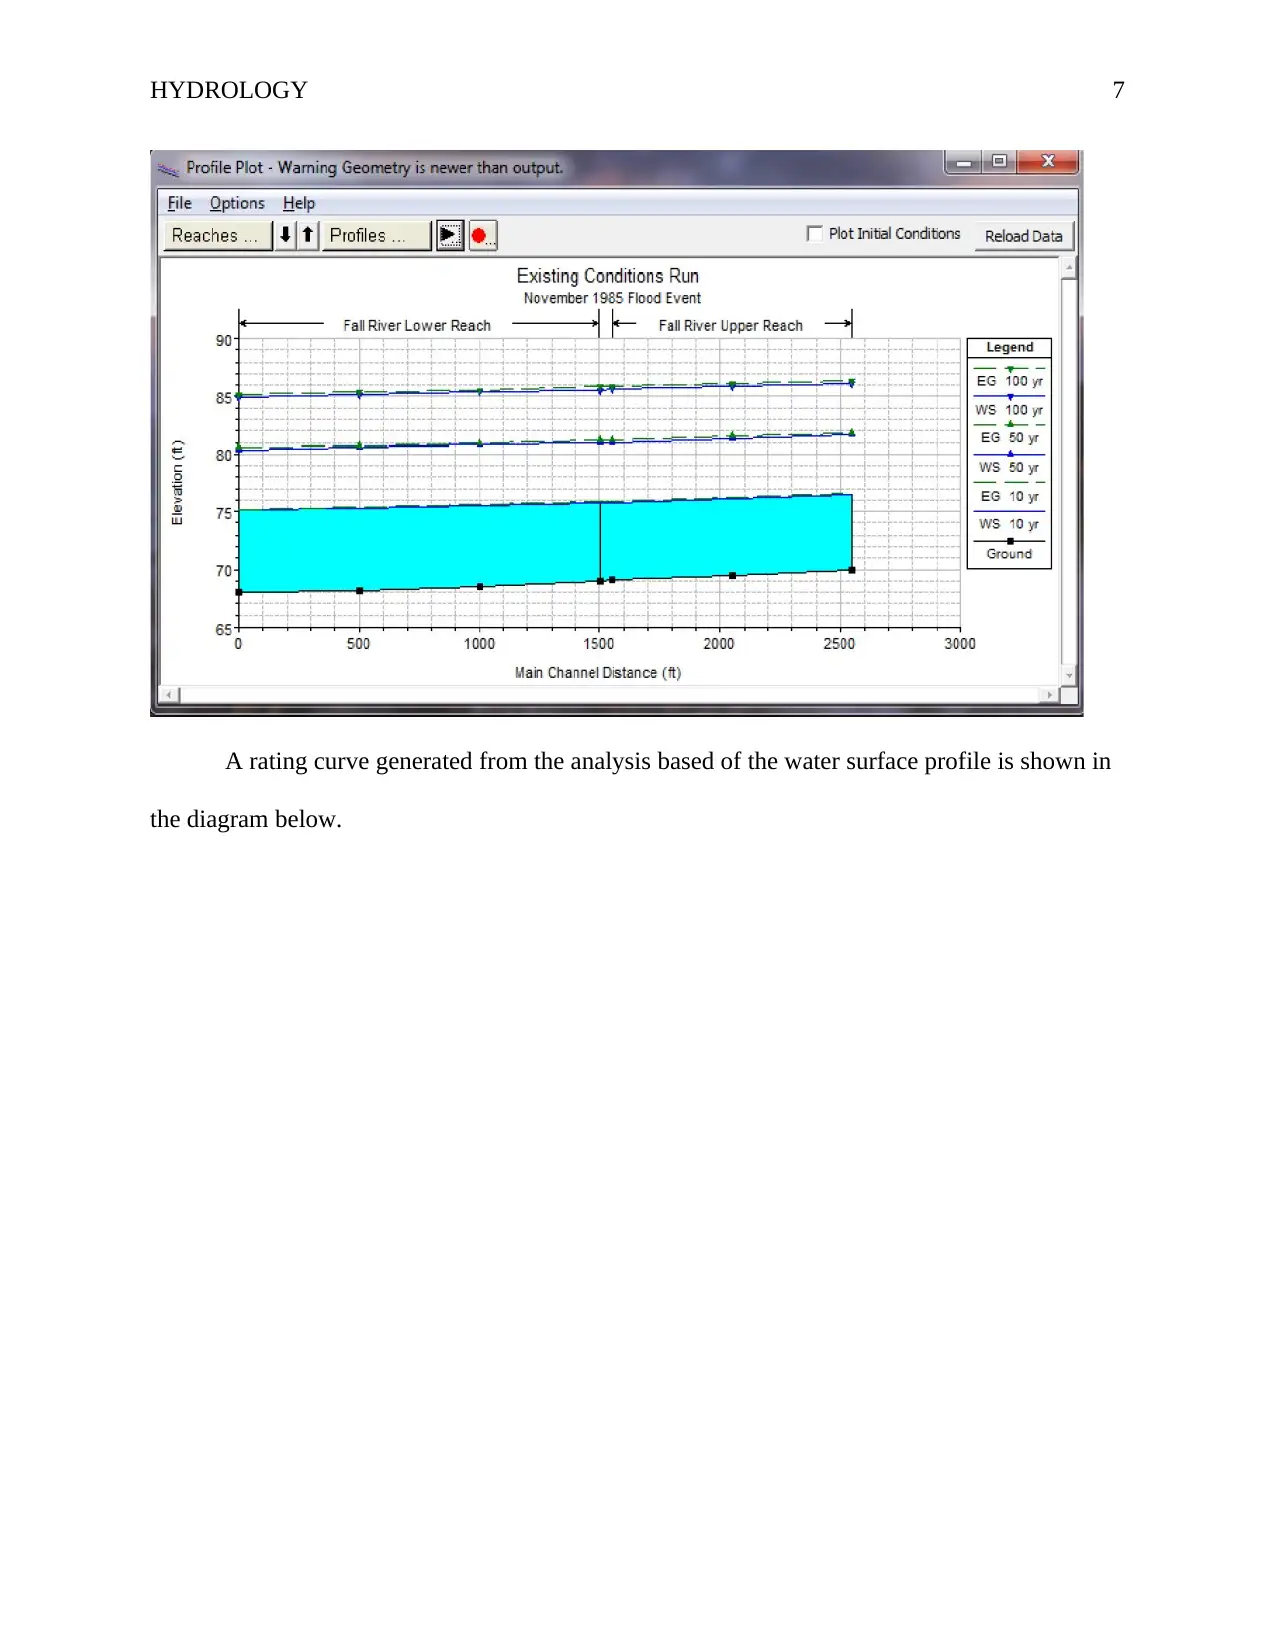
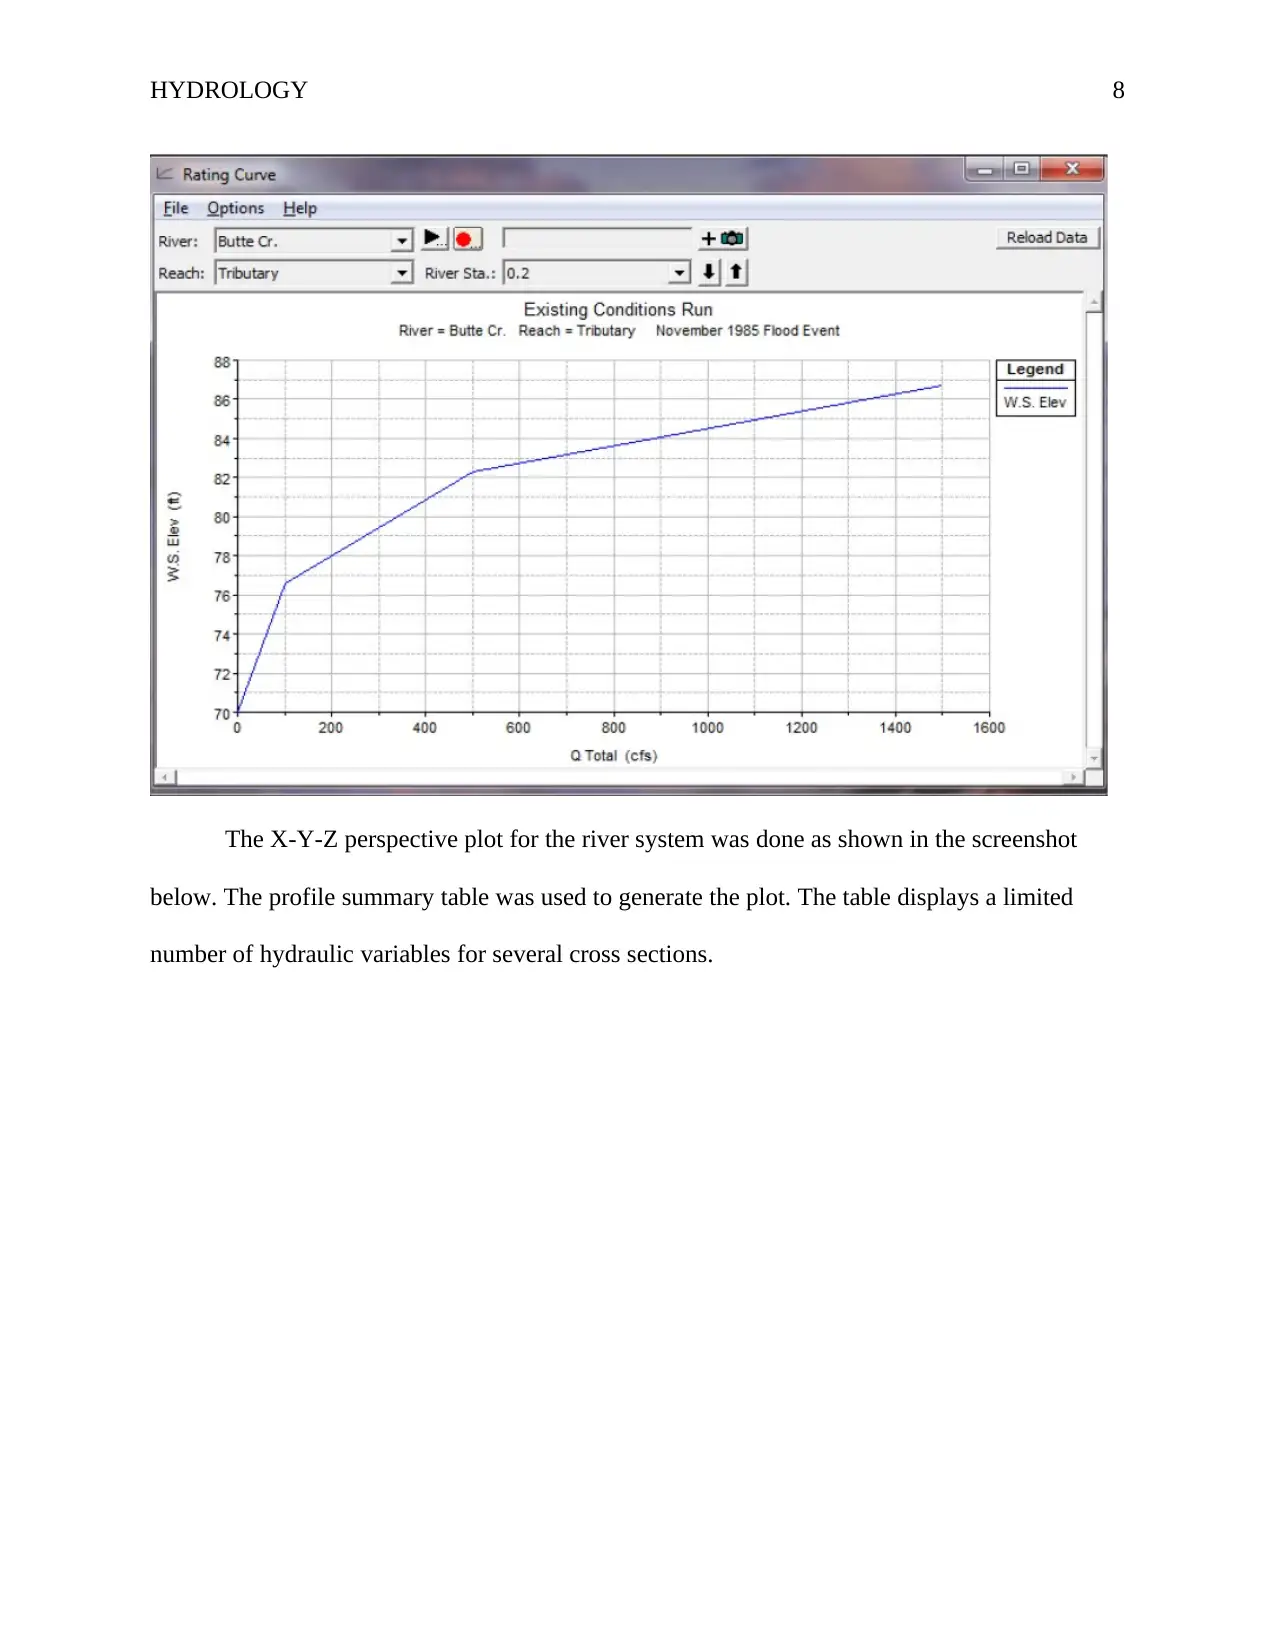
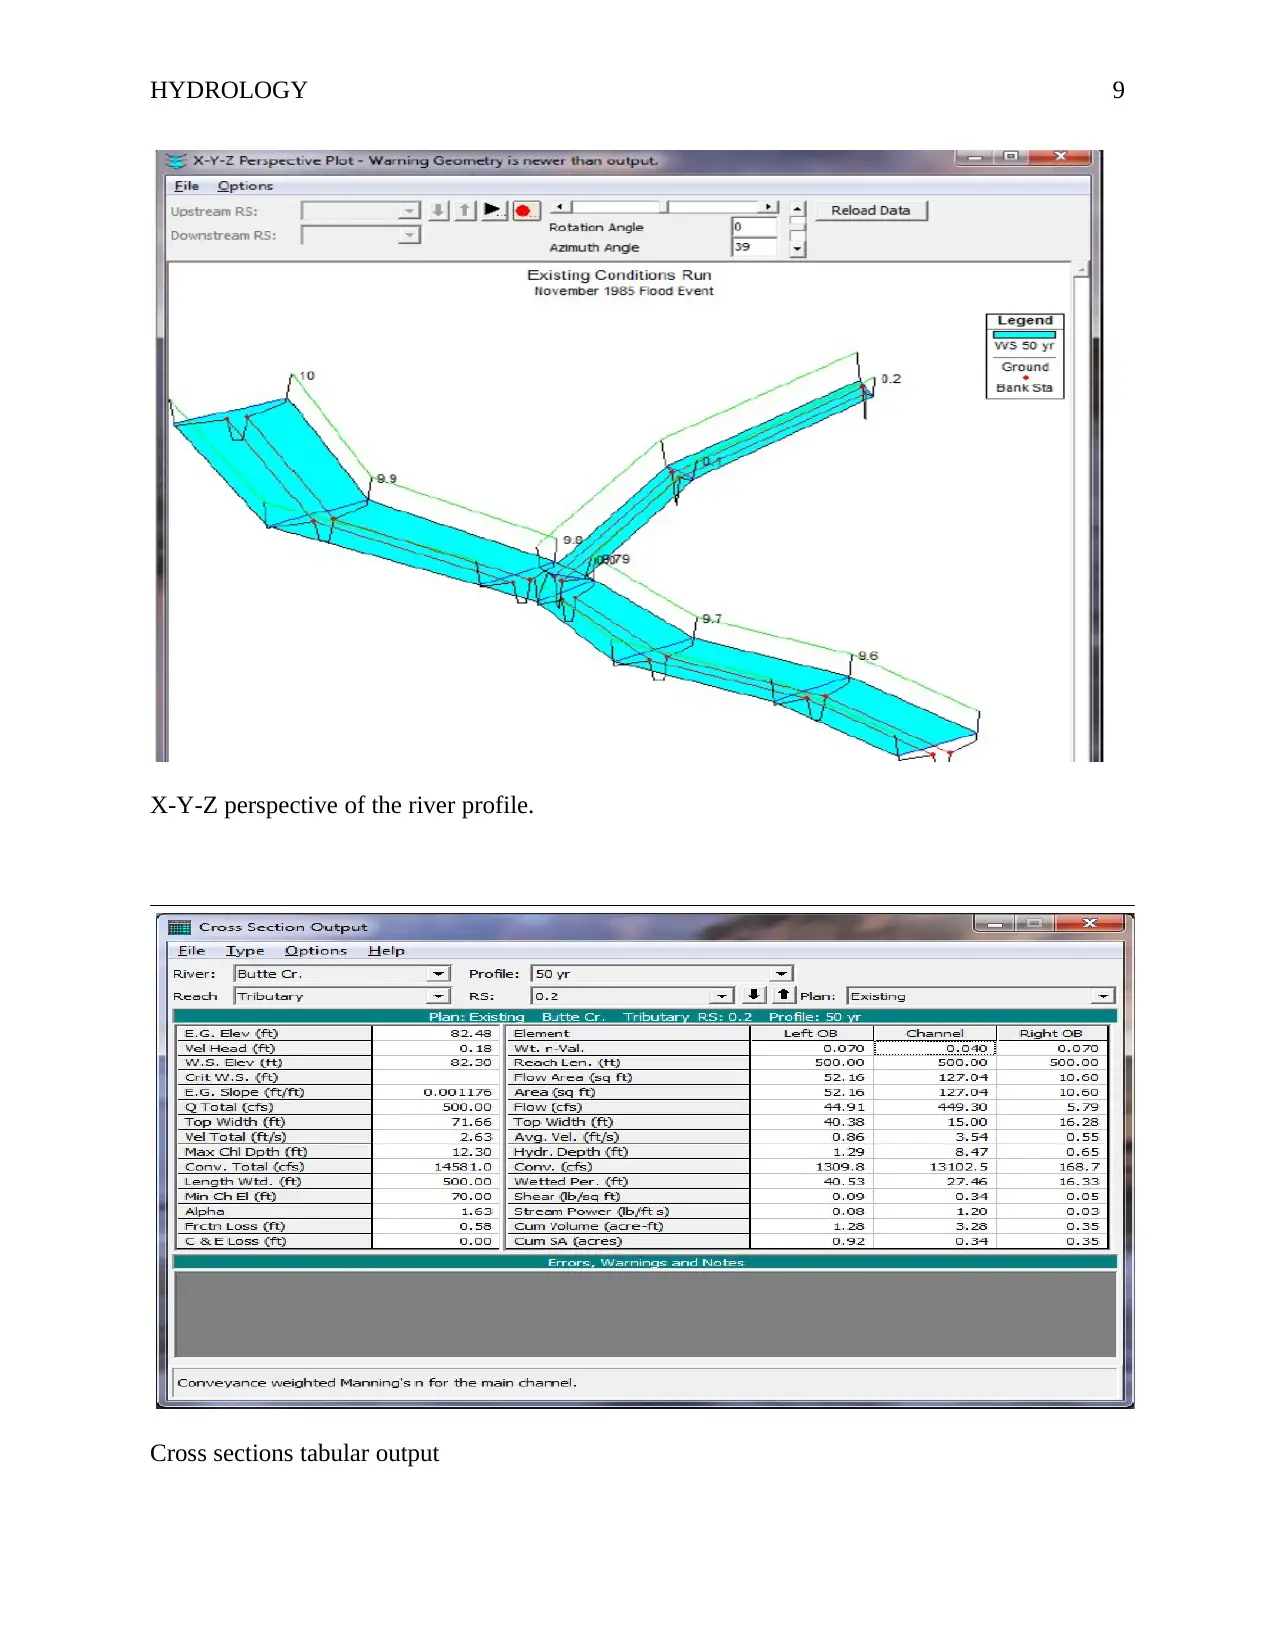
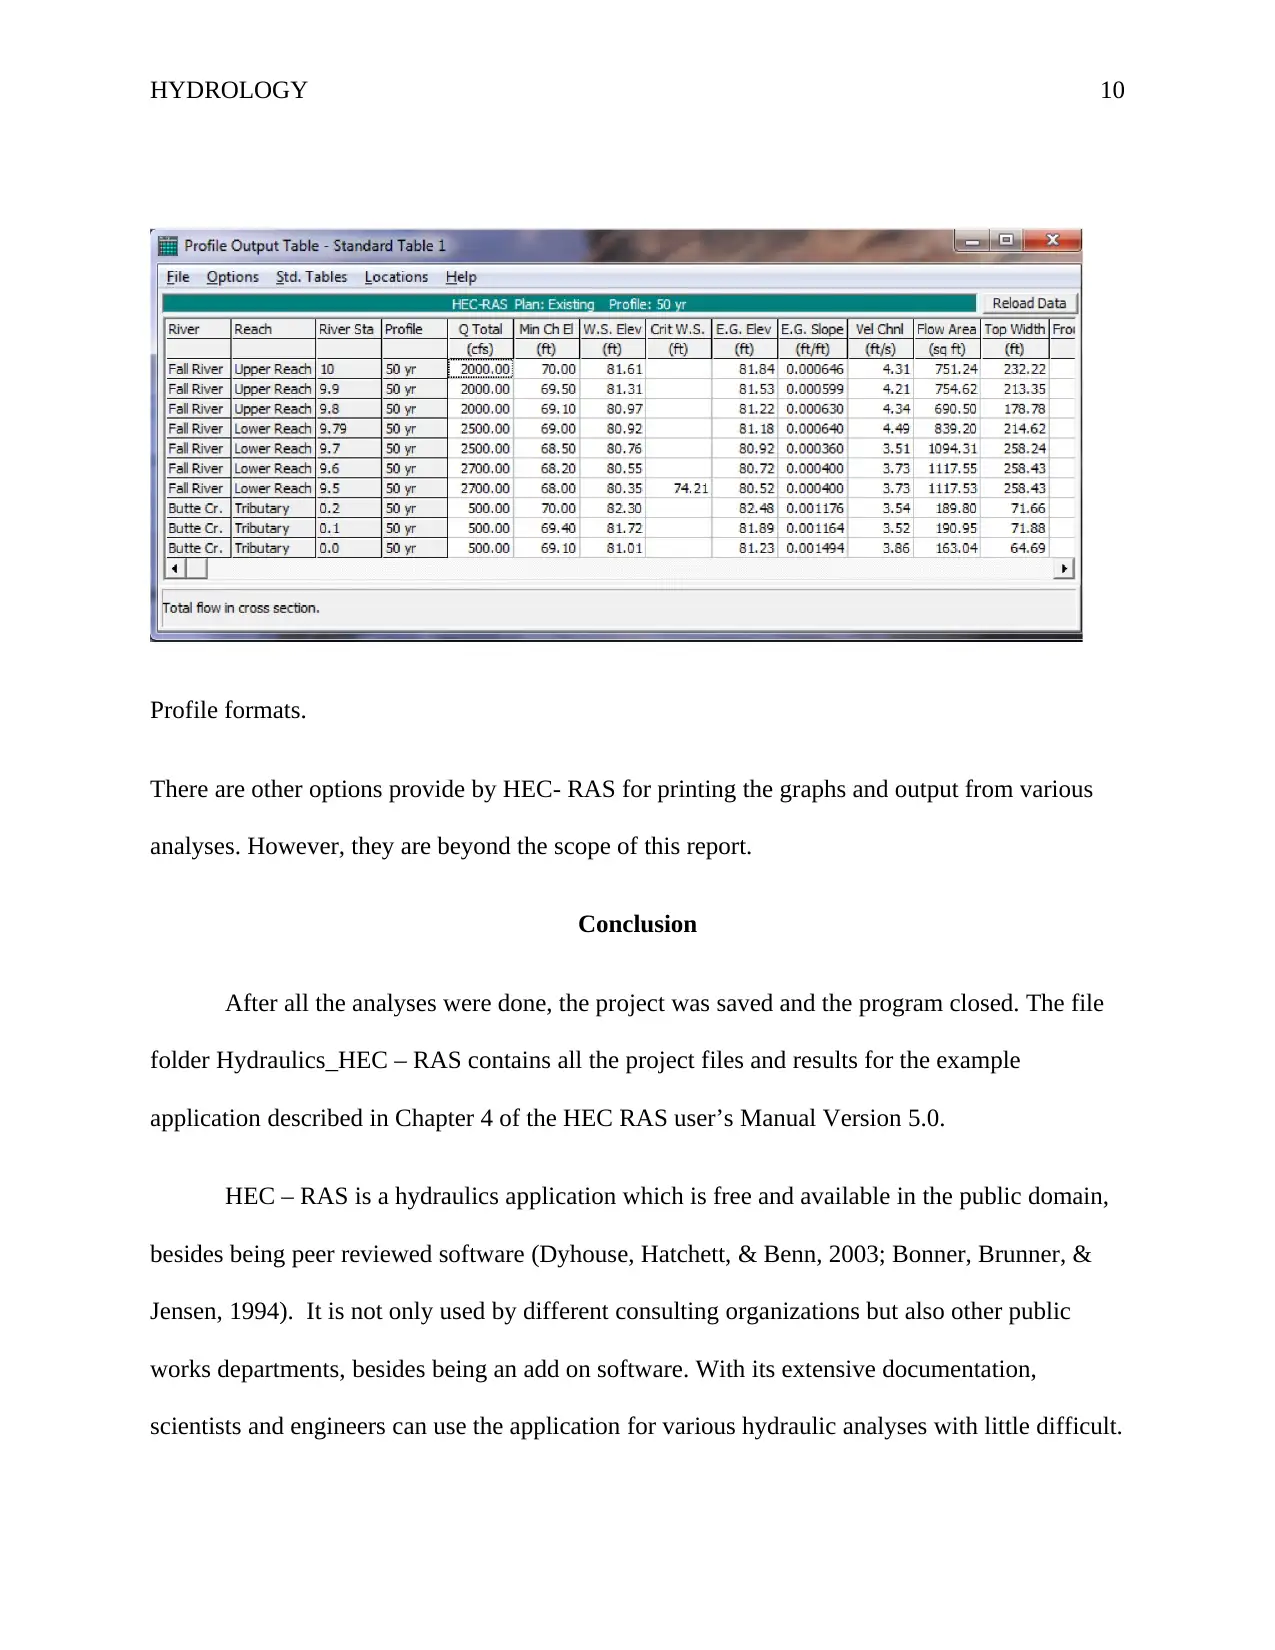
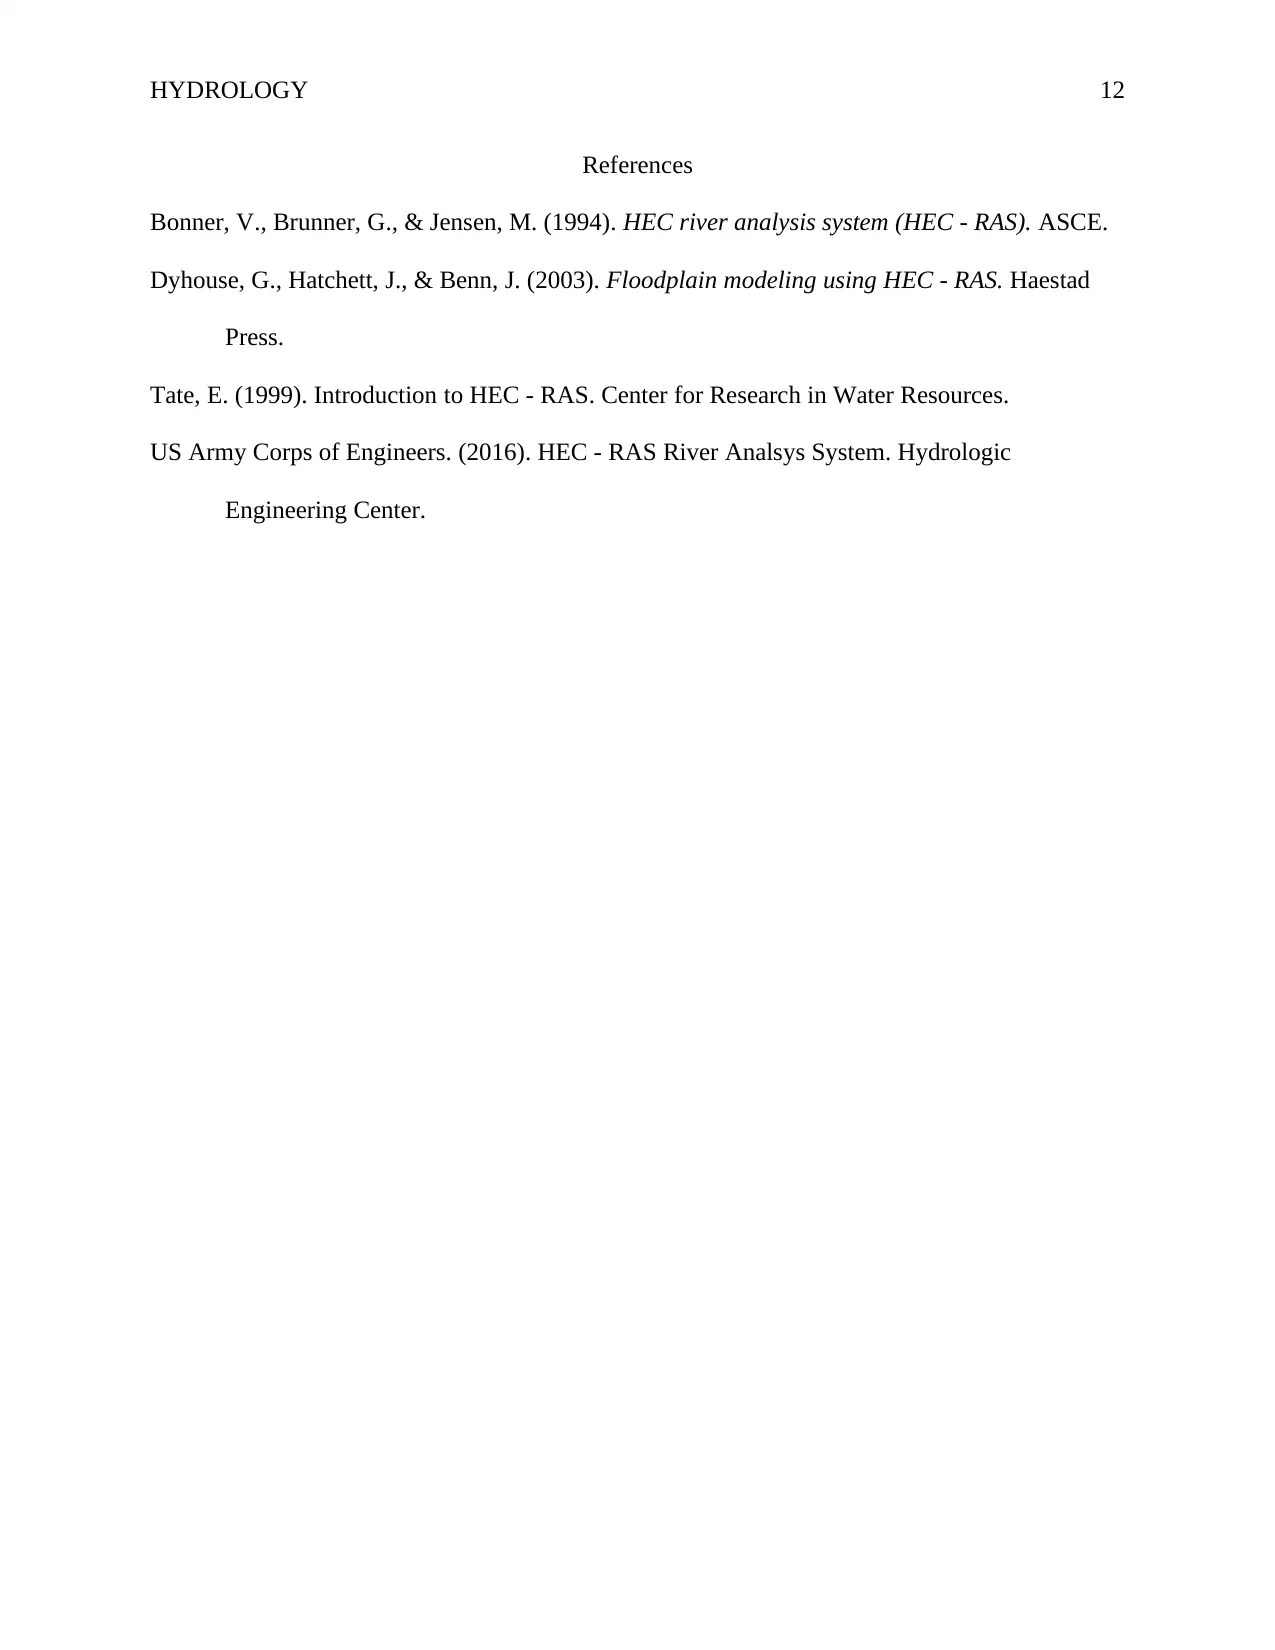
This report presents an application of the HEC-RAS software for hydraulic modeling and analysis, focusing on the example application described in Chapter 4 of the HEC-RAS User’s Manual Version 5.0. The software, developed by the US Army Corps of Engineers, is used for river management and water-related public works. The report details the process of starting a new project, entering geometric and steady flow data, performing hydraulic calculations, and viewing results. Key assumptions made during the project, such as the existence of a two-river hydraulic system with georeferenced river profiles and uniform cross-sections, are outlined. The selection of graphs, based on river profiles and boundary conditions, is discussed, along with the different hydraulic analyses of a river profile were done and results saved in the HEC – RAS files. The report also includes a discussion of steady flow analysis and the generation of various outputs, such as cross-section plots, profile plots, and rating curves. The report concludes by highlighting the utility of HEC-RAS for hydraulic analyses, while noting potential numerical instability issues in unsteady analyses.
tabler-icon-diamond-filled.svg

Contribute Materials

Your contribution can guide someone’s learning journey. Share your documents today.
Document Page
Running head: HYDROLOGY 1
Hydrology
(Report HEC – RAS Example Application)
Name
Institution
tabler-icon-diamond-filled.svg

Secure Best Marks with AI Grader

Need help grading? Try our AI Grader for instant feedback on your assignments.
Document Page
HYDROLOGY 2
Option 2 (20 marks [15 for model results, 5 for summary report])
HEC-RAS: Download a copy of HEC-RAS software (available at
http://www.hec.usace.army.mil/software/hec-ras/) and its user manual (version 5.0).
Complete the example application described in Chapter 4 of the HEC RAS User’s Manual
Version 5.0 (February 2016). Submit all of the appropriate project files and results of your
work for assessment.
Introduction
The HEC-RAS application is a computer based software that is used for hydraulic
modeling and analysis of water flow through rivers and other water channels. The software has
undergone different upgrades to version 5.0. The program was one-dimensional before an
upgrade to version 5.0. As such, there was no direct hydraulic effect modeling of the cross
sections, bends, and other elements of flow that need to be represented in two to three
dimensions. In the done example from the user manual, the version 5.0 has been used that allows
a two dimensional modeling of flow, besides other aspects of flow such as sediment transfer
modeling capabilities. HEC – RAS is software developed by the US Department of Defense,
Army Corps of Engineers for purposes of river management, harbor management, and any other
water related public works that fall under the jurisdiction of the department (US Army Corps of
Engineers, 2016).
The software is integrated and its design is such that it is interactive and allows a
multitasking user interface. The primary features of the software are a graphical user interface
Document Page
HYDROLOGY 3
(GUI), separate analysis components, data storage components, management of data elements
and, graphics and reporting facilities.
The river analysis components in HEC – RAS include: (1) water quality analysis. (2)
unsteady flow simulations (both in one dimensional and two dimensional), (3) steady flow water
surface profile computations and (4) Quasi unsteady or fully unsteady flow movable boundary
sediment transport computations. All the primary elements of the software use the same
geometric data representation and geometric and hydraulic computations routines that are
similar.
In the example done from Chapter four of the user manual, the following are the process
were done: staring a New project, entering geometric data, entering steady flow data, performing
the hydraulic calculations, viewing results, and existing the program.
Summary of the Assumptions Made
After starting a new project, various assumptions were made during project processing
and execution. The example done in the application is an imaginary example, and that no data
was obtained from any field for analysis.
The first assumption made is that the river to be analyzed exists and it is a two river
hydraulic system, i.e. a three hydraulic reaches system as it is depicted in the project files. In
development of this model, the next major assumption made is that the river profile has
georeferences. However, these georeferences are not real, they do not exist. As such, an
imaginary georeferenced background map was selected, or was brought into the application.
Another major assumption made during project execution is the cross sections for the
river system actually exists and the parameters given for the river system are actual parameters.
The cross sections were also assumed to be uniform throughout the river profiles, and because of
Document Page
HYDROLOGY 4
that, they were copied, one to the next. However, different but almost similar parameters were
utilized to create some arbitrary differences for the river profile.
The river system contained three reaches separated by a junction. The junction
separated the upper reach and the lower reach for the Fall River, and also the reach for the Butter
Cr. River (the tributary). The junction data is ideal – a major assumption for computation and
analysis of the river in subject. Junction data for the river was assumed to accurately contain the
precise figures for river description, and the lengths of the reaches across the junction. The
geometry data for the project was saved and the analysis done step by step as from the example
in the user manual.
Selection of Graphs
Before the selection and generation of the various graphs from the software, different
analyses and data entries were done to form the basis for graph generation. Steady flow data was
entered into the software to compute the profiles. Three river profiles were calculated. For the
three profiles, flow data was entered starting the upstream side to the downstream of the river. It
this step of the analysis, another assumption was made – the flow is constant until another flow
value is encountered within the reach. Other follows were added at the river sections within the
reaches.
The graphs generated and selected for the example as shown in the next section of the
report were also defined by the river profile under analysis, boundary conditions. The boundary
conditions serve as the parameters for the establishment of the point where the river starts and
the end of the river system under analysis. The beginning of a river is essential in the analysis
because in helped the application to start making calculations. The selected regime for the river
was a subcritical flow regime. In a subcritical flow regime, analysis boundary conditions are only
tabler-icon-diamond-filled.svg

Secure Best Marks with AI Grader

Need help grading? Try our AI Grader for instant feedback on your assignments.
Document Page
HYDROLOGY 5
required at the downstream end of the river system. For supercritical flow regimes, the boundary
condtions are only set at the upper end of the river. There are cases where the flow is kof a
mixed regime. In such cases, the calculations for the river are done with the coundary conditions
entered both at the upstream end of the river and the downstream end of the river.
Discussion
The example from chapter 4 of the HEC- RAS user manual sets a base of the various
processes, or analyses that can be accomplished by the software. In the example, the different
hydraulic analyses of a river profile were done and results saved in the HEC – RAS files,
contained in a separate folder. The analysis done in the example is a steady flow analysis of a
river. A steady flow analysis is the computation of a river or channel of water which has a
continuous flow of water.
The steady flow analysis done for this example involved an assignment different numbers
of flow profiles as different flow scenarios. The analysis helped to show the stages of the river at
different points in the river and also helps to show the initial ideas of where the channel
converges. In case of unsteady flows, temporal river changes in flow are captures at different
locations and this analysis cannot be replaceable by steady analysis.
HEC- RAS provides an option for computation of different hydraulic calculations
covered under steady flow analysis (Tate, 1999). After data has been entered into the steady flow
analysis platform/window, the compute button is used to do all the necessary calculations and the
results are displayed. The steady flow simulation window displays all the computation done in
the application.
The graphs and tables for the various analyses are displayed in different windows. A
successful computation of the results led to the results for the example project. Using the
Document Page
HYDROLOGY 6
scenario output options, the Cross section plots, profile plots, general profile plots, rating curves,
X-Y-Z perspective plots, detailed tabular outputs, and limited tabular outputs were generated.
The figure below shows the cross section plot for the example application:
The figure below is a plot generated for multiple water surfaces from the HEC – RAS;
Document Page
HYDROLOGY 7
A rating curve generated from the analysis based of the water surface profile is shown in
the diagram below.
tabler-icon-diamond-filled.svg

Paraphrase This Document

Need a fresh take? Get an instant paraphrase of this document with our AI Paraphraser
Document Page
HYDROLOGY 8
The X-Y-Z perspective plot for the river system was done as shown in the screenshot
below. The profile summary table was used to generate the plot. The table displays a limited
number of hydraulic variables for several cross sections.
Document Page
HYDROLOGY 9
X-Y-Z perspective of the river profile.
Cross sections tabular output
Document Page
HYDROLOGY 10
Profile formats.
There are other options provide by HEC- RAS for printing the graphs and output from various
analyses. However, they are beyond the scope of this report.
Conclusion
After all the analyses were done, the project was saved and the program closed. The file
folder Hydraulics_HEC – RAS contains all the project files and results for the example
application described in Chapter 4 of the HEC RAS user’s Manual Version 5.0.
HEC – RAS is a hydraulics application which is free and available in the public domain,
besides being peer reviewed software (Dyhouse, Hatchett, & Benn, 2003; Bonner, Brunner, &
Jensen, 1994). It is not only used by different consulting organizations but also other public
works departments, besides being an add on software. With its extensive documentation,
scientists and engineers can use the application for various hydraulic analyses with little difficult.
tabler-icon-diamond-filled.svg

Secure Best Marks with AI Grader

Need help grading? Try our AI Grader for instant feedback on your assignments.
Document Page
HYDROLOGY 11
It is notable however, in its use, users may find some numerical instability problems especially is
an unsteady analysis is being done e.g in steep and highly dynamic channels.
Document Page
HYDROLOGY 12
References
Bonner, V., Brunner, G., & Jensen, M. (1994). HEC river analysis system (HEC - RAS). ASCE.
Dyhouse, G., Hatchett, J., & Benn, J. (2003). Floodplain modeling using HEC - RAS. Haestad
Press.
Tate, E. (1999). Introduction to HEC - RAS. Center for Research in Water Resources.
US Army Corps of Engineers. (2016). HEC - RAS River Analsys System. Hydrologic
Engineering Center.
chevron_up_icon
1 out of 12
circle_padding
hide_on_mobile
zoom_out_icon
logo.png

Your All-in-One AI-Powered Toolkit for Academic Success.

Available 24*7 on WhatsApp / Email

[object Object]