Heineken's Strategic Management Analysis: A Detailed Report
VerifiedAdded on 2021/06/30
|31
|10247
|215
Project
AI Summary
This project provides a comprehensive strategic management analysis of Heineken N.V., examining its operations within the beer industry, particularly in the context of the Vietnamese market. It begins with an overview of Heineken, including its history, product portfolio, and financial performance. The project then delves into the company's vision and mission statements, followed by an analysis of external factors using the External Factor Evaluation Matrix (EFE Matrix), highlighting opportunities and threats. A competitive analysis, including a Competitive Profile Matrix (CPM), assesses Heineken's position relative to key competitors like AB InBev and ThaiBev. Internal factors are evaluated using the Internal Factor Evaluation Matrix (IFE Matrix). The project utilizes strategic analysis tools such as SWOT, IE, and QSPM matrices to formulate strategic recommendations. Furthermore, the project includes a perceptual map, EPS/EBIT analysis, company evaluation, and projected financial ratios, culminating in an executive summary that synthesizes the key findings and strategic implications. The report concludes with recommendations based on the strategic analysis and the current market scenario.
HO CHI MINH CITY UNIVERSITY OF FOREIGN LANGUAGES -
INFORMATION TECHNOLOGY
DEPARTMENT OF TOURISM AND HOSPITALITY
STRATEGIC MANAGEMENT
Group members:
1. Đàm Lê Quỳnh Giao
INFORMATION TECHNOLOGY
DEPARTMENT OF TOURISM AND HOSPITALITY
STRATEGIC MANAGEMENT
Group members:
1. Đàm Lê Quỳnh Giao
Paraphrase This Document
Need a fresh take? Get an instant paraphrase of this document with our AI Paraphraser

CONTENTS
Introduction ........................................................................................................................ 1
1. Old Vision Statement ................................................................................................... 3
2. Revised Vision Statement ............................................................................................ 3
3. Old Mission Statement ................................................................................................ 3
4. Proposed Mission Statement ....................................................................................... 4
5. External Factor Evaluation Matrix (EFE Matrix, EFEM) ..................................... 4
6. The Competitive ........................................................................................................... 6
6.1. The competitors ...................................................................................................... 6
6.1.1. AB InBev ...................................................................................................... 6
6.1.1. ThaiBev ......................................................................................................... 6
6.2. Competitive Profile Matrix (CPM) ......................................................................... 7
7. Financial statement ...................................................................................................... 8
7.1. Income Statement .................................................................................................... 8
7.2. Balance sheet .......................................................................................................... 8
8. Historical ratios ............................................................................................................ 9
9. Internal Factor Evaluation Matrix (IFE Matrix, IFEM) ...................................... 10
10. Strategy analysis ........................................................................................................ 12
10.1. Strength-Weakness-Opportunities-Threats Matrix (SWOT) ............................ 12
10.2. Internal-External Matrix (IE) ............................................................................ 14
10.2.1. Internal-External Matrix by region ............................................................. 14
10.3. Quantitative Strategic Planning Matrix (QSPM) .............................................. 15
10.4. Strategy conclusion............................................................................................ 20
11. Recommendations ...................................................................................................... 21
12. Perceptual map .......................................................................................................... 22
12.1. Beer industry in Vietnam ................................................................................... 22
Introduction
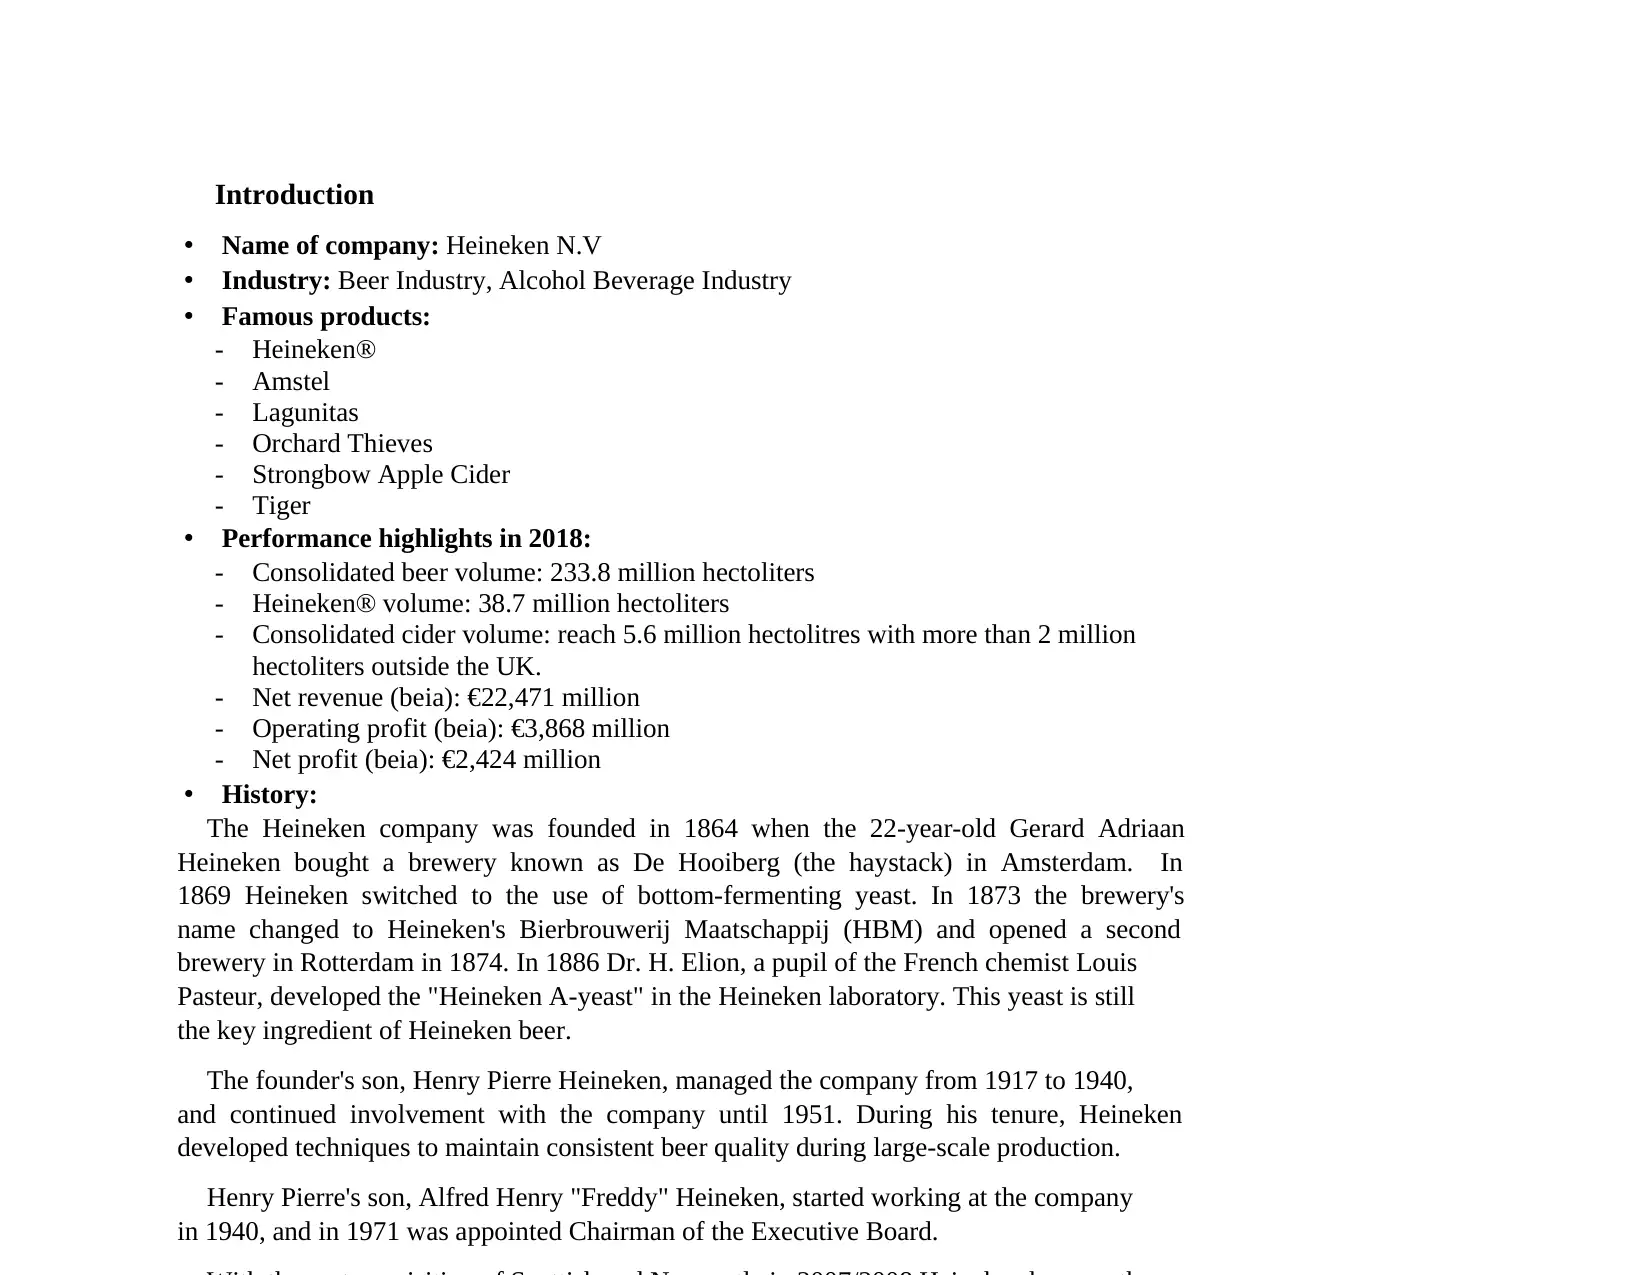
• Name of company: Heineken N.V
• Industry: Beer Industry, Alcohol Beverage Industry
• Famous products:
- Heineken®
- Amstel
- Lagunitas
- Orchard Thieves
- Strongbow Apple Cider
- Tiger
• Performance highlights in 2018:
- Consolidated beer volume: 233.8 million hectoliters
- Heineken® volume: 38.7 million hectoliters
- Consolidated cider volume: reach 5.6 million hectolitres with more than 2 million
hectoliters outside the UK.
- Net revenue (beia): €22,471 million
- Operating profit (beia): €3,868 million
- Net profit (beia): €2,424 million
• History:
The Heineken company was founded in 1864 when the 22-year-old Gerard Adriaan
Heineken bought a brewery known as De Hooiberg (the haystack) in Amsterdam. In
1869 Heineken switched to the use of bottom-fermenting yeast. In 1873 the brewery's
name changed to Heineken's Bierbrouwerij Maatschappij (HBM) and opened a second
brewery in Rotterdam in 1874. In 1886 Dr. H. Elion, a pupil of the French chemist Louis
Pasteur, developed the "Heineken A-yeast" in the Heineken laboratory. This yeast is still
the key ingredient of Heineken beer.
The founder's son, Henry Pierre Heineken, managed the company from 1917 to 1940,
and continued involvement with the company until 1951. During his tenure, Heineken
developed techniques to maintain consistent beer quality during large-scale production.
Henry Pierre's son, Alfred Henry "Freddy" Heineken, started working at the company
in 1940, and in 1971 was appointed Chairman of the Executive Board.
⊘ This is a preview!⊘
Do you want full access?
Subscribe today to unlock all pages.
Trusted by 1+ million students worldwide
In September 2014, it was announced that Heineken would sell its Mexican packaging
business Empaque to Crown for around $1.23 billion. Also during that month, Heineken
revealed it was in talks to sell its Czech operations to Molson Coors.
On 10 September 2015, Heineken International announced it would acquire a 50%
stake in Lagunitas Brewing Company of Petaluma, California as part of an effort to allow
Lagunitas to expand its operations globally. As part of the deal Lagunitas will no longer
be considered a craft brewer as the Heineken stake is greater than 25%.
In January 2017, Heineken announced it was in negotiations to buy the Kirin
Company's 12 breweries in Brazil. The following month, Heineken closed the deal and
bought Brasil Kirin for US$700 million.
After previously acquiring 50% of Lagunitas Brewing Company, Heineken announced,
on 4 May 2017, it would be purchasing the remaining 50%—making it the sole owner of
Lagunitas.
In February 2018, Heineken officially opened their new brewery in Meoqui,
Chihuahua, Mexico. The brewery, their seventh in Mexico, has a production capacity of 6
million hectolitres per year and produces brands such as Tecate, Dos Equis and
Heineken® for the Mexican market as well as for export markets. The Meoqui brewery is
the largest greenfield project in Heineken’s history
In June 2018, Heineken named Maggie Timoney as the CEO of Heineken USA,
making her the first woman to become a CEO of a major United States beer supplier.
In November 2018, Heineken signed definitive agreements with China Resources
Enterprise, Limited (CRE) and China Resources Beer (Holdings) Co. Ltd. (CR Beer) to
create a long-term strategic partnership for Mainland China, Hong Kong and Macau. In
the context of this partnership, Heineken will become CRE’s 40% minority partner in
holding company CRH (Beer) Limited (CBL), which controls CR Beer, the market leader
in China – the world’s largest beer market.
Paraphrase This Document
Need a fresh take? Get an instant paraphrase of this document with our AI Paraphraser
1. Old Vision Statement
“We brew great beers, we build great brands and are committed to surprising and
exciting our consumers everywhere.”
• Leading developer and marketer of premium beer and cider brands. Led by the
Heineken® brand, the Group has a powerful portfolio of more than 300
international, regional, local and specialty beers and ciders.
• Through "Brewing a Better World", sustainability is embedded in the business and
delivers value for all stakeholders.
• The passion of the Heineken family remains as strong today as it was in 1864
when we first started brewing beer.
• https://www.theheinekencompany.com/About-Us/Company-Strategy
2. Revised Vision Statement
We strive to the best global brewer that delivery the value of quality beers, build
award-winning brands and are committed to enthusing consumers everywhere.
3. Old Mission Statement
Heineken provides numerous information on their corporate website on its goals of
sustainability but does not provide a written mission statement.
1. Customer: “human” (at the age from 18 above)
2. Products or services: “premium beer and cider brands”
3. Markets: “every corner of the world”
4. Technology: N/A
5. Concern for survival, growth and profitability: “We are brand builders. The
Heineken® brand defines and unites us while our many local, regional and global
brands make our portfolio diverse and unique.”
6. Philosophy: “Brewing a better world.”
“We stand by our values: passion for quality, enjoyment of life,
respect for people and for the planet.”
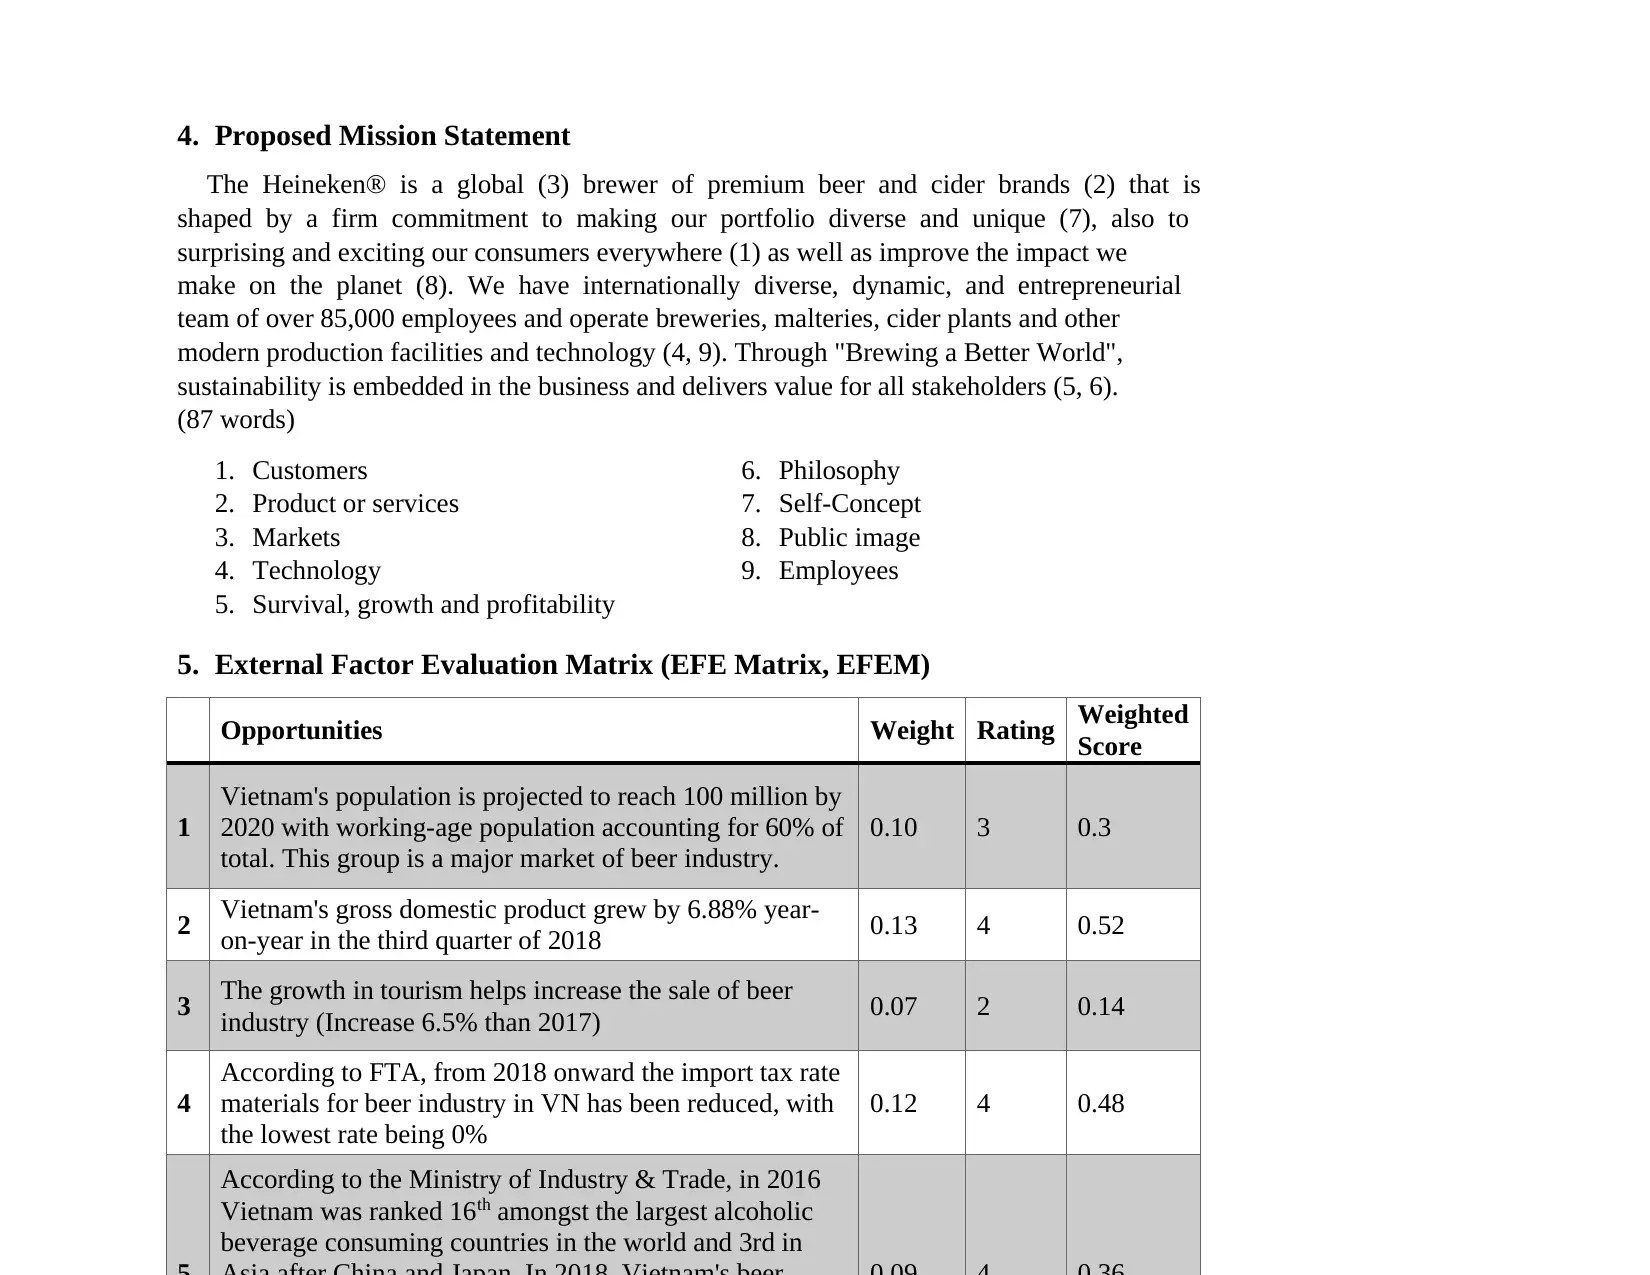
4. Proposed Mission Statement
The Heineken® is a global (3) brewer of premium beer and cider brands (2) that is
shaped by a firm commitment to making our portfolio diverse and unique (7), also to
surprising and exciting our consumers everywhere (1) as well as improve the impact we
make on the planet (8). We have internationally diverse, dynamic, and entrepreneurial
team of over 85,000 employees and operate breweries, malteries, cider plants and other
modern production facilities and technology (4, 9). Through "Brewing a Better World",
sustainability is embedded in the business and delivers value for all stakeholders (5, 6).
(87 words)
1. Customers
2. Product or services
3. Markets
4. Technology
5. Survival, growth and profitability
6. Philosophy
7. Self-Concept
8. Public image
9. Employees
5. External Factor Evaluation Matrix (EFE Matrix, EFEM)
Opportunities Weight Rating Weighted
Score
1
Vietnam's population is projected to reach 100 million by
2020 with working-age population accounting for 60% of
total. This group is a major market of beer industry.
0.10 3 0.3
2 Vietnam's gross domestic product grew by 6.88% year-
on-year in the third quarter of 2018 0.13 4 0.52
3 The growth in tourism helps increase the sale of beer
industry (Increase 6.5% than 2017) 0.07 2 0.14
4
According to FTA, from 2018 onward the import tax rate
materials for beer industry in VN has been reduced, with
the lowest rate being 0%
0.12 4 0.48
According to the Ministry of Industry & Trade, in 2016
Vietnam was ranked 16th amongst the largest alcoholic
beverage consuming countries in the world and 3rd in
⊘ This is a preview!⊘
Do you want full access?
Subscribe today to unlock all pages.
Trusted by 1+ million students worldwide
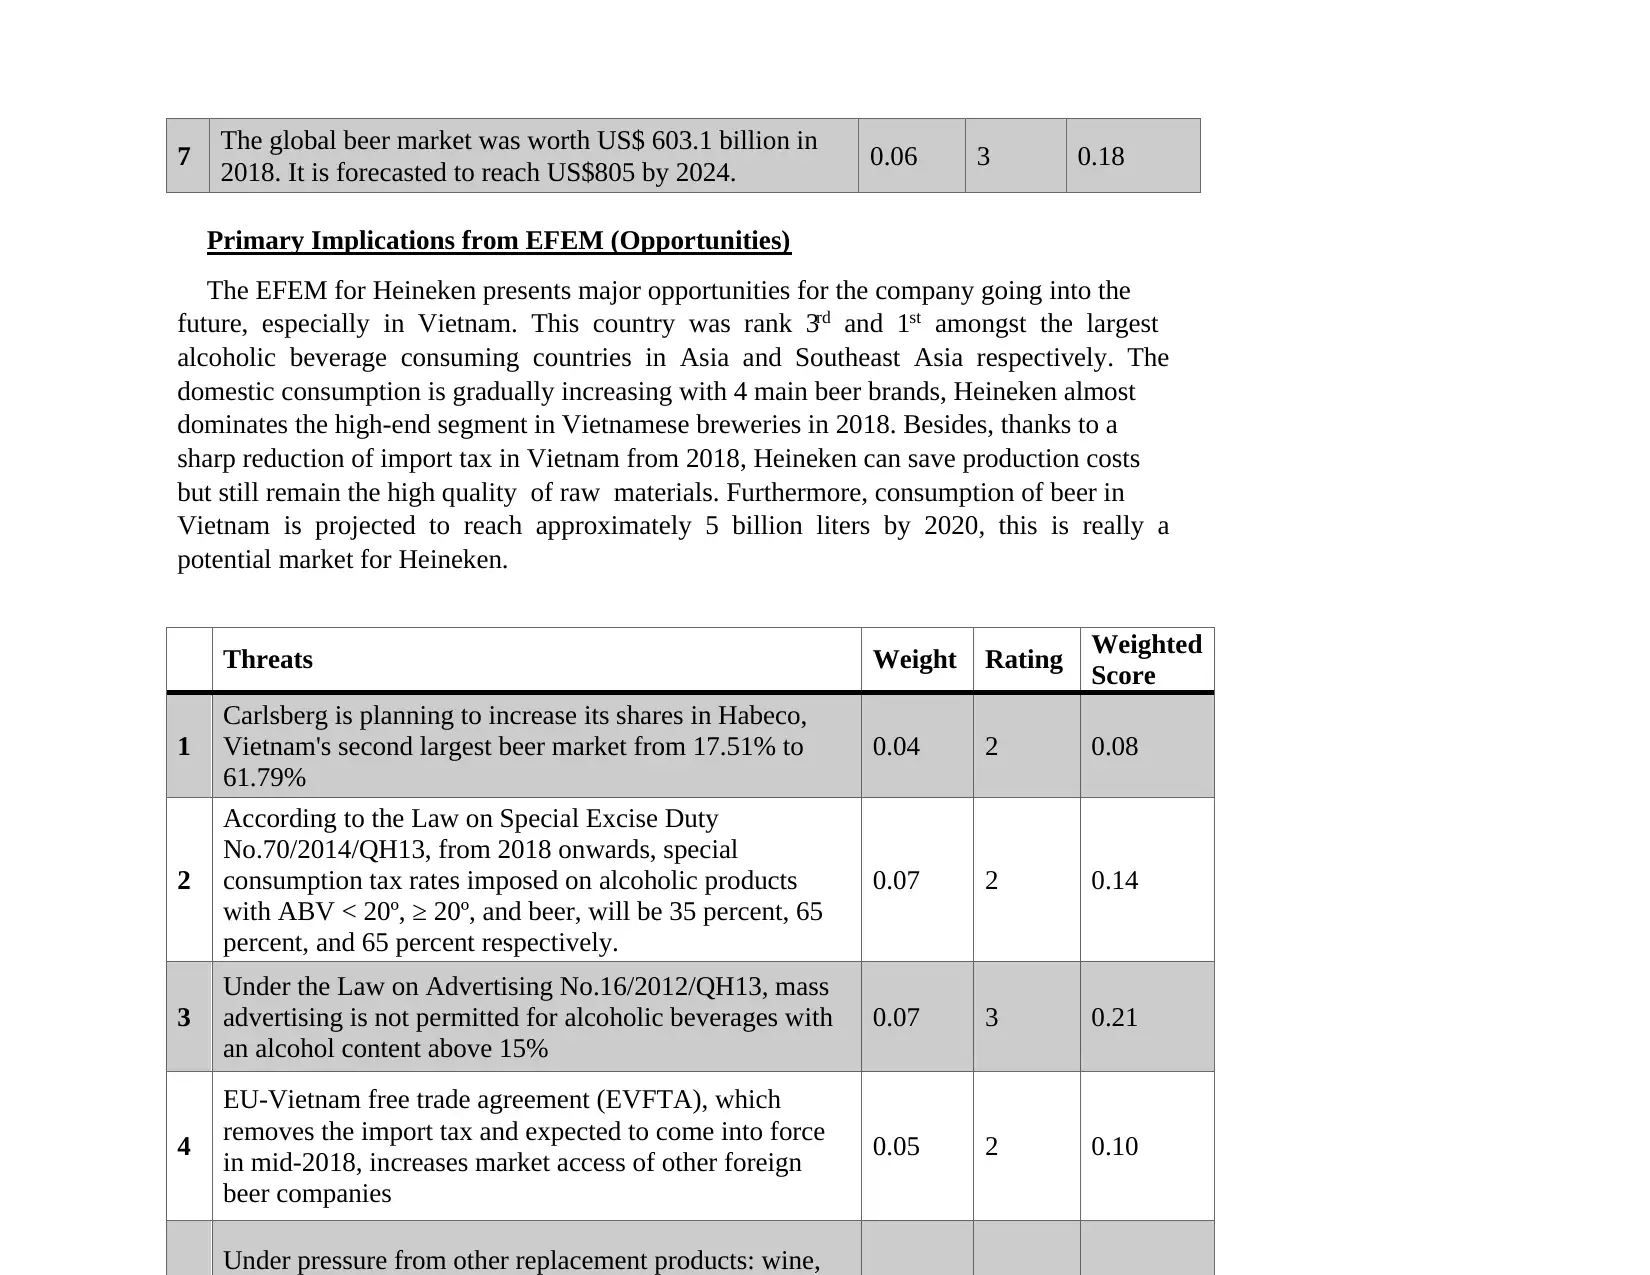
7 The global beer market was worth US$ 603.1 billion in
2018. It is forecasted to reach US$805 by 2024. 0.06 3 0.18
Primary Implications from EFEM (Opportunities)
The EFEM for Heineken presents major opportunities for the company going into the
future, especially in Vietnam. This country was rank 3rd and 1st amongst the largest
alcoholic beverage consuming countries in Asia and Southeast Asia respectively. The
domestic consumption is gradually increasing with 4 main beer brands, Heineken almost
dominates the high-end segment in Vietnamese breweries in 2018. Besides, thanks to a
sharp reduction of import tax in Vietnam from 2018, Heineken can save production costs
but still remain the high quality of raw materials. Furthermore, consumption of beer in
Vietnam is projected to reach approximately 5 billion liters by 2020, this is really a
potential market for Heineken.
Threats Weight Rating Weighted
Score
1
Carlsberg is planning to increase its shares in Habeco,
Vietnam's second largest beer market from 17.51% to
61.79%
0.04 2 0.08
2
According to the Law on Special Excise Duty
No.70/2014/QH13, from 2018 onwards, special
consumption tax rates imposed on alcoholic products
with ABV < 20º, ≥ 20º, and beer, will be 35 percent, 65
percent, and 65 percent respectively.
0.07 2 0.14
3
Under the Law on Advertising No.16/2012/QH13, mass
advertising is not permitted for alcoholic beverages with
an alcohol content above 15%
0.07 3 0.21
4
EU-Vietnam free trade agreement (EVFTA), which
removes the import tax and expected to come into force
in mid-2018, increases market access of other foreign
beer companies
0.05 2 0.10
Under pressure from other replacement products: wine,
Paraphrase This Document
Need a fresh take? Get an instant paraphrase of this document with our AI Paraphraser
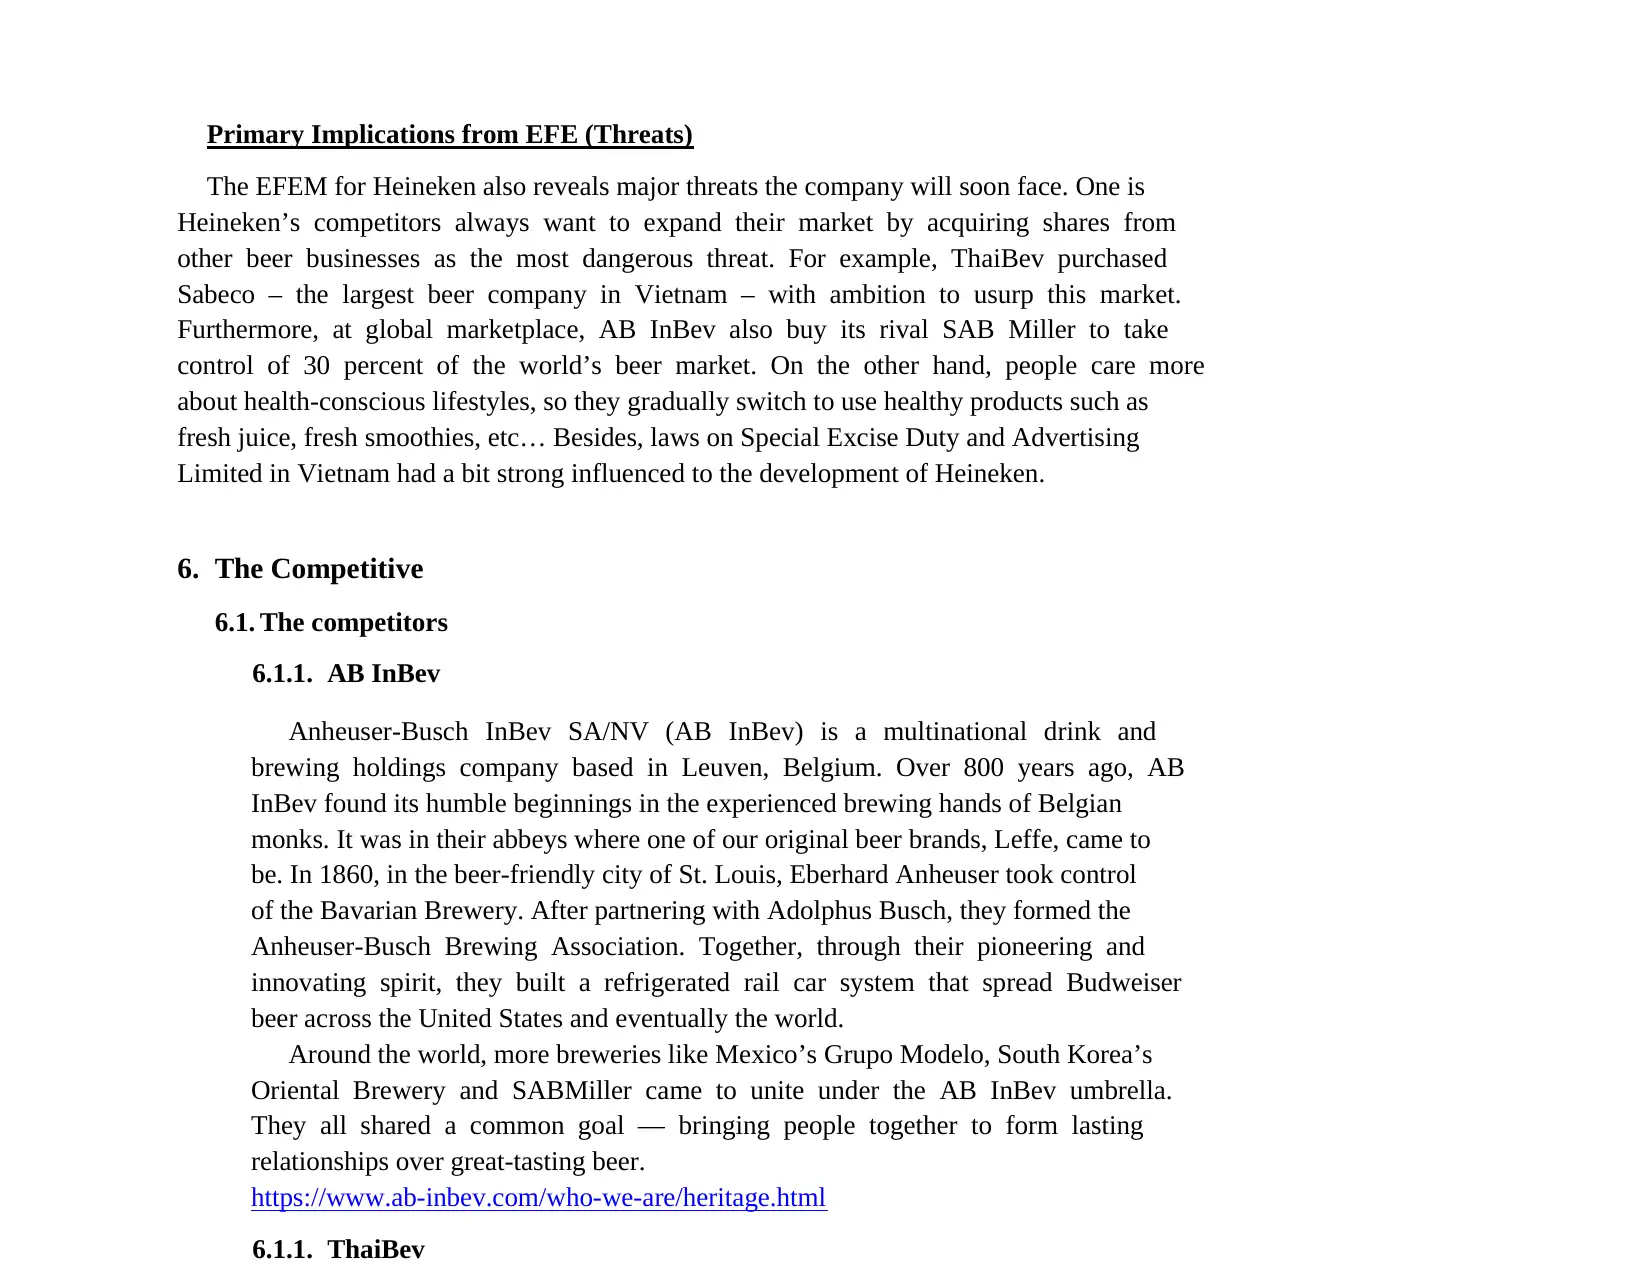
Primary Implications from EFE (Threats)
The EFEM for Heineken also reveals major threats the company will soon face. One is
Heineken’s competitors always want to expand their market by acquiring shares from
other beer businesses as the most dangerous threat. For example, ThaiBev purchased
Sabeco – the largest beer company in Vietnam – with ambition to usurp this market.
Furthermore, at global marketplace, AB InBev also buy its rival SAB Miller to take
control of 30 percent of the world’s beer market. On the other hand, people care more
about health-conscious lifestyles, so they gradually switch to use healthy products such as
fresh juice, fresh smoothies, etc… Besides, laws on Special Excise Duty and Advertising
Limited in Vietnam had a bit strong influenced to the development of Heineken.
6. The Competitive
6.1. The competitors
6.1.1. AB InBev
Anheuser-Busch InBev SA/NV (AB InBev) is a multinational drink and
brewing holdings company based in Leuven, Belgium. Over 800 years ago, AB
InBev found its humble beginnings in the experienced brewing hands of Belgian
monks. It was in their abbeys where one of our original beer brands, Leffe, came to
be. In 1860, in the beer-friendly city of St. Louis, Eberhard Anheuser took control
of the Bavarian Brewery. After partnering with Adolphus Busch, they formed the
Anheuser-Busch Brewing Association. Together, through their pioneering and
innovating spirit, they built a refrigerated rail car system that spread Budweiser
beer across the United States and eventually the world.
Around the world, more breweries like Mexico’s Grupo Modelo, South Korea’s
Oriental Brewery and SABMiller came to unite under the AB InBev umbrella.
They all shared a common goal — bringing people together to form lasting
relationships over great-tasting beer.
https://www.ab-inbev.com/who-we-are/heritage.html
6.1.1. ThaiBev
consumers at all levels. The success of Beer Chang propelled the company to be a
market leader in domestic beer products.
In October 2003, altogether 58 related companies in the production and
marketing of alcoholic beverage group and related businesses merged into the Thai
Beverage Public Company Limited. Today, ThaiBev is not only Thailand's leading
beverage producer, but also one of Asia's largest beverage producers. The business
consists of four segments - spirits, beer, non-alcoholic beverage, and food.
http://www.thaibev.com/about-us
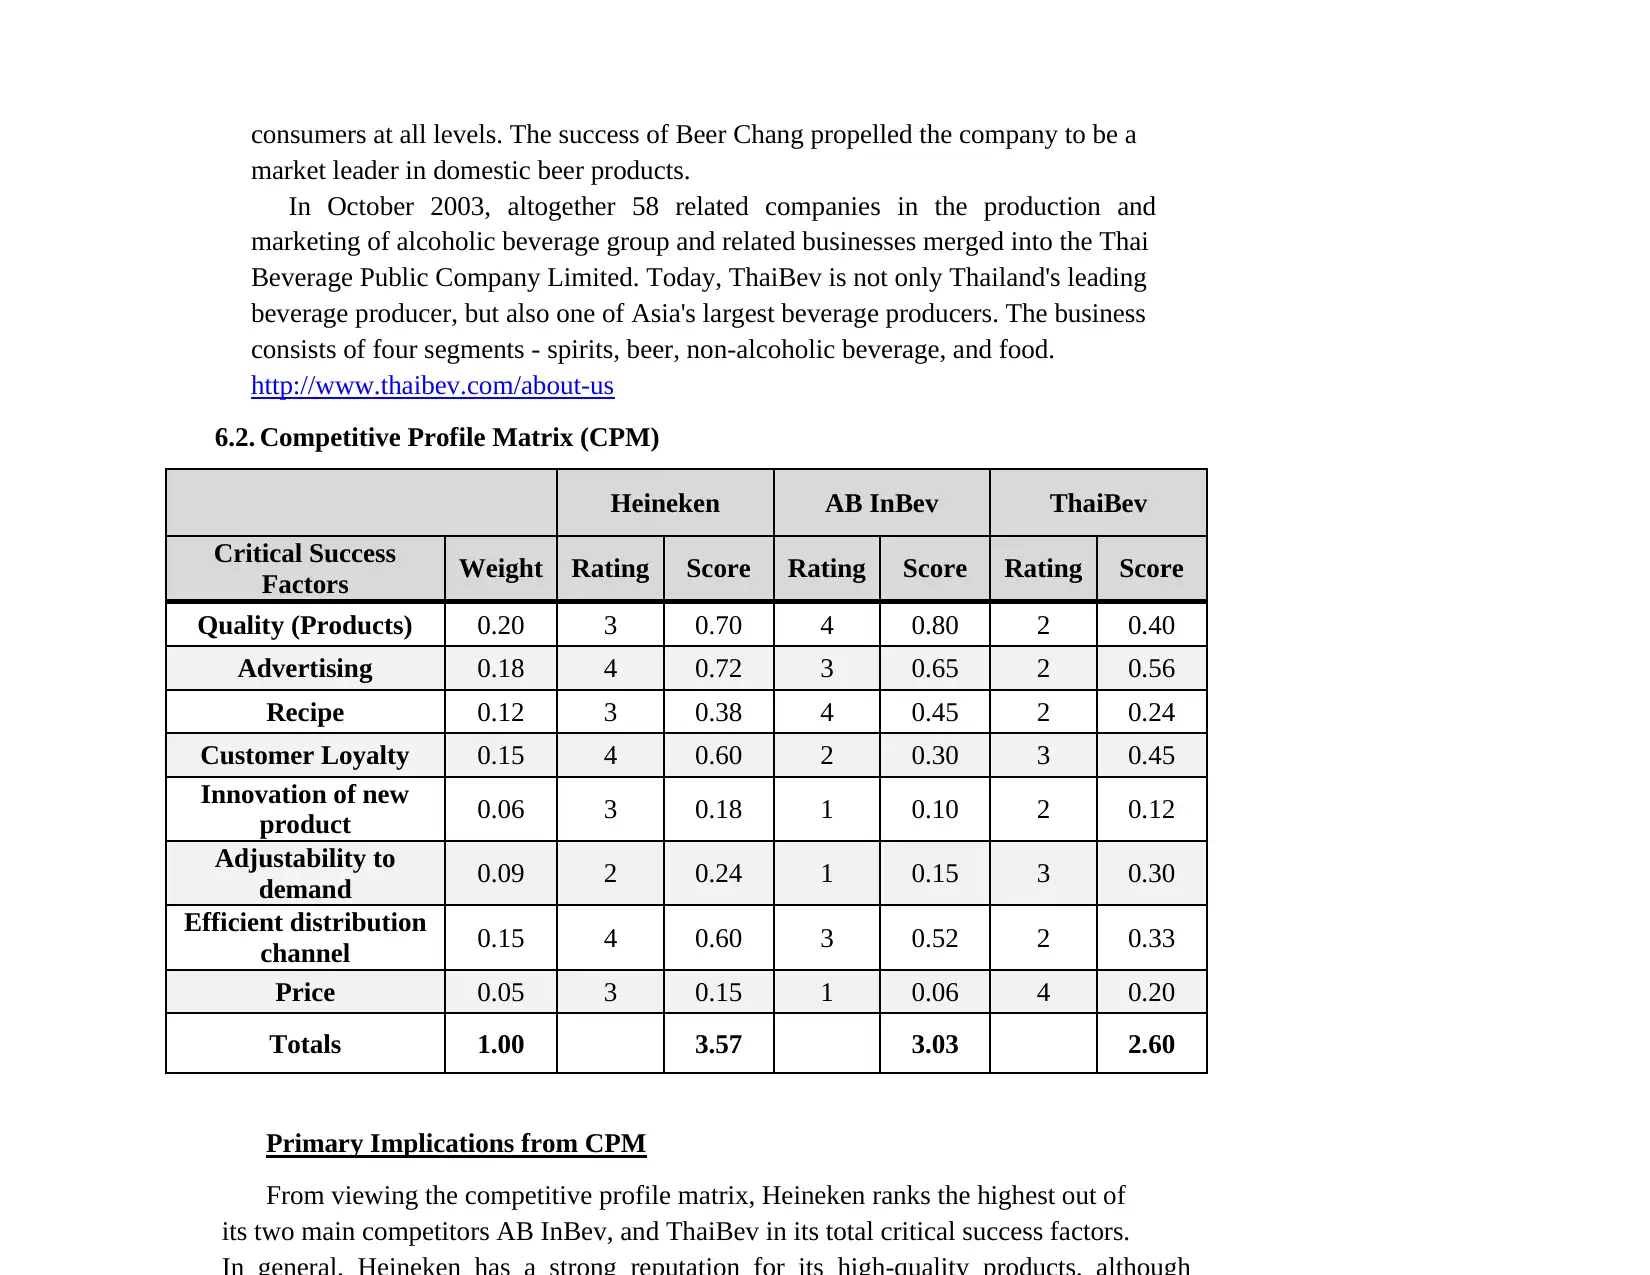
6.2. Competitive Profile Matrix (CPM)
Heineken AB InBev ThaiBev
Critical Success
Factors Weight Rating Score Rating Score Rating Score
Quality (Products) 0.20 3 0.70 4 0.80 2 0.40
Advertising 0.18 4 0.72 3 0.65 2 0.56
Recipe 0.12 3 0.38 4 0.45 2 0.24
Customer Loyalty 0.15 4 0.60 2 0.30 3 0.45
Innovation of new
product 0.06 3 0.18 1 0.10 2 0.12
Adjustability to
demand 0.09 2 0.24 1 0.15 3 0.30
Efficient distribution
channel 0.15 4 0.60 3 0.52 2 0.33
Price 0.05 3 0.15 1 0.06 4 0.20
Totals 1.00 3.57 3.03 2.60
Primary Implications from CPM
From viewing the competitive profile matrix, Heineken ranks the highest out of
its two main competitors AB InBev, and ThaiBev in its total critical success factors.
market leader in domestic beer products.
In October 2003, altogether 58 related companies in the production and
marketing of alcoholic beverage group and related businesses merged into the Thai
Beverage Public Company Limited. Today, ThaiBev is not only Thailand's leading
beverage producer, but also one of Asia's largest beverage producers. The business
consists of four segments - spirits, beer, non-alcoholic beverage, and food.
http://www.thaibev.com/about-us
6.2. Competitive Profile Matrix (CPM)
Heineken AB InBev ThaiBev
Critical Success
Factors Weight Rating Score Rating Score Rating Score
Quality (Products) 0.20 3 0.70 4 0.80 2 0.40
Advertising 0.18 4 0.72 3 0.65 2 0.56
Recipe 0.12 3 0.38 4 0.45 2 0.24
Customer Loyalty 0.15 4 0.60 2 0.30 3 0.45
Innovation of new
product 0.06 3 0.18 1 0.10 2 0.12
Adjustability to
demand 0.09 2 0.24 1 0.15 3 0.30
Efficient distribution
channel 0.15 4 0.60 3 0.52 2 0.33
Price 0.05 3 0.15 1 0.06 4 0.20
Totals 1.00 3.57 3.03 2.60
Primary Implications from CPM
From viewing the competitive profile matrix, Heineken ranks the highest out of
its two main competitors AB InBev, and ThaiBev in its total critical success factors.
⊘ This is a preview!⊘
Do you want full access?
Subscribe today to unlock all pages.
Trusted by 1+ million students worldwide
7. Financial statement
7.1. Income Statement
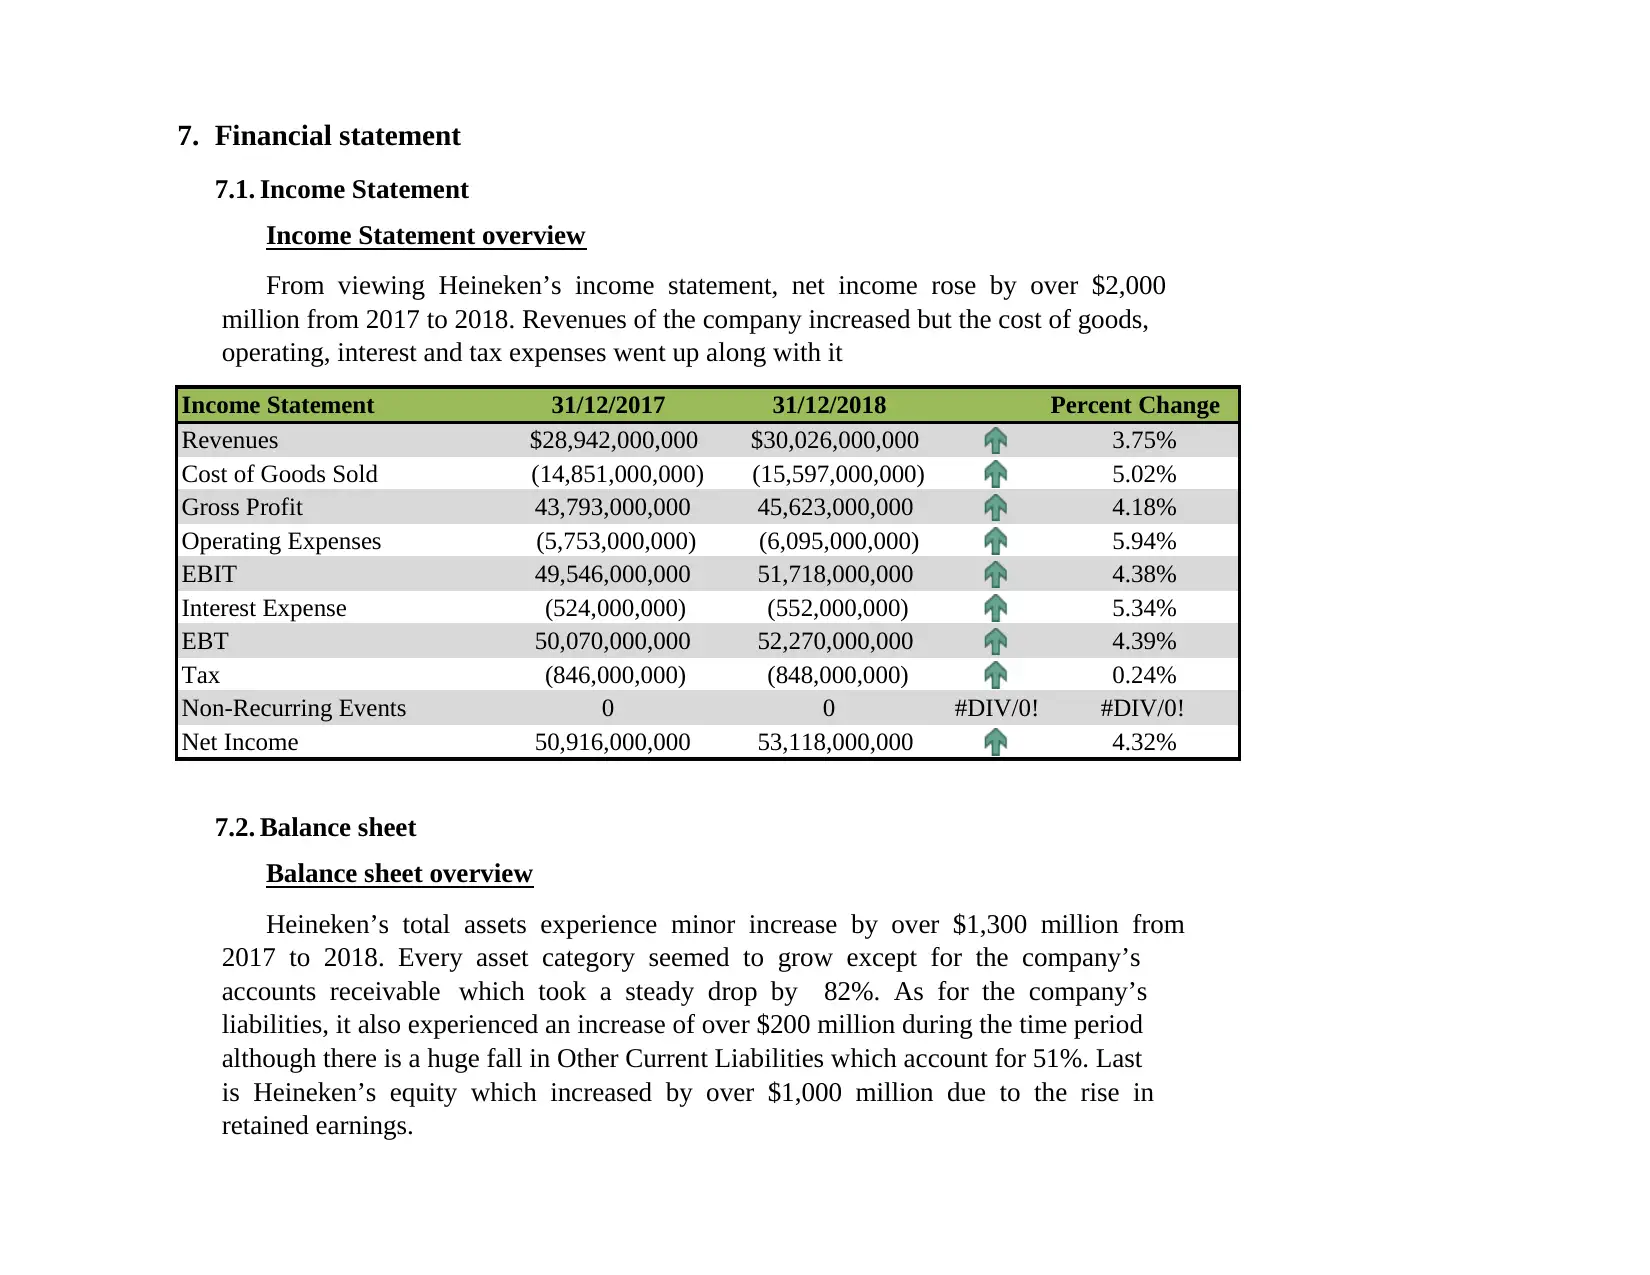
Income Statement overview
From viewing Heineken’s income statement, net income rose by over $2,000
million from 2017 to 2018. Revenues of the company increased but the cost of goods,
operating, interest and tax expenses went up along with it
7.2. Balance sheet
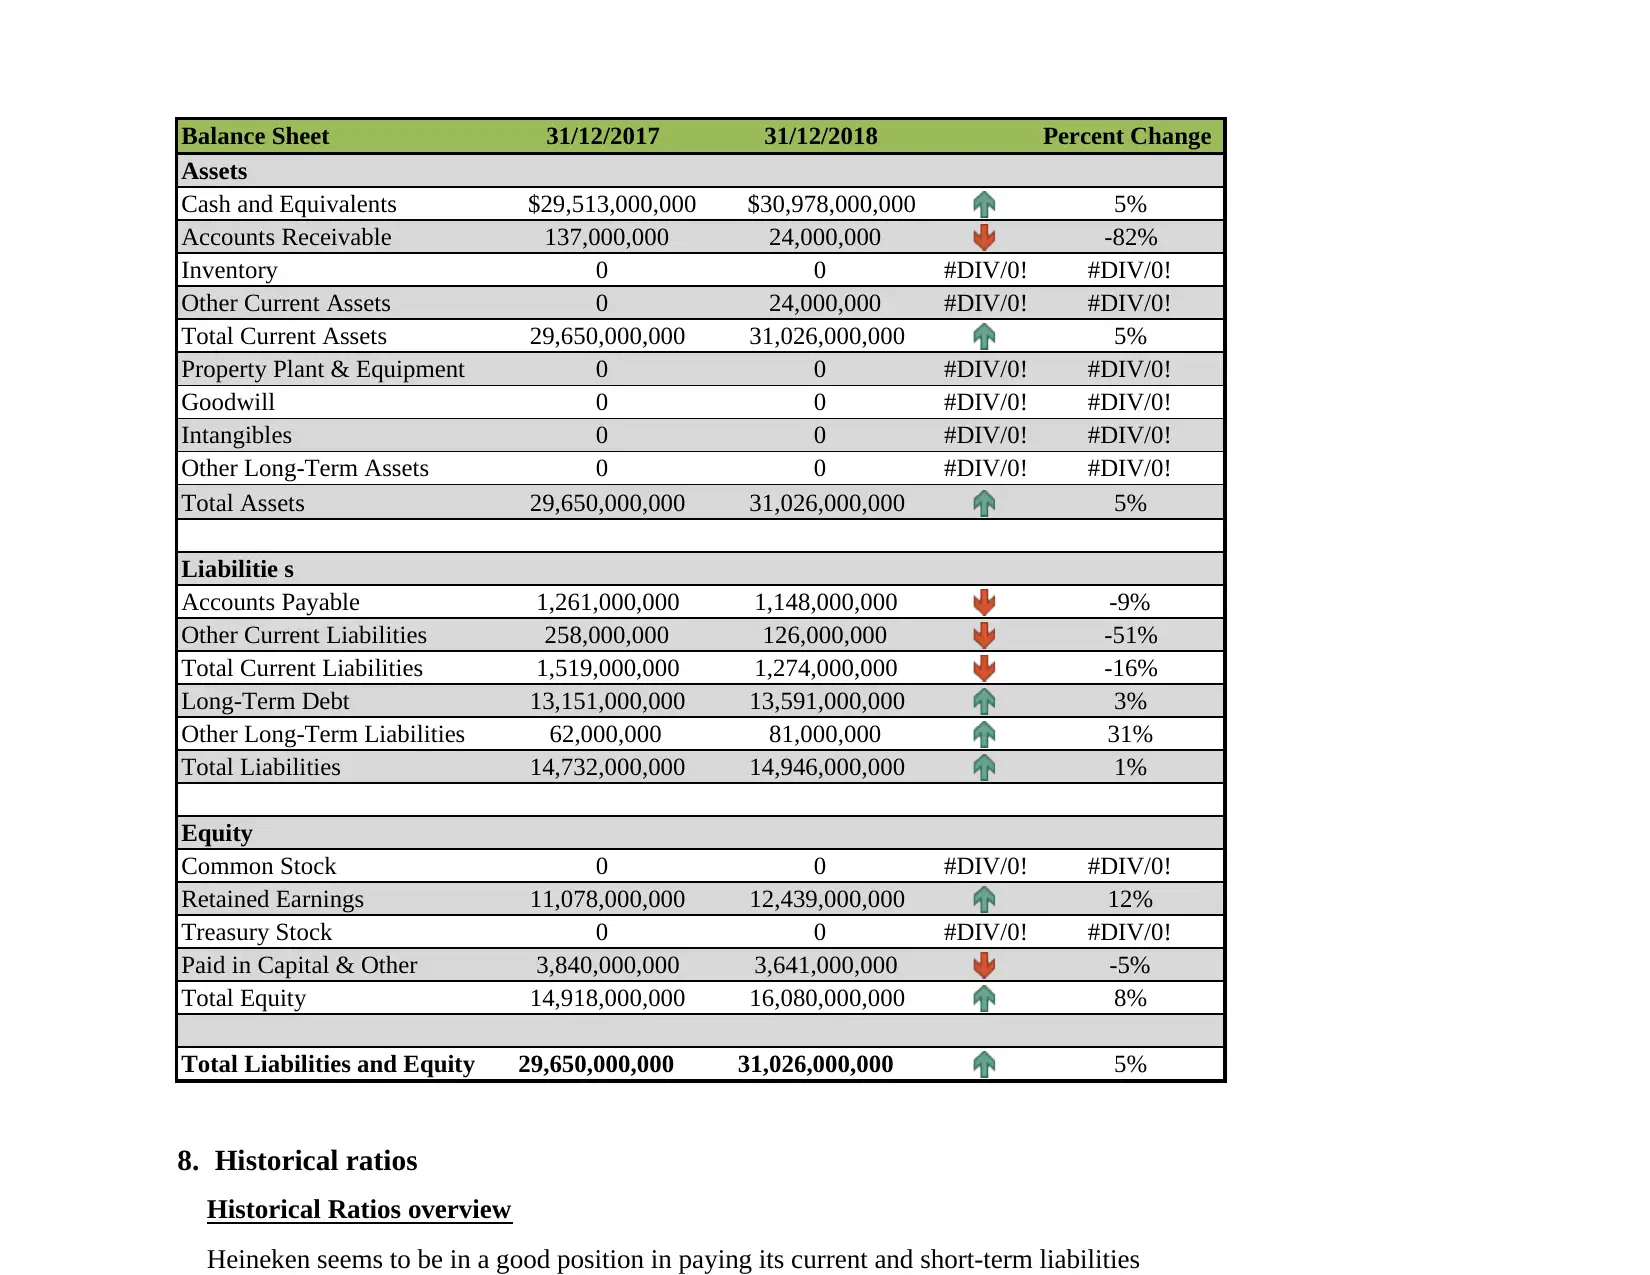
Balance sheet overview
Heineken’s total assets experience minor increase by over $1,300 million from
2017 to 2018. Every asset category seemed to grow except for the company’s
accounts receivable which took a steady drop by 82%. As for the company’s
liabilities, it also experienced an increase of over $200 million during the time period
although there is a huge fall in Other Current Liabilities which account for 51%. Last
is Heineken’s equity which increased by over $1,000 million due to the rise in
retained earnings.
31/12/2017 31/12/2018 Percent Change
$28,942,000,000 $30,026,000,000 3.75%
(14,851,000,000) (15,597,000,000) 5.02%
43,793,000,000 45,623,000,000 4.18%
(5,753,000,000) (6,095,000,000) 5.94%
49,546,000,000 51,718,000,000 4.38%
(524,000,000) (552,000,000) 5.34%
50,070,000,000 52,270,000,000 4.39%
(846,000,000) (848,000,000) 0.24%
0 0 #DIV/0! #DIV/0!
50,916,000,000 53,118,000,000 4.32%
Non-Recurring Events
Net Income
Income Statement
Interest Expense
EBT
Tax
Revenues
Cost of Goods Sold
Gross Profit
Operating Expenses
EBIT
7.1. Income Statement
Income Statement overview
From viewing Heineken’s income statement, net income rose by over $2,000
million from 2017 to 2018. Revenues of the company increased but the cost of goods,
operating, interest and tax expenses went up along with it
7.2. Balance sheet
Balance sheet overview
Heineken’s total assets experience minor increase by over $1,300 million from
2017 to 2018. Every asset category seemed to grow except for the company’s
accounts receivable which took a steady drop by 82%. As for the company’s
liabilities, it also experienced an increase of over $200 million during the time period
although there is a huge fall in Other Current Liabilities which account for 51%. Last
is Heineken’s equity which increased by over $1,000 million due to the rise in
retained earnings.
31/12/2017 31/12/2018 Percent Change
$28,942,000,000 $30,026,000,000 3.75%
(14,851,000,000) (15,597,000,000) 5.02%
43,793,000,000 45,623,000,000 4.18%
(5,753,000,000) (6,095,000,000) 5.94%
49,546,000,000 51,718,000,000 4.38%
(524,000,000) (552,000,000) 5.34%
50,070,000,000 52,270,000,000 4.39%
(846,000,000) (848,000,000) 0.24%
0 0 #DIV/0! #DIV/0!
50,916,000,000 53,118,000,000 4.32%
Non-Recurring Events
Net Income
Income Statement
Interest Expense
EBT
Tax
Revenues
Cost of Goods Sold
Gross Profit
Operating Expenses
EBIT
Paraphrase This Document
Need a fresh take? Get an instant paraphrase of this document with our AI Paraphraser
8. Historical ratios
Historical Ratios overview
Heineken seems to be in a good position in paying its current and short-term liabilities
31/12/2017 31/12/2018 Percent Change
$29,513,000,000 $30,978,000,000 5%
137,000,000 24,000,000 -82%
0 0 #DIV/0! #DIV/0!
0 24,000,000 #DIV/0! #DIV/0!
29,650,000,000 31,026,000,000 5%
0 0 #DIV/0! #DIV/0!
0 0 #DIV/0! #DIV/0!
0 0 #DIV/0! #DIV/0!
0 0 #DIV/0! #DIV/0!
29,650,000,000 31,026,000,000 5%
1,261,000,000 1,148,000,000 -9%
258,000,000 126,000,000 -51%
1,519,000,000 1,274,000,000 -16%
13,151,000,000 13,591,000,000 3%
62,000,000 81,000,000 31%
14,732,000,000 14,946,000,000 1%
0 0 #DIV/0! #DIV/0!
11,078,000,000 12,439,000,000 12%
0 0 #DIV/0! #DIV/0!
3,840,000,000 3,641,000,000 -5%
14,918,000,000 16,080,000,000 8%
29,650,000,000 31,026,000,000 5%
Balance Sheet
Assets
Cash and Equivalents
Accounts Receivable
Total Current Liabilities
Other Current Assets
Total Current Assets
Property Plant & Equipment
Goodwill
Intangibles
Other Long-Term Assets
Total Assets
Liabilitie s
Accounts Payable
Other Current Liabilities
Inventory
Total Liabilities and Equity
Long-Term Debt
Other Long-Term Liabilities
Total Liabilities
Equity
Common Stock
Retained Earnings
Treasury Stock
Paid in Capital & Other
Total Equity
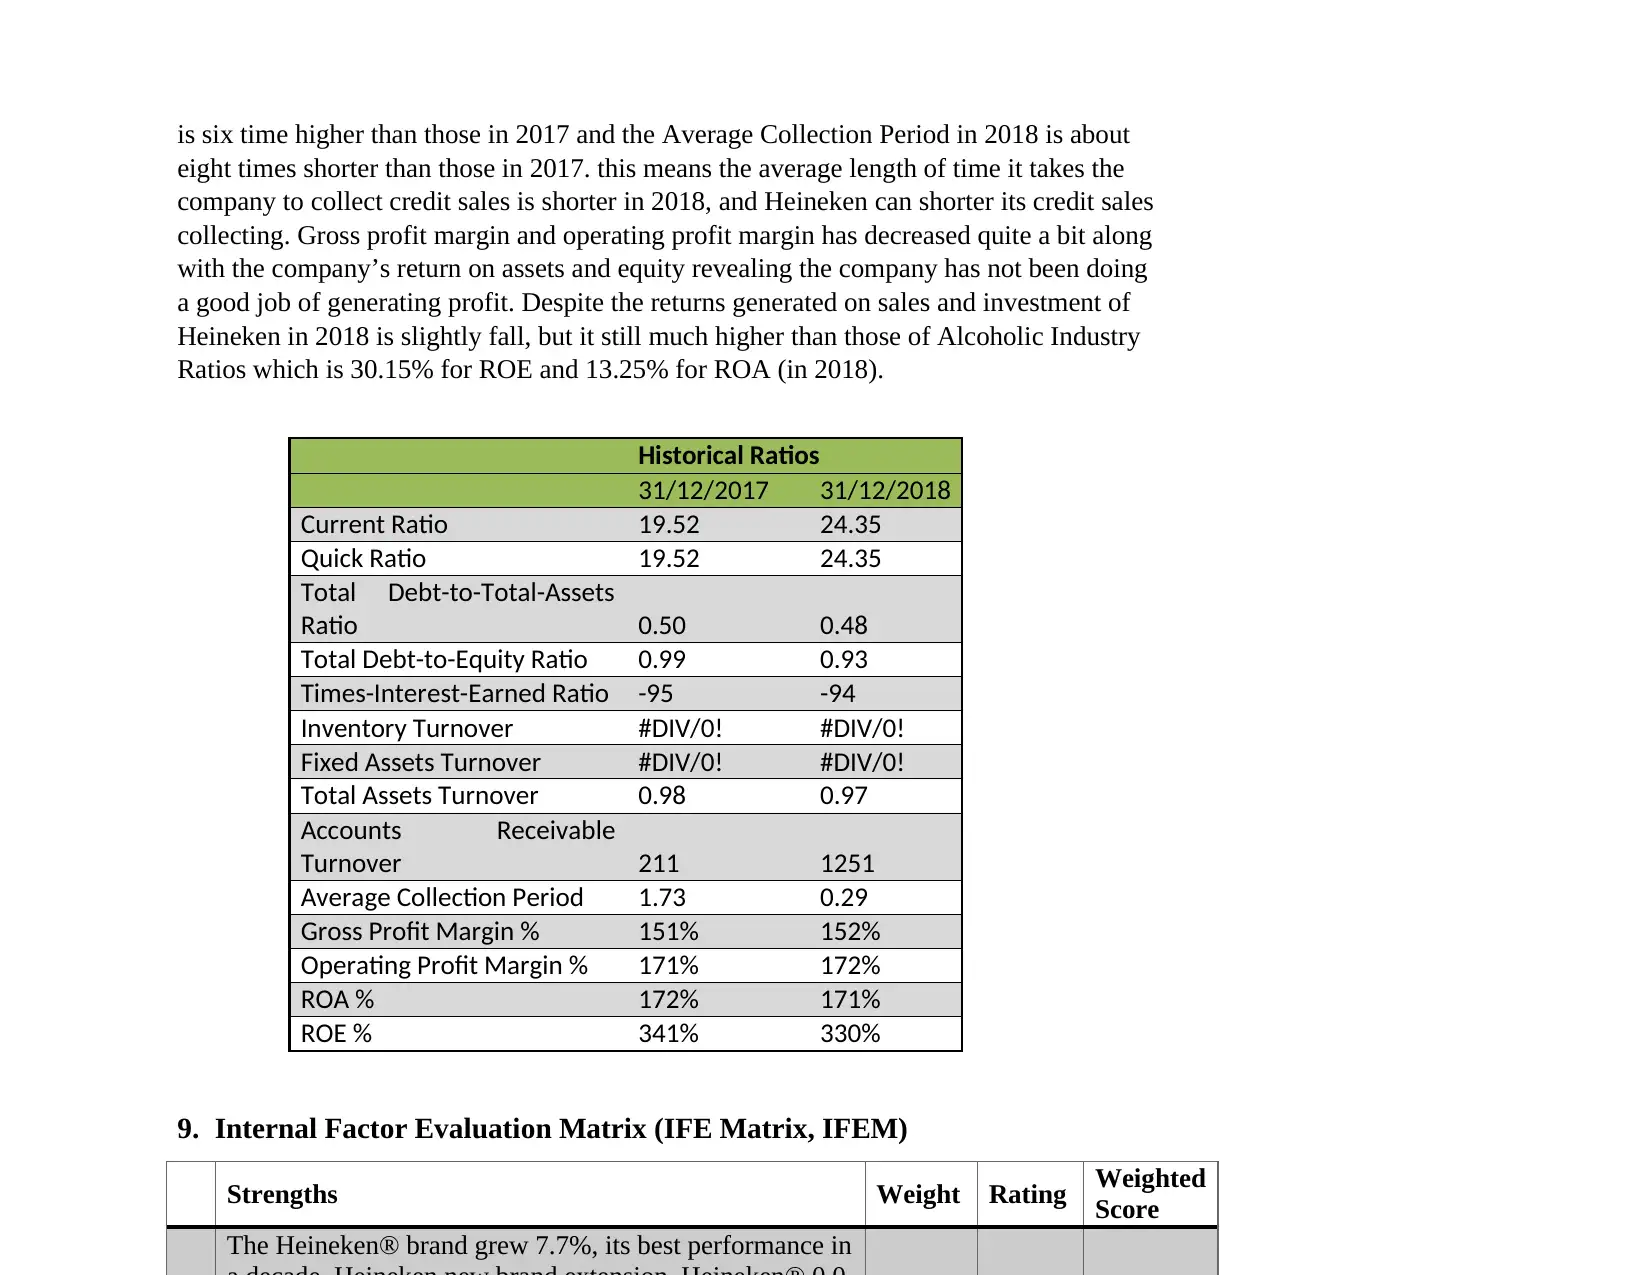
is six time higher than those in 2017 and the Average Collection Period in 2018 is about
eight times shorter than those in 2017. this means the average length of time it takes the
company to collect credit sales is shorter in 2018, and Heineken can shorter its credit sales
collecting. Gross profit margin and operating profit margin has decreased quite a bit along
with the company’s return on assets and equity revealing the company has not been doing
a good job of generating profit. Despite the returns generated on sales and investment of
Heineken in 2018 is slightly fall, but it still much higher than those of Alcoholic Industry
Ratios which is 30.15% for ROE and 13.25% for ROA (in 2018).
Historical Ratios
31/12/2017 31/12/2018
Current Ratio 19.52 24.35
Quick Ratio 19.52 24.35
Total Debt-to-Total-Assets
Ratio 0.50 0.48
Total Debt-to-Equity Ratio 0.99 0.93
Times-Interest-Earned Ratio -95 -94
Inventory Turnover #DIV/0! #DIV/0!
Fixed Assets Turnover #DIV/0! #DIV/0!
Total Assets Turnover 0.98 0.97
Accounts Receivable
Turnover 211 1251
Average Collection Period 1.73 0.29
Gross Profit Margin % 151% 152%
Operating Profit Margin % 171% 172%
ROA % 172% 171%
ROE % 341% 330%
9. Internal Factor Evaluation Matrix (IFE Matrix, IFEM)
Strengths Weight Rating Weighted
Score
The Heineken® brand grew 7.7%, its best performance in
⊘ This is a preview!⊘
Do you want full access?
Subscribe today to unlock all pages.
Trusted by 1+ million students worldwide
1 out of 31
Your All-in-One AI-Powered Toolkit for Academic Success.
+13062052269
info@desklib.com
Available 24*7 on WhatsApp / Email
![[object Object]](/_next/static/media/star-bottom.7253800d.svg)
Unlock your academic potential
Copyright © 2020–2026 A2Z Services. All Rights Reserved. Developed and managed by ZUCOL.