Comparative Financial Analysis Report: Heineken and Farsons
VerifiedAdded on 2023/01/18
|36
|7301
|99
Report
AI Summary
This report conducts a comprehensive financial analysis comparing the performance of Heineken and Farsons, two prominent companies in the beverage industry. The analysis encompasses a detailed examination of their financial statements from 2015 to 2018, utilizing vertical, horizontal, and ratio analysis techniques to assess their financial health. The study evaluates key financial aspects such as profitability, liquidity, solvency, and working capital management. Vertical analysis assesses the proportional relationships within financial statements, while horizontal analysis examines trends over time. Ratio analysis provides insights into the companies' efficiency and solvency. The report also includes an evaluation of cash flow and working capital. The objective is to provide a comparative assessment to aid in decision-making regarding potential suppliers for beer manufacturers. The findings provide valuable insights into the financial strengths and weaknesses of both companies, supporting informed business decisions.
Financial Analysis
Management
&
Enterprise
Management
&
Enterprise
Paraphrase This Document
Need a fresh take? Get an instant paraphrase of this document with our AI Paraphraser
Table of Contents
INTRODUCTION...........................................................................................................................1
Overview of Companies:........................................................................................................1
EVALUATION OF OVERALL FINANCIAL PERFORMANCE AND FINANCIAL
POSITION OF HEINIKEN AND FARSONS................................................................................2
Vertical analysis of the financial statements:.........................................................................2
Ratio analysis of the financial statements:.............................................................................6
EVALUATION OF THE WORKING CAPITAL .........................................................................8
EVALUATION OF THE CASH FLOW.......................................................................................10
CONCLUSION..............................................................................................................................11
REFERENCES..............................................................................................................................12
APPENDIX....................................................................................................................................13
.......................................................................................................................................................24
INTRODUCTION
Financial Analysis and management relates to procedures contributes in evaluation and
detailed assessment of fiscal and operating performance of a corporation take momentous and
reliable business or financial decisions. This system lets investors and shareholders to make
logical decisions related to investment made in securities and shares of a company. The study's
main goal is to provide an explanation about how financial data can be analysed through various
financial elements of company (Blum and Dacorogna, 2014). In this study, financial
recommendations are provided to beer-manufacturer company related to which corporation
either Farsons or Heineken is better, for supply of their beer and other beverage products. In this
study, a horizontal, vertical and ratio analysis is carried out against both firms. A cash flow
evaluation is also carried out in this study along with working capital to offer valid suggestions
for beer manufacturer.
Overview of Companies:
Simonds Farsons Cisk plc:
It is leading food and beverage corporation which is engaged in operations related to
brewing, producing or manufacturing, selling of beers brands and other beverages and soft-
drinks. Company is public limited corporation and company's securities are listed and trading in
Malta's stock and securities exchange. Corporation was formed in year 1928 and has grown
rapidly since then, due to which company has a trustworthy business image and unique brand
value (About Farsons. 2019).
Heineken
Company is beer manufacturer that operates throughout the globe and engaged in
operations like production, brewing, marketing, distribution and sale of beer and ciders.
Company has huge marketing-channel and network due to company's sales are much greater than
its core competitors. Company also launching innovative drinks and beer flavours time-to-time,
having a wider range of beer brands (About Heiniken. 2019).
1
⊘ This is a preview!⊘
Do you want full access?
Subscribe today to unlock all pages.
Trusted by 1+ million students worldwide
EVALUATION OF OVERALL FINANCIAL PERFORMANCE AND
FINANCIAL POSITION OF HEINIKEN AND FARSONS
Vertical analysis of the financial statements:
Vertical analysis is a method of evaluating the financial reports by taking one component
of financial statement as a basic factor (generally total revenue) and then contrasting other
factors with this in order to determine how other factors influence an organization's revenues (El
Kasmioui and Ceulemans, 2012). In given case, vertical analysis has been done with respect to
both corporation's annual financial statements of 4years form year 2015 to year 2018 which are
attached in appendices, based on this data following is analysis of vertical FS of companies, as
follows:
Vertical analysis of Income Statement:
Simonds Farsons Cisk plc:
Sales figures are taken as base for whole analysis. It has been analysed from vertical P&L
of company that while sales of company Farsons is 100 percent then cost of sales are 63.29
percent in year2015, 61.18percent in year 2016, 61.36percent in year-2017 and 61.05percent in
year-2018. The purpose of such a vertical review is to decide whether Farsons Plc is able to pay-
off their distributors promptly to recommend the beer-manufacturer. Above decline in cost of
revenue percent indicates that company's operating effectiveness has been increased over this
period. Company's gross-margin percentages was 38.95 percent in 2018 which was 38.64percent,
38.82percent and 37.97percent respectively in year-2017, 2016 and 2015. While net-profit
margins were 10.13percent, 12.94percent, 13.64percent and 14.74percent continuously in year-
2015, 2016, 2017 and 2018 (Annual Report of Farsons. 2019). Overall trends shows that
company's gross-margin and net-profit margins have been increased over the period 2015 to
2018.
Company Heineken:
Vertical P&L of company Heineken exhibits that cost of sales of company are
47.25percent, 46.61percent, 46.23percent and 48.71percent of aggregate sales amount
respectively in year-2015,2016,2017 and 2018. In year 2018, company's cost of revenue has been
improved which indicate that company's operating efficiency has been decreased. Gross profit
percentages are 52.75percent, 53.39percent, 53.77percent and 51.29percent respectively in year-
2015, 2016,2017 and 2018. Trends gross profit percent shows that also in year 2018 company's
2
Paraphrase This Document
Need a fresh take? Get an instant paraphrase of this document with our AI Paraphraser
gross-margin has been dropped due to increased cost of sales. While Net profit proportion
company was 4.67percent in year 2015 which was dropped to 4.28% with ups and down. In 2016
net-profit was 3.75% while in year 2017 it was reached to 4.46percent. Aggregate changes in NP
percentage shows that company after 2017, corporation's net-profit generation capacity has been
declined (Annual Report of Heiniken. 2019).
Vertical analysis of Balance Sheet:
Simonds Farsons-Cisk plc:
Simonds vertical BS's analysis reflects that company's overall long -term debts and
liabilities level in total assets terms has been reached to 77.16% in year-2018 with a decrease
from 81.42percent in year-2017. On other-side current-assets balances shown increase from
18.58percent in year-2017 to 22.22percent in year-2018 while in 2015-2016 it was 21.48percent
& 20.25percent.
Level of SH's equity funds was around 67.11-percent of assets in year-2015 that was
shifted to 66.87-percent, 67.21-percent and 59.88-percent correspondingly in year-2016,2017
and 2018. Whereas sum of all liabilities was just 20.37-percent in year-2018 that were 32.79-
percent, 32.52-percent and 32.89-percent respectively in year-2015,2016 and 2017 (Annual
Report of Farsons. 2019).
Company Heineken:
Taking total assets amount as baseline, vertical analysis of company's balance sheet
exhibits that aggregate non-current assets including tangible and intangible assets are 84.32
percent, 79.31 percent, 79.90 percent and 78.38 percent during period of year-2015 to year-2018
respectively reflecting a declining trend in figures. Cash and liquid funds of company are 6.92
percent of entire assets in year-2018 which was 5.95 percent, 7.72 percent and 2.23 percent in
year-2017, 2016 and 2015 correspondingly which points out that company's cash funds are
decreased after 2016. On other-hand current assets of corporation are 21.62 percent in year 2018,
20.10percent in year-2017, 20.69percent in year-2016 and 15.68percent in year-2015 indicating
overall improvement in current asset level in company.
Shareholder's equity funds has covered 17.06percent part in company's entire assets in
year-2018v while in year-2017, 2016 and 2015 it was 16.16 percent, 16.78 percent and 17.90
percent respectively. Enterprise's current liabilities level was drooped from 26.44-percent to
3
24.91-percent in period 2016-2018. Further non-current liabilities level has been declined to
58.03% in year-2018 form 59.52percent in year-2015.
Horizontal Analysis of Financial Statements:
Horizontal analysis implies to systematic technique utilized for effective evaluation of
financial information where previous or just recent period is considered as base-line and
thereafter each element and item reported in financial-statements are compared with figures
stated in baseline period (Eng, Lea, and Cai, 2014). Core objective of a horizontal analysis is
assessment of true growth either negative or positive and variance in performance of corporation
based on each item's variance.
Horizontal analysis of Income-statements:
Simonds Farsons Cisk plc:
Company's horizontal income-statement shows that in 2018 increment in revenue was
7.95 percent while this increase in 2017 and 2016 was just 3.53% and 7.59% respectively. It
shows that company's sales generating efficiencies has been grown. Along with increase
company's cost of sales has been increase by almost same percentage of 7.41% in year 2018.
While company's gross-profits are reported an increment of 8.82% in year-2018 which was 10-
percent and 3.03-percent in year-2016 and 2017. Increment in Net-profits was 16.67% in year-
2018 which was 37.50-percent in year-2016 while in year-2017 it was only increased by 9.09-
percent which reflects that net-profitability position of corporation has been enhanced after year-
2017. Entire analysis represents that company's profitability position has been increased.
Company Heineken:
Horizontal analysis of Heinkeken shows that company's turnover has been grown by
2.66% in year 2018 while in year-2016 and 2017 such growth was around 1.37percent and
around 5.27-percent. Company's cost of sales has reported a growth of 0.01percent, 4.40-percent
and 8.18-percent during year-2016, 2017 and 2018. Growth in gross profits has been reached to
negative 2.08 percent in year-2018 while in 2016 and 2017 there was increase of 2.59-percent
and 6.04-percent. Company's net-income figures has shown a negative growth of 1.64 percent
and 18.60-percent in year-2018 and 2016 only a positive growth of 25.42-percent in year-2018.
Overall performance growth in term of profitability of company is not so much good as there are
negative growth in gross as well as net profits' figures.
Horizontal analysis of Balance Sheet:
4
⊘ This is a preview!⊘
Do you want full access?
Subscribe today to unlock all pages.
Trusted by 1+ million students worldwide
Simonds Farsons Cisk plc:
Horizontal BS of Simonds shows that shareholder's equity-funds balance has been
achieved a negative growth of 21.14% in year-2018 while increment in year-2017 and 2016 was
12.84-percent and 9-percent respectively reflecting a overall declining trend. While long-term
debts funds also declined by around 2.86-percent in year-2018 that was increased by 20.69-
percent in year-2017 and declined by 3.33% in year-2016. Current or short-run liabilities of
company has been grown by 33.33-percent in year-2018 and 2016 but in 2017 there was no
fluctuation.
Level of current assets has been achieved a 5.88-percent in year-2018, that growth in
2017 and 2016 was 3.03-percent and 3.13-percent, indicating a upward trend in current-assets'
level. Non-current assets reported negative growth of 77.16-percent in year-2018 while
increment in non-current assets in year-2016 and 2017 was 10.26-percent and 15.50-percent.
Cash balance of company has been attained 300% growth in year-2018 while there as negative
growth in cash-funds of 60 and 50 percent in year-2016 and 2017. Overall assets of Simonds
declined by around 11.48-percent in year-2018 while there was increase of 12.27-percent and
9.4percent in year-2016 and 2017.
Company Heineken:
Analyzing Horizontal BS of Heiniken provides that company's equity funds raised by
7.91-percent in year 2018 while changes in equity funds were -2.25 % and 0.53 % respectively in
year-2016 and 2017. Long-term debt funds just grown by around 1.69-percent during year-2018
that was reported increments of -0.54 percent and 7.24percent in year-2016 and 2017. Current
liabilities level in company has reported minor negative growth of 0.08-percent that was
enhanced by around 0.59-percent and 22.09-percent in year-2017 and 2016.
Cumulative cash and equivalent figures has been grown by around 268.33-percent in
year-2016 that was declined in year-2017 by 19.54-percent and ultimately increased by 18.88-
percent in year-2017. Current assets in company achieved a growth of 37.59-percent, 1.36-
percent and 9.97-percent correspondingly in year-2016, 2017 and 2018. On other-side non-
current ( both tangible and tangle) assets are shown a minor growth of around 0.31-percent in
year-2018, this growth rate in year-2017 was 5.14% and 1.94% in year-2016.
5
Paraphrase This Document
Need a fresh take? Get an instant paraphrase of this document with our AI Paraphraser
Ratio analysis of the financial statements:
Ratio analysis is way to gain insight into the corporation's operating efficiency and
solvency. This helps in decision-making process so that the interested parties and prospective
customers can make a quantified financial decision. Even in this case, ratio analysis technique is
important as vertical analysis performed above represents company's efficiency outputs and
horizontal analysis suggests the performance effectiveness factors of both selected corporation
(Isberg and Pitta, 2013). In this situation, ratio analysis is conducted to examine both firms'
liquidity, profit making efficiency and solvency, so that a systematic decision can be made that
could support the beer's future potential suppliers.
Profitability Analysis: It simply reflects corporation's profitability making capacities. Through
gross-margin ratio and net-profit ratio of companies their profitability position can be easily
determined (Palepu and Healy, 2013). Following are the ratios of both respective corporation in
this context, as follows:
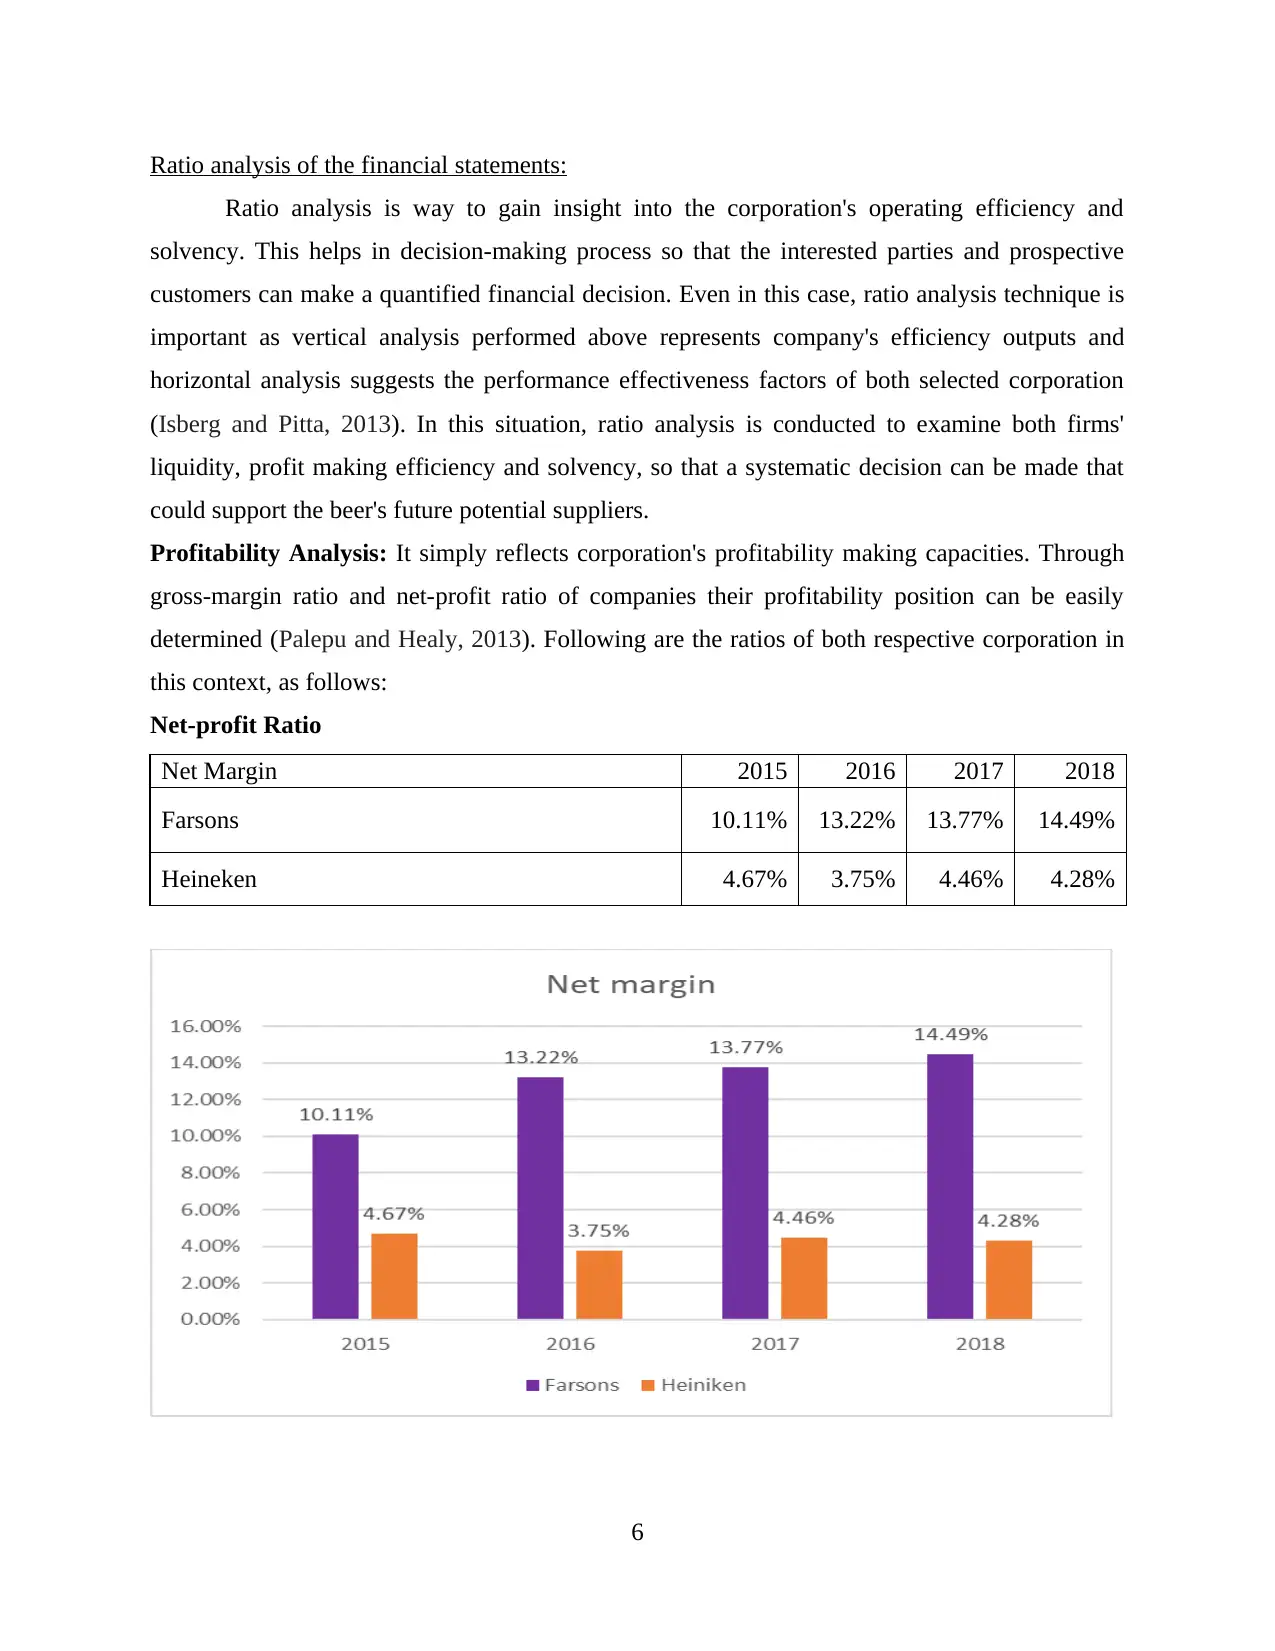
Net-profit Ratio
Net Margin 2015 2016 2017 2018
Farsons 10.11% 13.22% 13.77% 14.49%
Heineken 4.67% 3.75% 4.46% 4.28%
6
Ratio analysis is way to gain insight into the corporation's operating efficiency and
solvency. This helps in decision-making process so that the interested parties and prospective
customers can make a quantified financial decision. Even in this case, ratio analysis technique is
important as vertical analysis performed above represents company's efficiency outputs and
horizontal analysis suggests the performance effectiveness factors of both selected corporation
(Isberg and Pitta, 2013). In this situation, ratio analysis is conducted to examine both firms'
liquidity, profit making efficiency and solvency, so that a systematic decision can be made that
could support the beer's future potential suppliers.
Profitability Analysis: It simply reflects corporation's profitability making capacities. Through
gross-margin ratio and net-profit ratio of companies their profitability position can be easily
determined (Palepu and Healy, 2013). Following are the ratios of both respective corporation in
this context, as follows:
Net-profit Ratio
Net Margin 2015 2016 2017 2018
Farsons 10.11% 13.22% 13.77% 14.49%
Heineken 4.67% 3.75% 4.46% 4.28%
6
Net profit ratio is crucial profitability measure that represents enterprise's profit earning
capacity after providing overall expenses. Company Farsons reported net-profit ratio in percent
are 14.49, 13.77, 13.22 and 10.11 in year-2018,2017,2016 and 2015 reflecting a upward trend.
While Heiniken's net-profit ratio percent during the same years are 4.28, 4.46, 3.75 and 4.67
respectively which shows that in 2016 and 2018 net-profit rate has been dropped. It means that
company's net profitability level has been decreased. Farsons's profitability level and growth is
higher than Heineken.
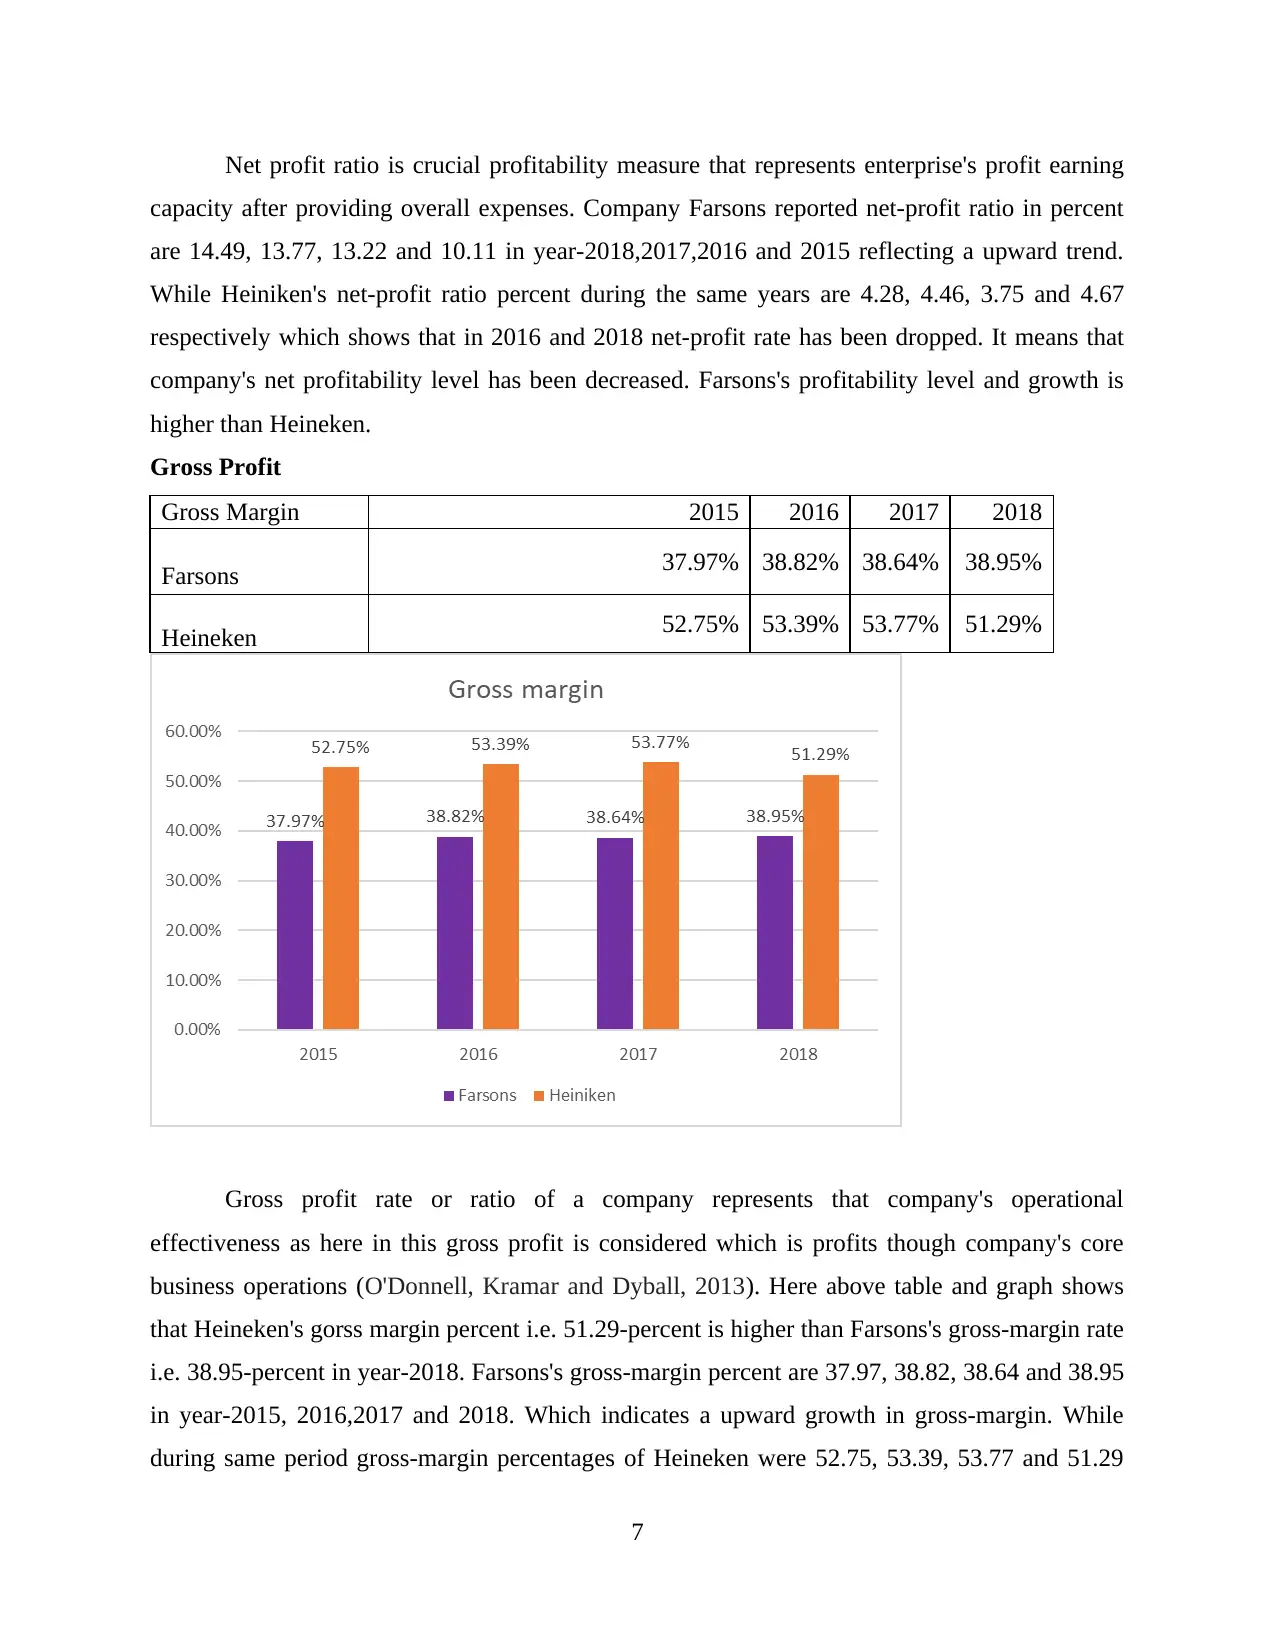
Gross Profit
Gross Margin 2015 2016 2017 2018
Farsons 37.97% 38.82% 38.64% 38.95%
Heineken 52.75% 53.39% 53.77% 51.29%
Gross profit rate or ratio of a company represents that company's operational
effectiveness as here in this gross profit is considered which is profits though company's core
business operations (O'Donnell, Kramar and Dyball, 2013). Here above table and graph shows
that Heineken's gorss margin percent i.e. 51.29-percent is higher than Farsons's gross-margin rate
i.e. 38.95-percent in year-2018. Farsons's gross-margin percent are 37.97, 38.82, 38.64 and 38.95
in year-2015, 2016,2017 and 2018. Which indicates a upward growth in gross-margin. While
during same period gross-margin percentages of Heineken were 52.75, 53.39, 53.77 and 51.29
7
capacity after providing overall expenses. Company Farsons reported net-profit ratio in percent
are 14.49, 13.77, 13.22 and 10.11 in year-2018,2017,2016 and 2015 reflecting a upward trend.
While Heiniken's net-profit ratio percent during the same years are 4.28, 4.46, 3.75 and 4.67
respectively which shows that in 2016 and 2018 net-profit rate has been dropped. It means that
company's net profitability level has been decreased. Farsons's profitability level and growth is
higher than Heineken.
Gross Profit
Gross Margin 2015 2016 2017 2018
Farsons 37.97% 38.82% 38.64% 38.95%
Heineken 52.75% 53.39% 53.77% 51.29%
Gross profit rate or ratio of a company represents that company's operational
effectiveness as here in this gross profit is considered which is profits though company's core
business operations (O'Donnell, Kramar and Dyball, 2013). Here above table and graph shows
that Heineken's gorss margin percent i.e. 51.29-percent is higher than Farsons's gross-margin rate
i.e. 38.95-percent in year-2018. Farsons's gross-margin percent are 37.97, 38.82, 38.64 and 38.95
in year-2015, 2016,2017 and 2018. Which indicates a upward growth in gross-margin. While
during same period gross-margin percentages of Heineken were 52.75, 53.39, 53.77 and 51.29
7
⊘ This is a preview!⊘
Do you want full access?
Subscribe today to unlock all pages.
Trusted by 1+ million students worldwide
that shows decrement in gross-margin rate in year 2018. It implies that company's efficiencies to
generate profits form core operations has been declined.
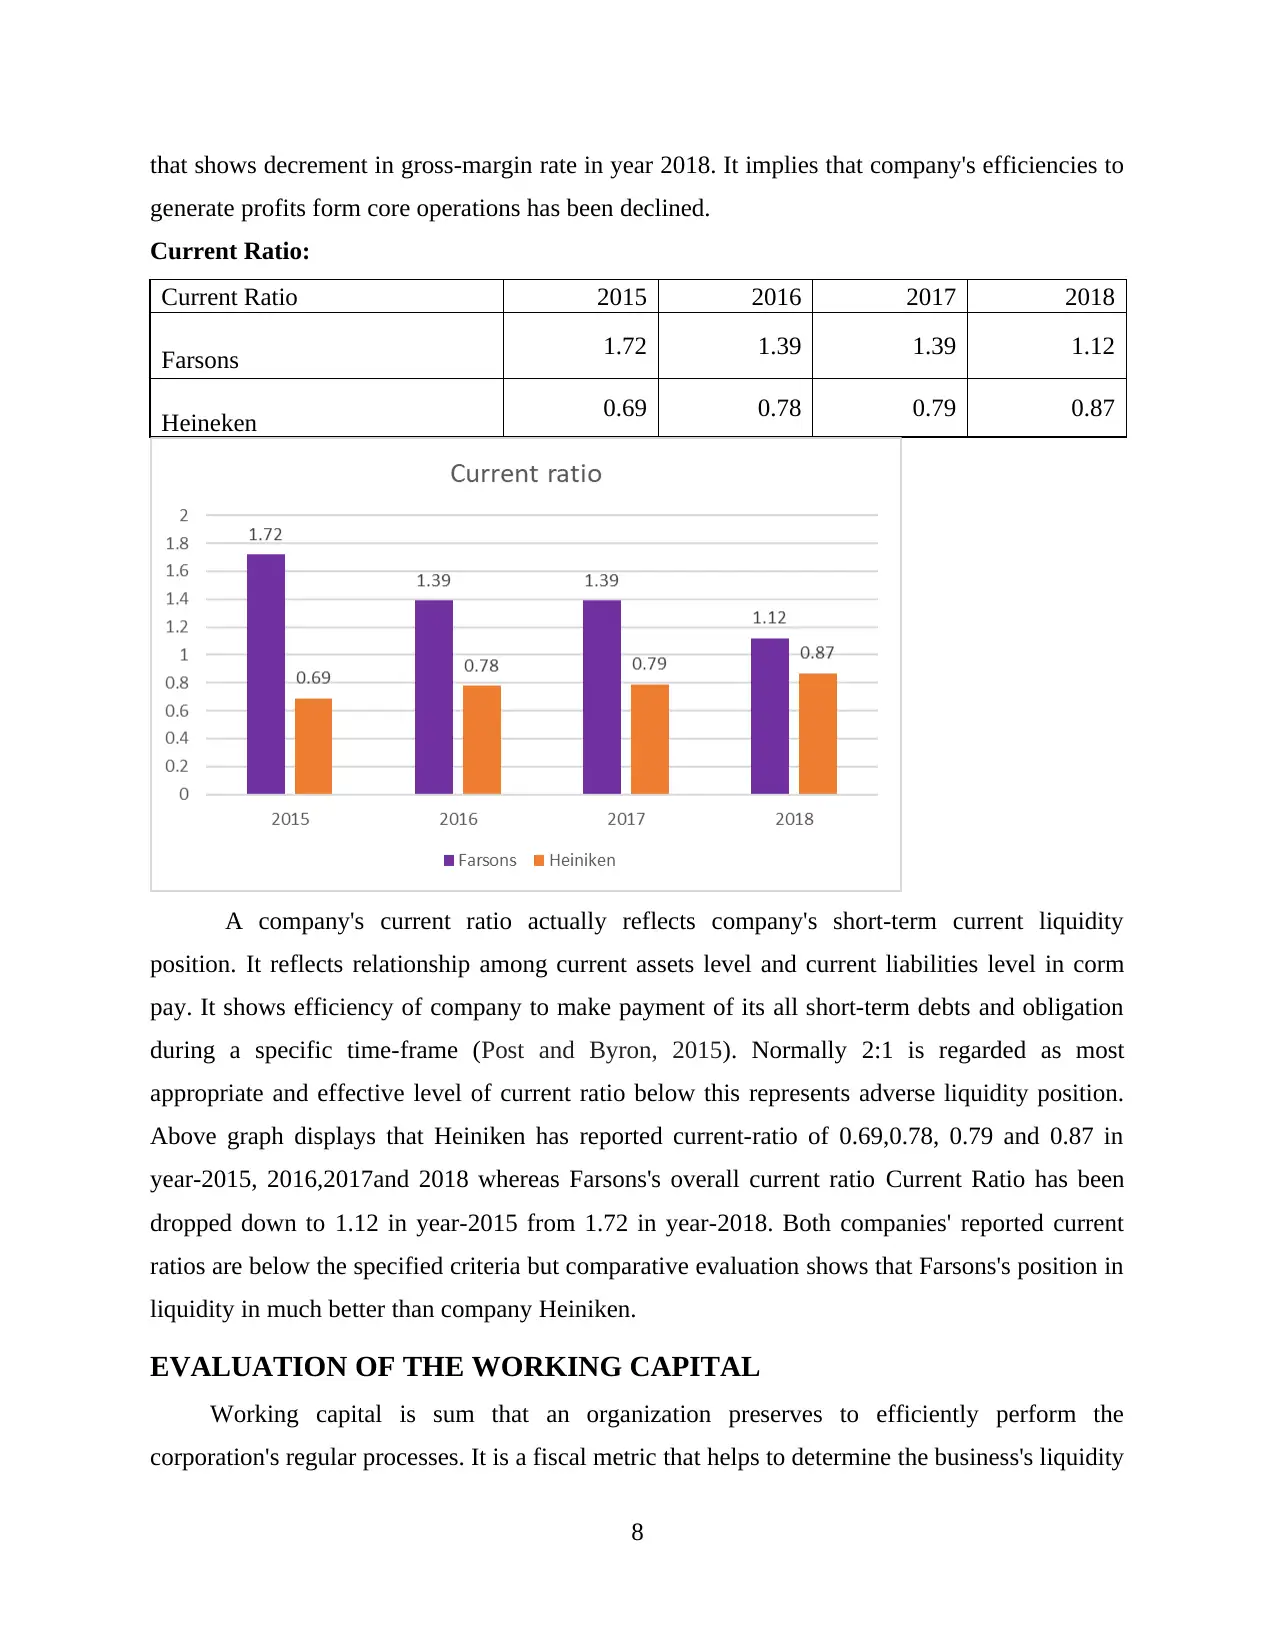
Current Ratio:
Current Ratio 2015 2016 2017 2018
Farsons 1.72 1.39 1.39 1.12
Heineken 0.69 0.78 0.79 0.87
A company's current ratio actually reflects company's short-term current liquidity
position. It reflects relationship among current assets level and current liabilities level in corm
pay. It shows efficiency of company to make payment of its all short-term debts and obligation
during a specific time-frame (Post and Byron, 2015). Normally 2:1 is regarded as most
appropriate and effective level of current ratio below this represents adverse liquidity position.
Above graph displays that Heiniken has reported current-ratio of 0.69,0.78, 0.79 and 0.87 in
year-2015, 2016,2017and 2018 whereas Farsons's overall current ratio Current Ratio has been
dropped down to 1.12 in year-2015 from 1.72 in year-2018. Both companies' reported current
ratios are below the specified criteria but comparative evaluation shows that Farsons's position in
liquidity in much better than company Heiniken.
EVALUATION OF THE WORKING CAPITAL
Working capital is sum that an organization preserves to efficiently perform the
corporation's regular processes. It is a fiscal metric that helps to determine the business's liquidity
8
generate profits form core operations has been declined.
Current Ratio:
Current Ratio 2015 2016 2017 2018
Farsons 1.72 1.39 1.39 1.12
Heineken 0.69 0.78 0.79 0.87
A company's current ratio actually reflects company's short-term current liquidity
position. It reflects relationship among current assets level and current liabilities level in corm
pay. It shows efficiency of company to make payment of its all short-term debts and obligation
during a specific time-frame (Post and Byron, 2015). Normally 2:1 is regarded as most
appropriate and effective level of current ratio below this represents adverse liquidity position.
Above graph displays that Heiniken has reported current-ratio of 0.69,0.78, 0.79 and 0.87 in
year-2015, 2016,2017and 2018 whereas Farsons's overall current ratio Current Ratio has been
dropped down to 1.12 in year-2015 from 1.72 in year-2018. Both companies' reported current
ratios are below the specified criteria but comparative evaluation shows that Farsons's position in
liquidity in much better than company Heiniken.
EVALUATION OF THE WORKING CAPITAL
Working capital is sum that an organization preserves to efficiently perform the
corporation's regular processes. It is a fiscal metric that helps to determine the business's liquidity
8
Paraphrase This Document
Need a fresh take? Get an instant paraphrase of this document with our AI Paraphraser
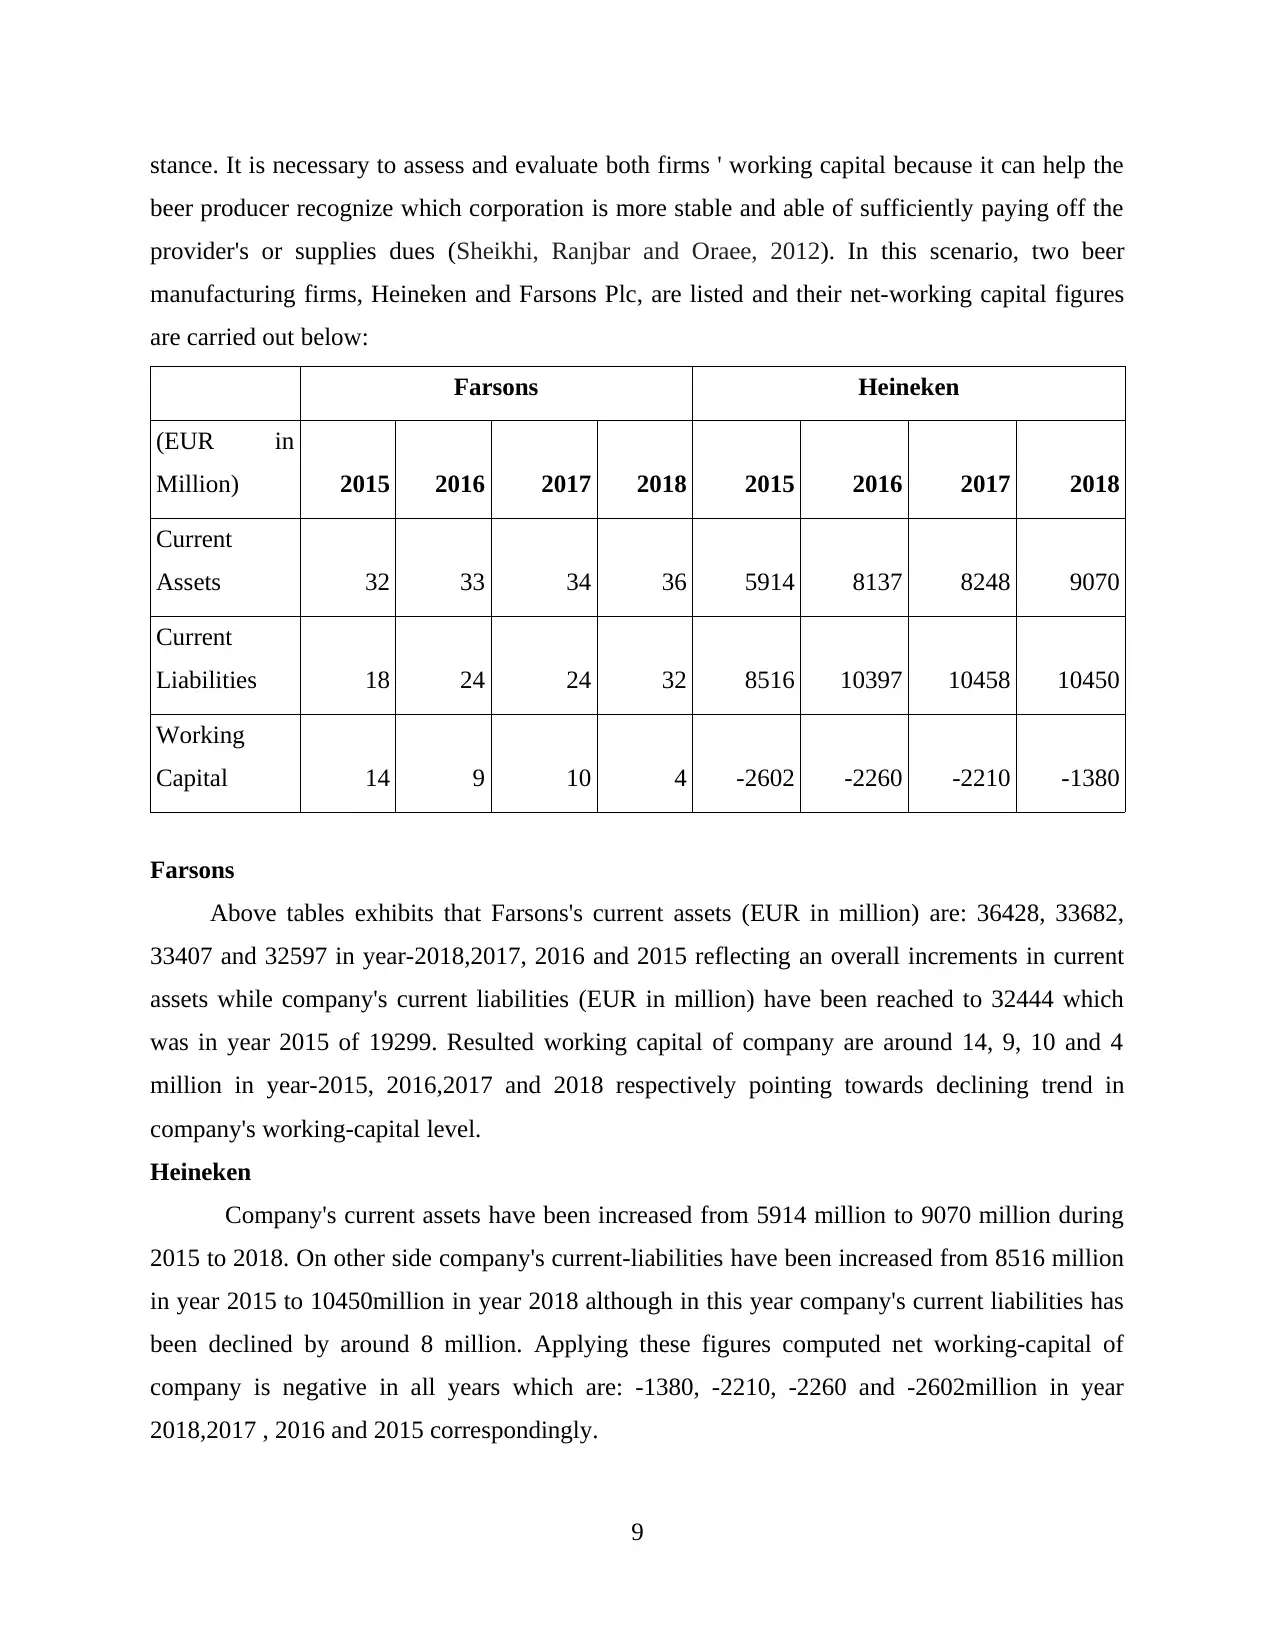
stance. It is necessary to assess and evaluate both firms ' working capital because it can help the
beer producer recognize which corporation is more stable and able of sufficiently paying off the
provider's or supplies dues (Sheikhi, Ranjbar and Oraee, 2012). In this scenario, two beer
manufacturing firms, Heineken and Farsons Plc, are listed and their net-working capital figures
are carried out below:
Farsons Heineken
(EUR in
Million) 2015 2016 2017 2018 2015 2016 2017 2018
Current
Assets 32 33 34 36 5914 8137 8248 9070
Current
Liabilities 18 24 24 32 8516 10397 10458 10450
Working
Capital 14 9 10 4 -2602 -2260 -2210 -1380
Farsons
Above tables exhibits that Farsons's current assets (EUR in million) are: 36428, 33682,
33407 and 32597 in year-2018,2017, 2016 and 2015 reflecting an overall increments in current
assets while company's current liabilities (EUR in million) have been reached to 32444 which
was in year 2015 of 19299. Resulted working capital of company are around 14, 9, 10 and 4
million in year-2015, 2016,2017 and 2018 respectively pointing towards declining trend in
company's working-capital level.
Heineken
Company's current assets have been increased from 5914 million to 9070 million during
2015 to 2018. On other side company's current-liabilities have been increased from 8516 million
in year 2015 to 10450million in year 2018 although in this year company's current liabilities has
been declined by around 8 million. Applying these figures computed net working-capital of
company is negative in all years which are: -1380, -2210, -2260 and -2602million in year
2018,2017 , 2016 and 2015 correspondingly.
9
Both companies' comparison reflects that Farosns has reported positive and increased
working capital figures while Heineken has reported negative figures of working capital which
indicates that company has shortage of funds to operate routine business processes. Thus Farsons
is more efficient as per evaluation of working-capital position.
EVALUATION OF THE CASH FLOW
A cash flow report or statement is crucial document which provides details about net in
and out flow cash or monies in an enterprise. A cash-flow is prepared by companies by
classifying business tasks into financing, operating and investments (Vogel, 2014). Through
aggregation of these all activities' cash flows company's net free-cash-flows are determined.
Analysis of cash-flows is significant to assess adequacy of liquid cash-funds in company to
operate business activities. It also aid in controlling overall cash spending and receipts within
corporation.
Heiniken: Corporation's cash-flows generated by operational activities are 3489, 3718,
3882 and 4388 in 2015,2016,2017 and 2018 (figure are in million) respectively. While overall
net outflows of corporation by its all investment tasks from 2015 to 2018 are: 2064, 2,007, 2965
and 2355-million respectively. Through financing operations company's cash-flows are
1173million, 672, 966 and 967-million respectively during period 2015-2018. By summarizing
all cash in-out flows from different activities net-free cash-flows are: 1759, 1,852, 2,049and
2,333 million in year-2015,2016, 2017 and 2018 correspondingly and indicating up ward or
increasing trend. Throughout the entire period business has reported positive balance of free-
cash-flow it means company's liquidity situation in sound and efficient to pay all short-term
liabilities.
Farsons: Cash-flows generated by company Farsons are around 16, 16, 13 and 21million
during 2015 to 2018 respectively, reflecting increment in cash generation capacity of company.
Where as though investing task company has made outflows of 7, 18, 20 and 21 million during
2015,2016,2017 and 2018 year respectively. Corporation's financing operation have lead to cash-
flows of -4, -2, 4 and -1 millions through year-2015, 2016,2017 and 2018 respectively. Overall
net cash-flows in business after considering all activities are 9, -1, -6 and 7million during year-
2015,2016, 2017 and2018 respectively. These reported figures shows that during after period of
2016, in business cash-flows goes negative which are further improved in 2018. A negative cash-
10
⊘ This is a preview!⊘
Do you want full access?
Subscribe today to unlock all pages.
Trusted by 1+ million students worldwide
1 out of 36
Related Documents


Your All-in-One AI-Powered Toolkit for Academic Success.
+13062052269
info@desklib.com
Available 24*7 on WhatsApp / Email
![[object Object]](/_next/static/media/star-bottom.7253800d.svg)
Unlock your academic potential
Copyright © 2020–2026 A2Z Services. All Rights Reserved. Developed and managed by ZUCOL.