Hell Pizza: Customer Satisfaction and Profit Generation Case Study
VerifiedAdded on 2022/11/29
|26
|4518
|1
Report
AI Summary
This business research project examines the relationship between customer satisfaction and profit generation, using Hell Pizza as a case study. The research explores employee approaches to sales, training programs for customer satisfaction, and strategies for improvement. The methodology includes a mixed-method approach, utilizing both quantitative surveys with 50 customers and qualitative interviews with 3 managers. The report analyzes data on gender, age, education, and purchasing habits, as well as customer perceptions of healthy vs. fast foods and likelihood to purchase. The literature review covers employee satisfaction, employee performance, and customer satisfaction, examining the impact of employee performance. The data analysis includes both quantitative and qualitative findings, with recommendations provided based on the research results. The project also discusses the importance of customer relationship management, data privacy, and the role of managers in achieving customer satisfaction.
Running head: BUSINESS RESEARCH PROJECT
Customer satisfaction and profit generation: A case study of Hell Pizza
Name of the student:
Name of the University:
Author note:
Customer satisfaction and profit generation: A case study of Hell Pizza
Name of the student:
Name of the University:
Author note:
Paraphrase This Document
Need a fresh take? Get an instant paraphrase of this document with our AI Paraphraser
1
BUSINESS RESEARCH REPORT
Table of contents
Introduction................................................................................................................................2
Project objectives.......................................................................................................................2
Methodology..............................................................................................................................2
Research tools for data collection..........................................................................................2
Tools for analysing the collected data....................................................................................3
Summary of the project topic.....................................................................................................4
Literature review........................................................................................................................4
Employee satisfaction............................................................................................................4
Employee performance..........................................................................................................4
Customer satisfaction.............................................................................................................5
Impact of employee performance on customer satisfaction...................................................5
Data analysis..............................................................................................................................6
Quantitative data analysis......................................................................................................6
Qualitative data analysis......................................................................................................16
Recommendations based on the research findings...................................................................16
Conclusion................................................................................................................................17
References................................................................................................................................18
Bibliography.............................................................................................................................20
Appendices...............................................................................................................................21
2
BUSINESS RESEARCH REPORT
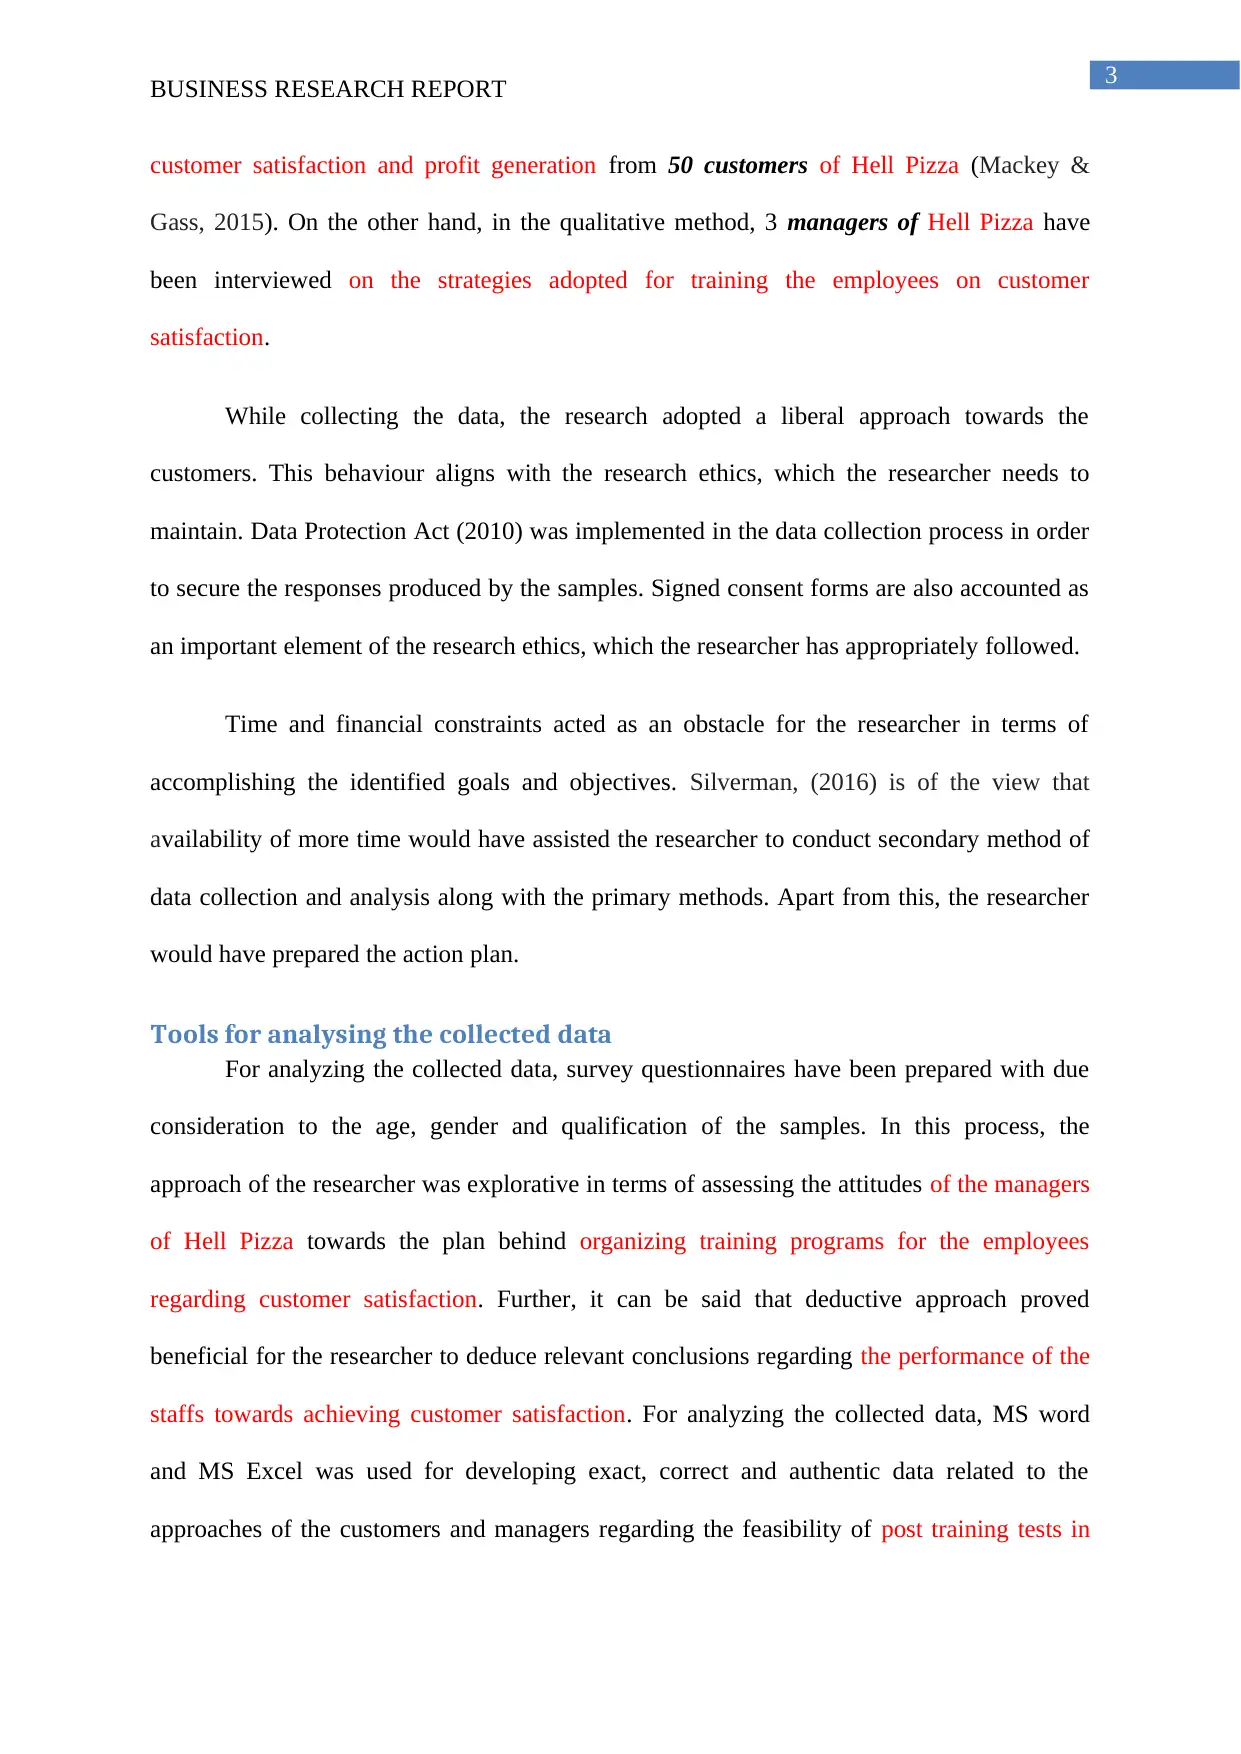
Introduction
Satisfaction of the customers is vital in the present ambience of competition in the
market. The companies and organizations, in order to sustain the market position,
compromise with customer satisfaction. This approach is a deviant one from the marketing
ethics. In this aspect, generation of profit attains more priority in comparison to profit
generation (Crane, Matten & Spence, 2019). Conducting need analysis on the customers is
beneficial in terms of reaching to the specific needs, demands and requirements. This
assignment attempts to shed light on the relationship between customer satisfaction and profit
generation through the example of Hell Pizza. The main focus in this aspect would be on the
aspects of job satisfaction and employee performance.
Project objectives
The research revolves around the following objectives:
To explore the approaches of the employees towards the sale of the foods in Hell
Pizza
To assess the strategies adopted by Hell Pizza for training the employees about
customer satisfaction
To suggest recommendations for improving the standards and quality of the training
programs in Hell Pizza
Methodology
Research tools for data collection
For collecting the necessary data, mixed method has been adopted. As a matter of
specification, both quantitative and qualitative methods have acted assistance. In
quantitative, survey has been used for collecting the required data on employee performance,
BUSINESS RESEARCH REPORT
Introduction
Satisfaction of the customers is vital in the present ambience of competition in the
market. The companies and organizations, in order to sustain the market position,
compromise with customer satisfaction. This approach is a deviant one from the marketing
ethics. In this aspect, generation of profit attains more priority in comparison to profit
generation (Crane, Matten & Spence, 2019). Conducting need analysis on the customers is
beneficial in terms of reaching to the specific needs, demands and requirements. This
assignment attempts to shed light on the relationship between customer satisfaction and profit
generation through the example of Hell Pizza. The main focus in this aspect would be on the
aspects of job satisfaction and employee performance.
Project objectives
The research revolves around the following objectives:
To explore the approaches of the employees towards the sale of the foods in Hell
Pizza
To assess the strategies adopted by Hell Pizza for training the employees about
customer satisfaction
To suggest recommendations for improving the standards and quality of the training
programs in Hell Pizza
Methodology
Research tools for data collection
For collecting the necessary data, mixed method has been adopted. As a matter of
specification, both quantitative and qualitative methods have acted assistance. In
quantitative, survey has been used for collecting the required data on employee performance,
⊘ This is a preview!⊘
Do you want full access?
Subscribe today to unlock all pages.
Trusted by 1+ million students worldwide
3
BUSINESS RESEARCH REPORT
customer satisfaction and profit generation from 50 customers of Hell Pizza (Mackey &
Gass, 2015). On the other hand, in the qualitative method, 3 managers of Hell Pizza have
been interviewed on the strategies adopted for training the employees on customer
satisfaction.
While collecting the data, the research adopted a liberal approach towards the
customers. This behaviour aligns with the research ethics, which the researcher needs to
maintain. Data Protection Act (2010) was implemented in the data collection process in order
to secure the responses produced by the samples. Signed consent forms are also accounted as
an important element of the research ethics, which the researcher has appropriately followed.
Time and financial constraints acted as an obstacle for the researcher in terms of
accomplishing the identified goals and objectives. Silverman, (2016) is of the view that
availability of more time would have assisted the researcher to conduct secondary method of
data collection and analysis along with the primary methods. Apart from this, the researcher
would have prepared the action plan.
Tools for analysing the collected data
For analyzing the collected data, survey questionnaires have been prepared with due
consideration to the age, gender and qualification of the samples. In this process, the
approach of the researcher was explorative in terms of assessing the attitudes of the managers
of Hell Pizza towards the plan behind organizing training programs for the employees
regarding customer satisfaction. Further, it can be said that deductive approach proved
beneficial for the researcher to deduce relevant conclusions regarding the performance of the
staffs towards achieving customer satisfaction. For analyzing the collected data, MS word
and MS Excel was used for developing exact, correct and authentic data related to the
approaches of the customers and managers regarding the feasibility of post training tests in
Paraphrase This Document
Need a fresh take? Get an instant paraphrase of this document with our AI Paraphraser
4
BUSINESS RESEARCH REPORT
assessing the capability of the staffs of Hell Pizza towards making practical application of the
learnt skills towards achieving customer satisfaction (Alvesson & Sköldberg, 2017).
Summary of the project topic
Hell Pizza has achieved accolades and glory by emerging as a multinational pizza
retail chain in New Zealand. Founded in 1996, the company has spread its operation in the
countries of United Kingdom, Australia, Seoul, India and Vancouver. As a matter of
specification, the company caters to appetite needs of the clients and the customers through
the provision of quality pizza, pasta, dips, desserts and nectar. The company receives intense
competition from Domino’s Pizza (Hellpizza.com, 2019).
The aspects of customer satisfaction is inappropriate in the workplace of Hell Pizza.
This research would act assistance in gaining an insight into the approach of the managers
and the employees regarding customer satisfaction.
Literature review
Employee satisfaction
The workplace conditions needs to be such that the staffs feel an urge to expose better
performance. In this, Herzberg’s theory of motivation can be linked, which reflects the
hygiene factors, motivating the staffs. According to Martinaityte, Sacramento and Aryee,
(2019), the motivational factors are rewards, recognition, praises, incentives and others,
which are used for luring the staffs towards the company services. On the other hand,
hygienic factors like pay, company policies, fringe benefits, physical working conditions and
others generate dissatisfaction among the staffs. These factors need to be avoided for averting
the negative results in terms of accomplishing the identified targets.
5
BUSINESS RESEARCH REPORT
Employee performance
Upon recruitment, the staffs are assigned tasks by the managers for assessing their
capability towards performing in the given environment. The exposed performance is scored
by the managers to make estimates regarding the future actions, which they need to undertake
for upgrading the standards and quality of the operations. In this, Zablah et al., (2016) is of
the view that performance management systems are adopted by the Board for mapping the
exposed performance within certain criteria or performance indicators. Typical example of
these systems are balanced scorecards, 360 degree feedbacks, performance appraisal and
others. Training programs are organized for the staffs for upgrading the standards and quality
of their performance. As per the arguments of Menguc, Auh, Katsikeas and Jung, (2016),
post training tests are conducted for ensuring whether the staffs are prepared for making
practical application of the learnt skills for executing the tasks according to the identified and
specified goals.
Customer satisfaction
The products and the services offered by the brands is for the customers. Strategic
planning towards marketing these products and services yields positive results in terms of
increasing the sales revenue and the profit margin. In this context, the aspect of customer
relationship management can be related. On the contrary, Hill and Brierley, (2017) opine that
adopting the means of survey and feedbacks is fruitful in terms of gaining an insight into the
specific tastes and preference of the clients and the customers. Using privacy cookies and
policies is an effective means for securing the responses of the customers towards the levied
offers and services. In this, Data Protection Act (1998) and Consumer Protection Act is
crucial for ensuring the wellbeing of the customers.
Impact of employee performance on customer satisfaction
If the staffs are conscious about the needs of the customers, they can provide quality
goods and services to the customers. Mention can be made of the efforts of the research and
⊘ This is a preview!⊘
Do you want full access?
Subscribe today to unlock all pages.
Trusted by 1+ million students worldwide
6
BUSINESS RESEARCH REPORT
development team, who work towards preparing quality and branded goods for the clients
and the customers. Along with this, Menguc, Auh, Yeniaras and Katsikeas, (2017) argue that
the efforts of the sales and marketing team is also accounted as important for achieving
customer satisfaction. This is in terms of conducting the marketing activities in an efficient
and effective manner. Uploading the considered marketing trends on the social media is an
efficient means for enhancing the trafficking of the audience towards the brand image. The
managers’ role is crucial in terms of correcting the staffs if they deviate from the identified
goals. In this, Trait Theory can be applied. Bakotić, (2016) thinks that this is because
consideration of evaluation brings radical transformation in the performance of the staffs,
which is beneficial for the companies and organizations in terms of achieving success.
Data analysis
Quantitative data analysis
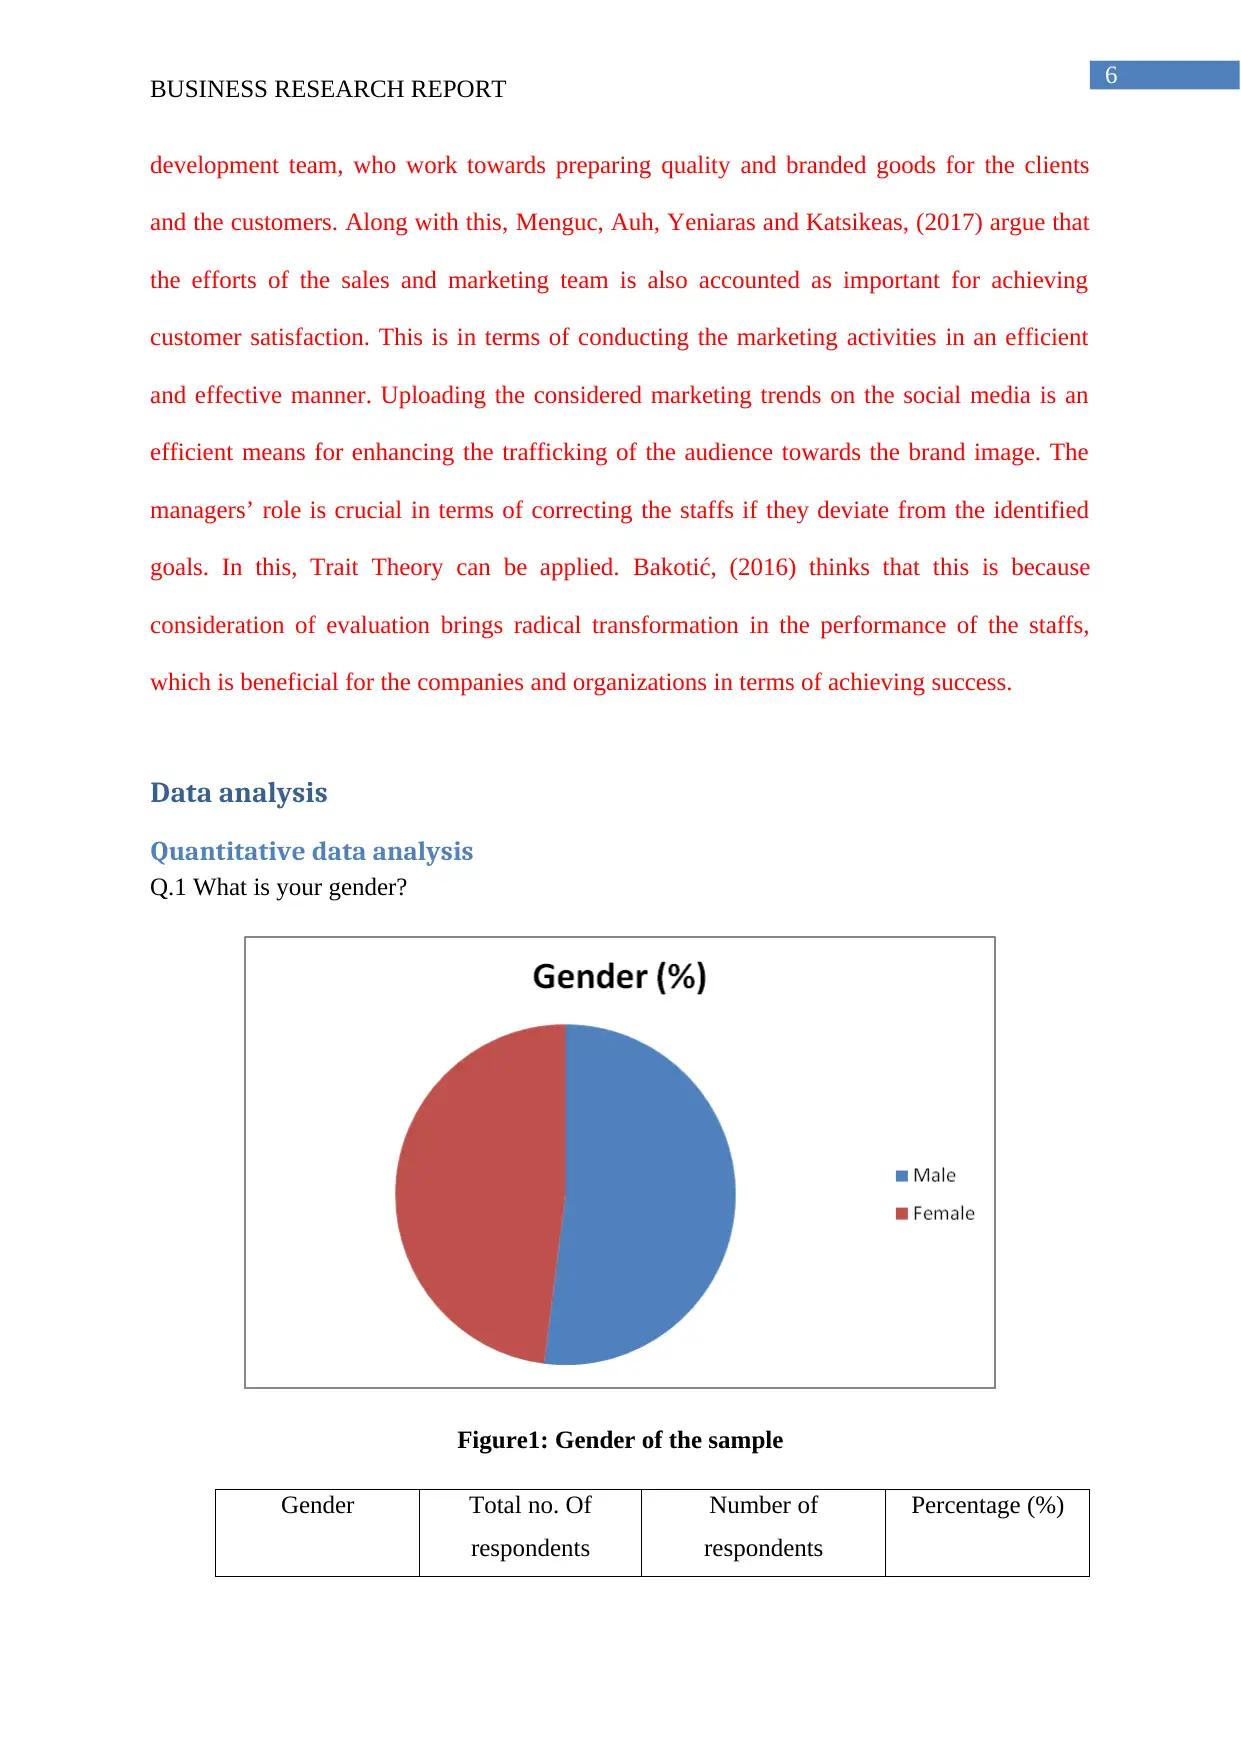
Q.1 What is your gender?
Figure1: Gender of the sample
Gender Total no. Of
respondents
Number of
respondents
Percentage (%)
BUSINESS RESEARCH REPORT
development team, who work towards preparing quality and branded goods for the clients
and the customers. Along with this, Menguc, Auh, Yeniaras and Katsikeas, (2017) argue that
the efforts of the sales and marketing team is also accounted as important for achieving
customer satisfaction. This is in terms of conducting the marketing activities in an efficient
and effective manner. Uploading the considered marketing trends on the social media is an
efficient means for enhancing the trafficking of the audience towards the brand image. The
managers’ role is crucial in terms of correcting the staffs if they deviate from the identified
goals. In this, Trait Theory can be applied. Bakotić, (2016) thinks that this is because
consideration of evaluation brings radical transformation in the performance of the staffs,
which is beneficial for the companies and organizations in terms of achieving success.
Data analysis
Quantitative data analysis
Q.1 What is your gender?
Figure1: Gender of the sample
Gender Total no. Of
respondents
Number of
respondents
Percentage (%)
Paraphrase This Document
Need a fresh take? Get an instant paraphrase of this document with our AI Paraphraser
7
BUSINESS RESEARCH REPORT
Male 50 26 52
Female 50 24 48
Table 1: Gender specifications of the samples
The above table and chart represents the gender specifications of the samples. As a
matter of specification, out of 50 customers of Hell Pizza, 26 are male, which accounts for
52%. 24 out of 50 customers are female, which is 48%.
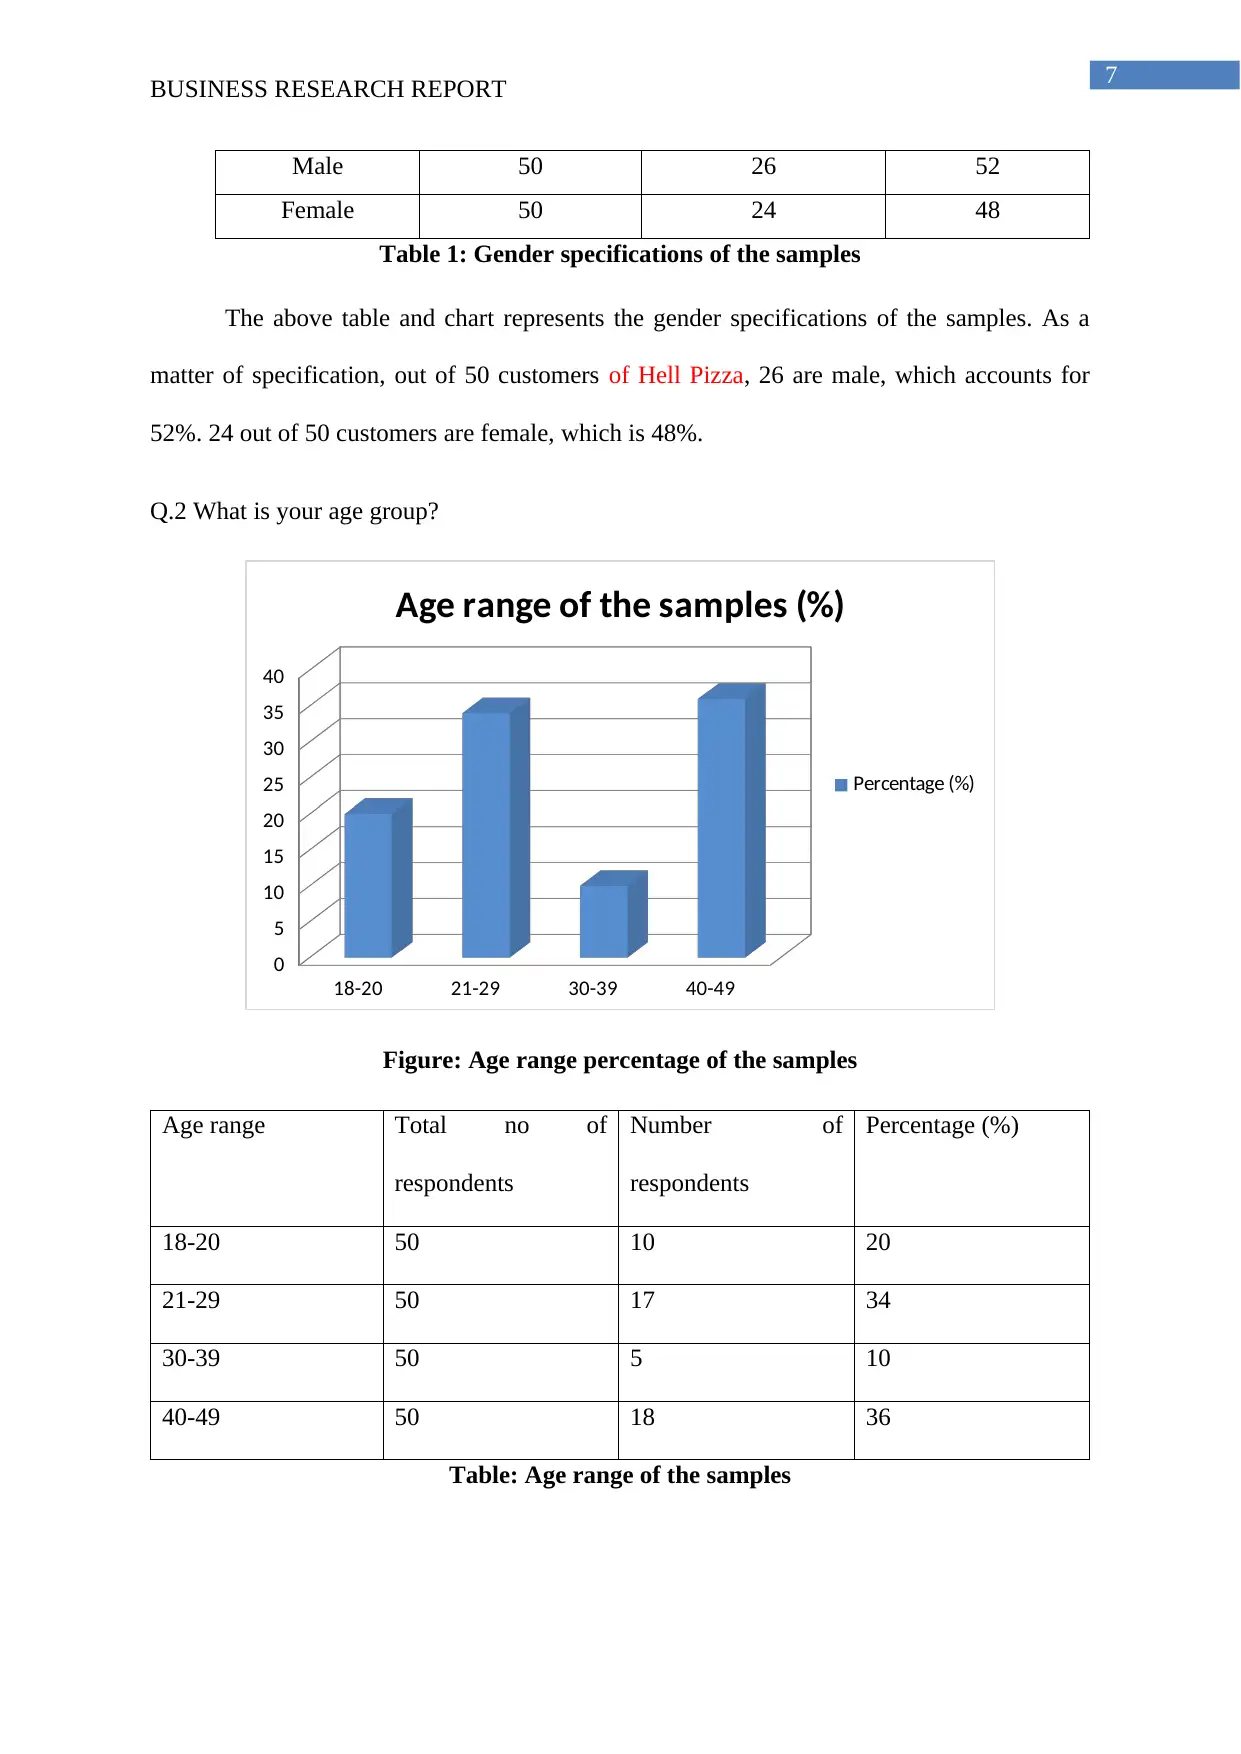
Q.2 What is your age group?
18-20 21-29 30-39 40-49
0
5
10
15
20
25
30
35
40
Age range of the samples (%)
Percentage (%)
Figure: Age range percentage of the samples
Age range Total no of
respondents
Number of
respondents
Percentage (%)
18-20 50 10 20
21-29 50 17 34
30-39 50 5 10
40-49 50 18 36
Table: Age range of the samples
BUSINESS RESEARCH REPORT
Male 50 26 52
Female 50 24 48
Table 1: Gender specifications of the samples
The above table and chart represents the gender specifications of the samples. As a
matter of specification, out of 50 customers of Hell Pizza, 26 are male, which accounts for
52%. 24 out of 50 customers are female, which is 48%.
Q.2 What is your age group?
18-20 21-29 30-39 40-49
0
5
10
15
20
25
30
35
40
Age range of the samples (%)
Percentage (%)
Figure: Age range percentage of the samples
Age range Total no of
respondents
Number of
respondents
Percentage (%)
18-20 50 10 20
21-29 50 17 34
30-39 50 5 10
40-49 50 18 36
Table: Age range of the samples
8
BUSINESS RESEARCH REPORT
The above chart and graph represents the age range of the samples selected from the
customers of Hell Pizza. Out of 50 customers, 10 belong to the age group of 18-20. This
accounts for 20%. 17 customers belong to the age group of 21-29, which is 34%. 10% of the
customers, which is 5 customers, belong to the age group of 30-39 years. The rest of 18
customers belong to the age group of 40-49 years, accounting for 36%. This reflects that
majority of the customers have been selected based on their awareness about the marketing of
fast foods by the company.
Q.3 Please elucidate about your education level?
Education levels Total no of
respondents
No. Of
respondents
Percentage (%)
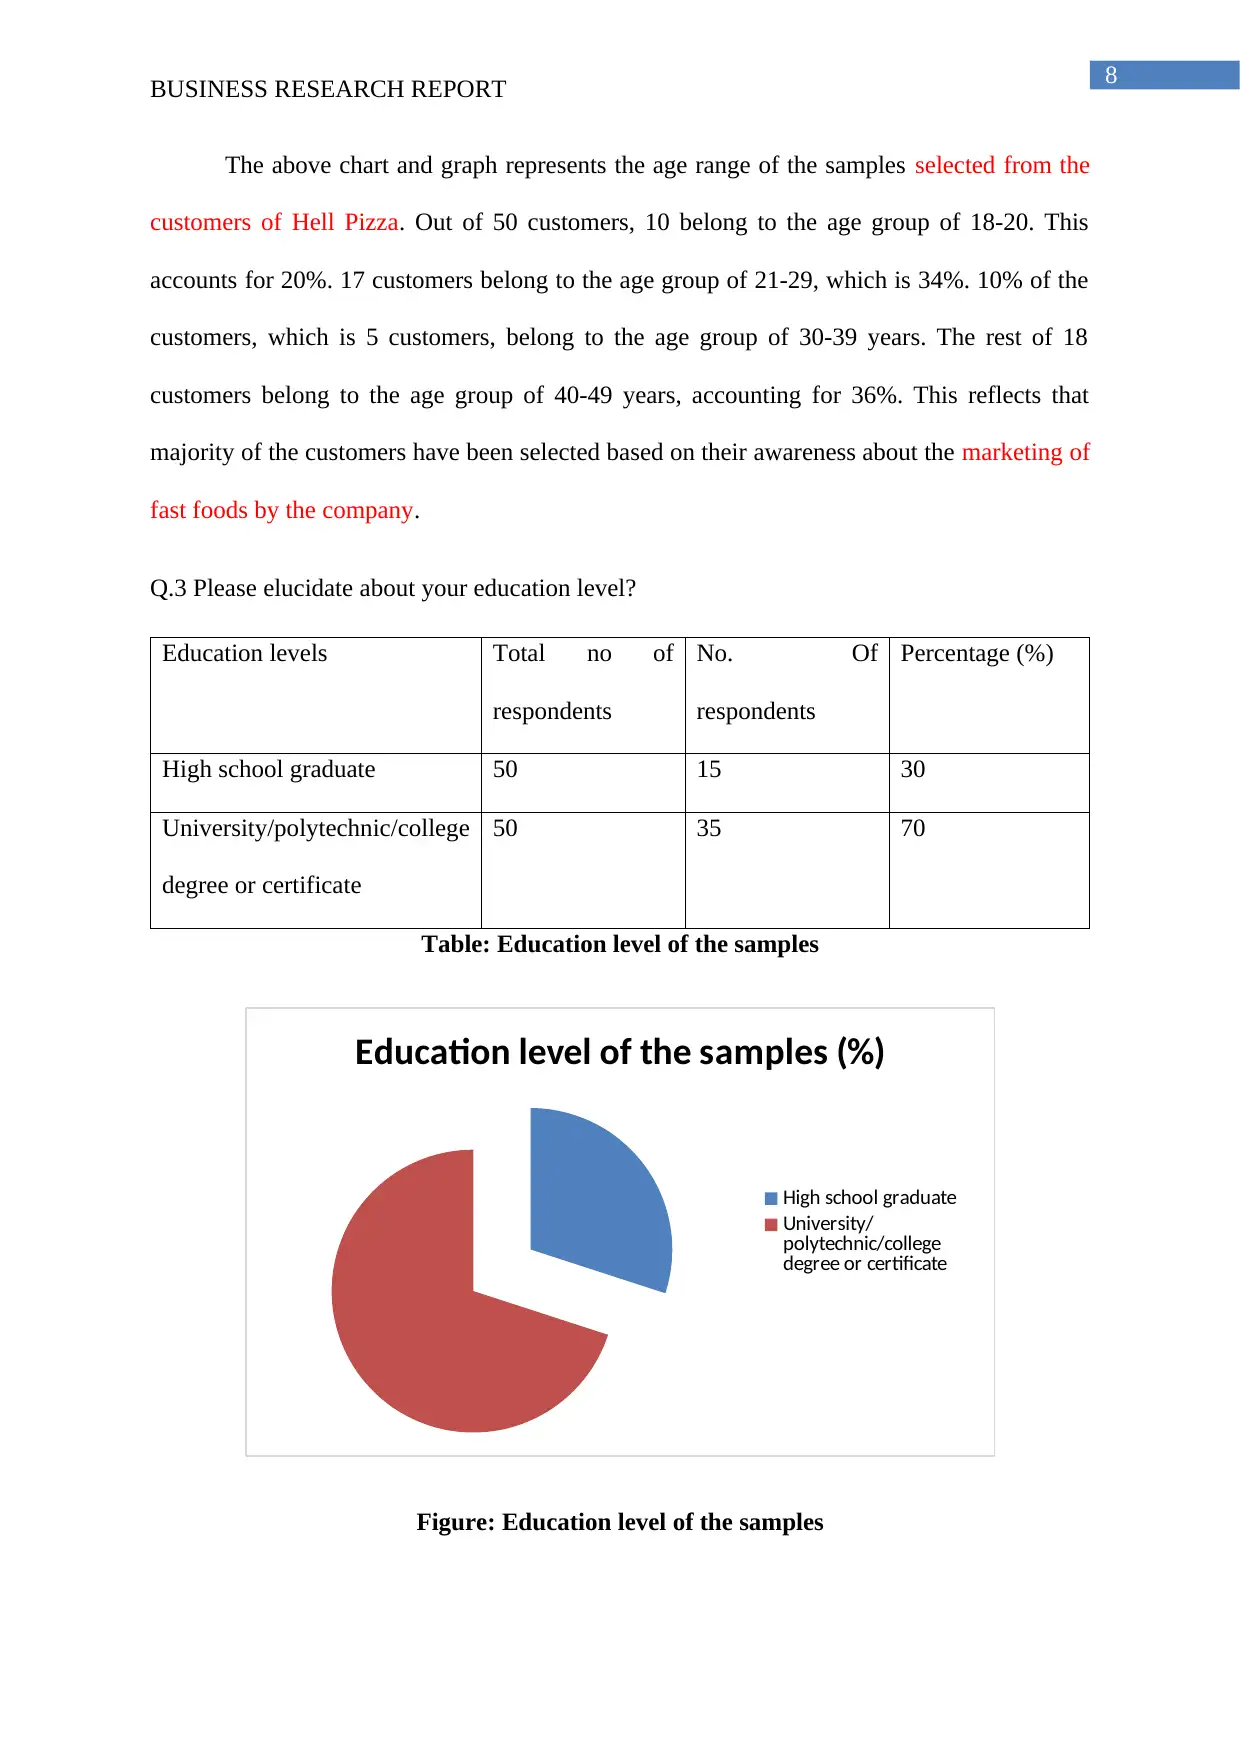
High school graduate 50 15 30
University/polytechnic/college
degree or certificate
50 35 70
Table: Education level of the samples
Education level of the samples (%)
High school graduate
University/
polytechnic/college
degree or certificate
Figure: Education level of the samples
BUSINESS RESEARCH REPORT
The above chart and graph represents the age range of the samples selected from the
customers of Hell Pizza. Out of 50 customers, 10 belong to the age group of 18-20. This
accounts for 20%. 17 customers belong to the age group of 21-29, which is 34%. 10% of the
customers, which is 5 customers, belong to the age group of 30-39 years. The rest of 18
customers belong to the age group of 40-49 years, accounting for 36%. This reflects that
majority of the customers have been selected based on their awareness about the marketing of
fast foods by the company.
Q.3 Please elucidate about your education level?
Education levels Total no of
respondents
No. Of
respondents
Percentage (%)
High school graduate 50 15 30
University/polytechnic/college
degree or certificate
50 35 70
Table: Education level of the samples
Education level of the samples (%)
High school graduate
University/
polytechnic/college
degree or certificate
Figure: Education level of the samples
⊘ This is a preview!⊘
Do you want full access?
Subscribe today to unlock all pages.
Trusted by 1+ million students worldwide
9
BUSINESS RESEARCH REPORT
The above table and chart represents the education level of the samples considered
from the customers of Hell Pizza. Out of 50 customers, 15 are high school graduates. This
accounts for 30%. And the rest of 70% of the customers, that is 35, have degrees from
universities, polytechnic courses or certified courses. The majority of the customers are
highly qualifies, which indicates tactfulness decision making towards the purchasing fast
foods from the company.
Q4. Do you buy fast foods often?
Options Total no of
respondents
No of respondents Percentage (%)
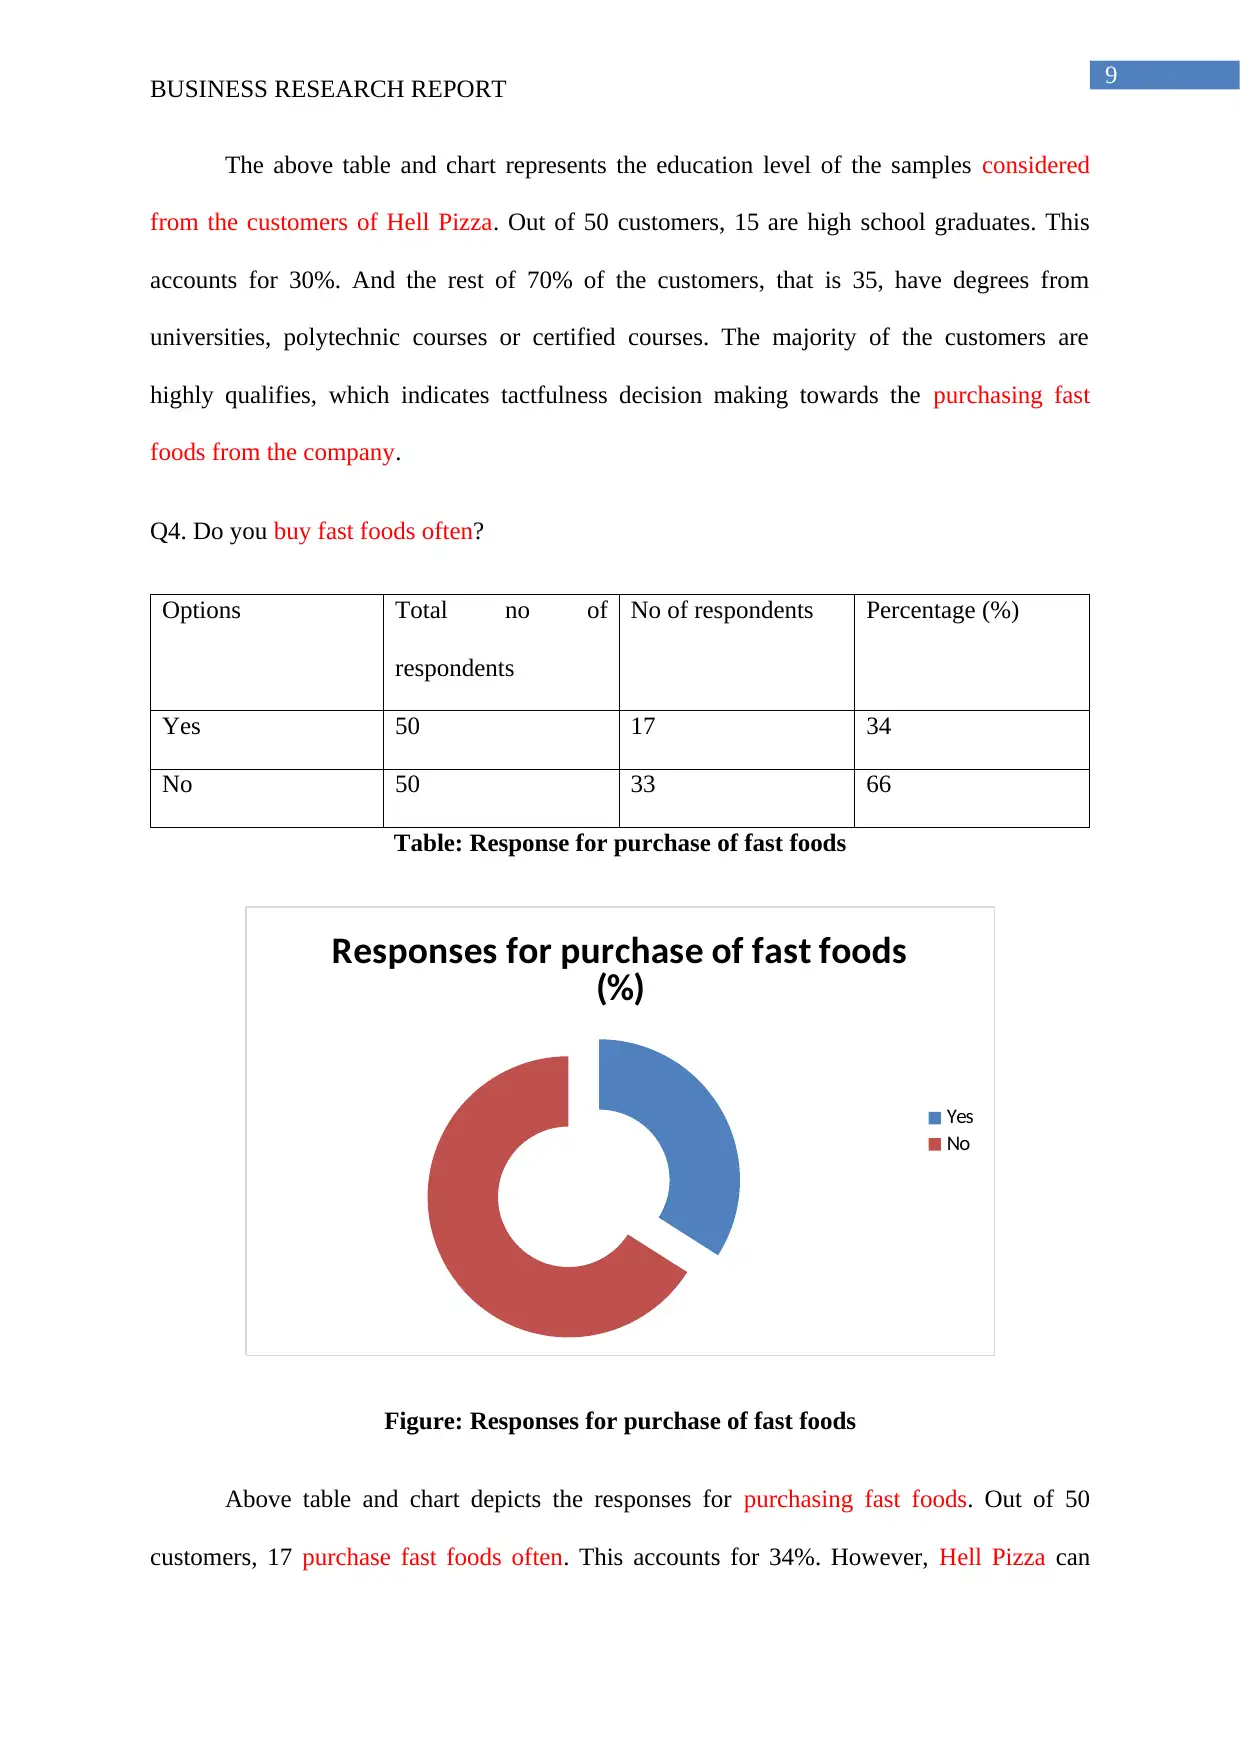
Yes 50 17 34
No 50 33 66
Table: Response for purchase of fast foods
Responses for purchase of fast foods
(%)
Yes
No
Figure: Responses for purchase of fast foods
Above table and chart depicts the responses for purchasing fast foods. Out of 50
customers, 17 purchase fast foods often. This accounts for 34%. However, Hell Pizza can
BUSINESS RESEARCH REPORT
The above table and chart represents the education level of the samples considered
from the customers of Hell Pizza. Out of 50 customers, 15 are high school graduates. This
accounts for 30%. And the rest of 70% of the customers, that is 35, have degrees from
universities, polytechnic courses or certified courses. The majority of the customers are
highly qualifies, which indicates tactfulness decision making towards the purchasing fast
foods from the company.
Q4. Do you buy fast foods often?
Options Total no of
respondents
No of respondents Percentage (%)
Yes 50 17 34
No 50 33 66
Table: Response for purchase of fast foods
Responses for purchase of fast foods
(%)
Yes
No
Figure: Responses for purchase of fast foods
Above table and chart depicts the responses for purchasing fast foods. Out of 50
customers, 17 purchase fast foods often. This accounts for 34%. However, Hell Pizza can
Paraphrase This Document
Need a fresh take? Get an instant paraphrase of this document with our AI Paraphraser
10
BUSINESS RESEARCH REPORT
gain profit from the rest of the 33 customers, who do purchase fast foods once in a while. As
these 66% of the samples have not experimented with fast foods, it would be helpful for the
company to expand the customer base.
Q5. Do you think that healthy foods are more advantageous than fast foods in terms of
marketing?
Options Total no. of
respondents
No. Of respondents Percentage (%)
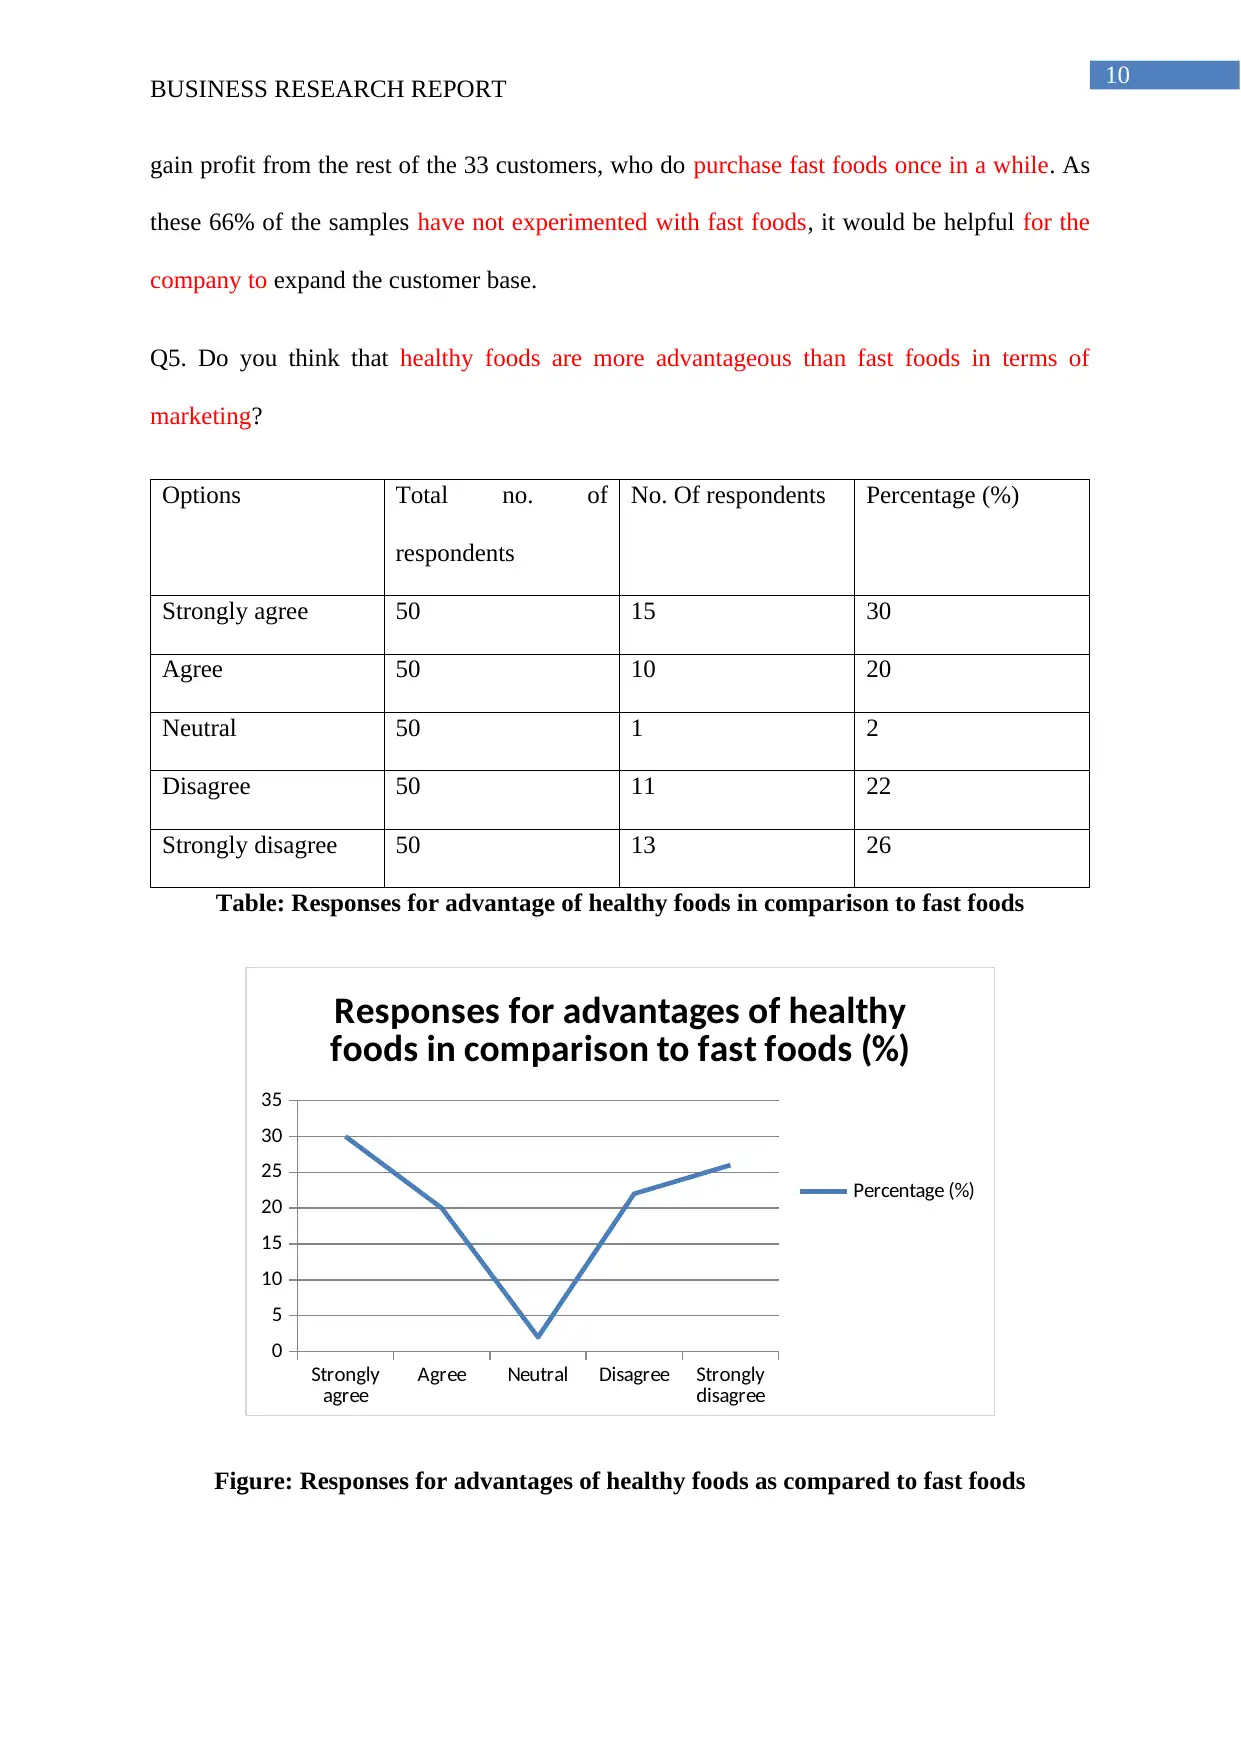
Strongly agree 50 15 30
Agree 50 10 20
Neutral 50 1 2
Disagree 50 11 22
Strongly disagree 50 13 26
Table: Responses for advantage of healthy foods in comparison to fast foods
Strongly
agree Agree Neutral Disagree Strongly
disagree
0
5
10
15
20
25
30
35
Responses for advantages of healthy
foods in comparison to fast foods (%)
Percentage (%)
Figure: Responses for advantages of healthy foods as compared to fast foods
BUSINESS RESEARCH REPORT
gain profit from the rest of the 33 customers, who do purchase fast foods once in a while. As
these 66% of the samples have not experimented with fast foods, it would be helpful for the
company to expand the customer base.
Q5. Do you think that healthy foods are more advantageous than fast foods in terms of
marketing?
Options Total no. of
respondents
No. Of respondents Percentage (%)
Strongly agree 50 15 30
Agree 50 10 20
Neutral 50 1 2
Disagree 50 11 22
Strongly disagree 50 13 26
Table: Responses for advantage of healthy foods in comparison to fast foods
Strongly
agree Agree Neutral Disagree Strongly
disagree
0
5
10
15
20
25
30
35
Responses for advantages of healthy
foods in comparison to fast foods (%)
Percentage (%)
Figure: Responses for advantages of healthy foods as compared to fast foods
11
BUSINESS RESEARCH REPORT
The above table and chart depicts the responses towards advantages of healthy foods
as comparison to fast foods in terms of marketing 15 out of 50 customers, that is 30%,
strongly agree that marketing of healthy foods are more advantageous than fast foods. 10 out
of 50 customers, that is, 20 % agree that healthy foods are effective in terms of reducing the
instances of obesity. 1 out of the 50 customers remained neutral. On the contrary, 11 out of
50 customers, that is, 22%, disagree that marketing of healthy foods are more advantageous
as compared to fast foods. The rest of the 13 customers, that is, 26% strongly disagree that
marketing of healthy foods is more advantageous in comparison to healthy foods.
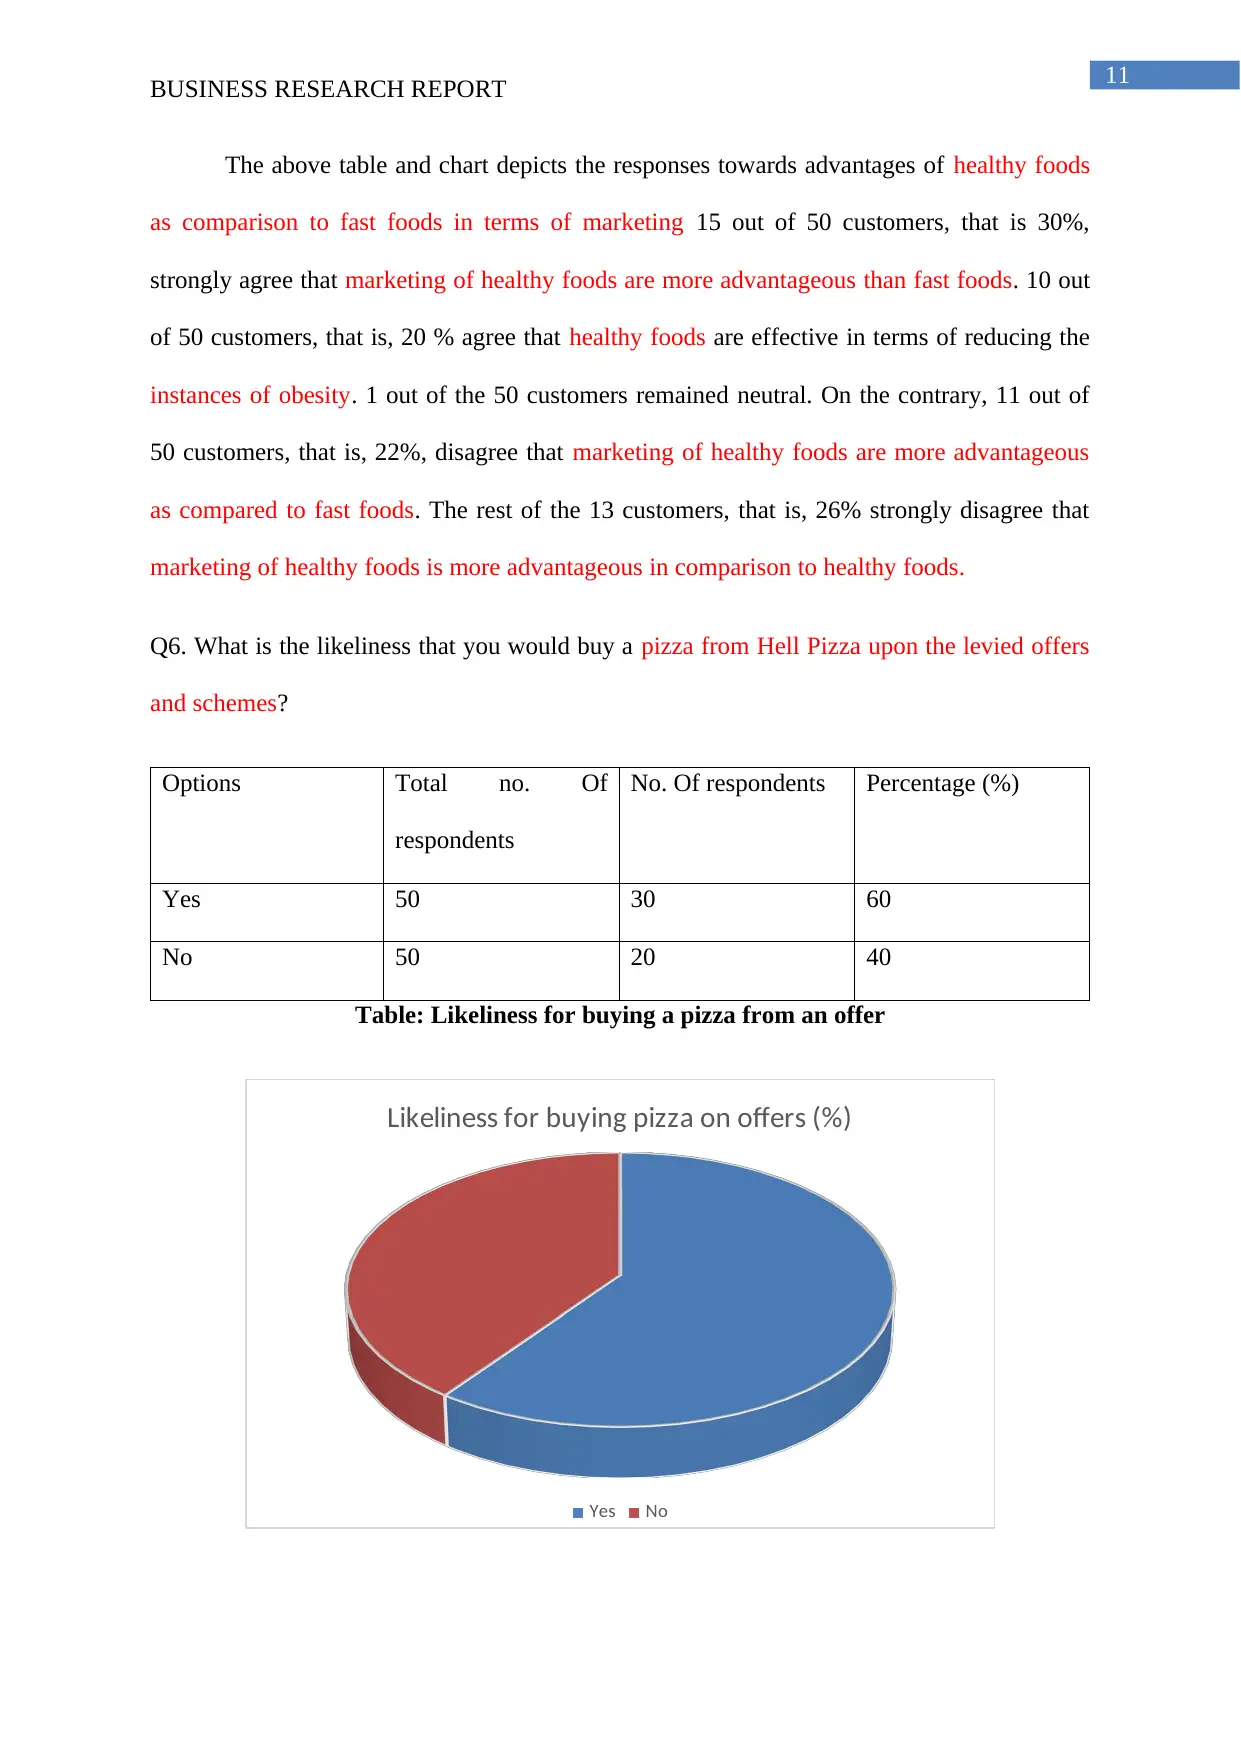
Q6. What is the likeliness that you would buy a pizza from Hell Pizza upon the levied offers
and schemes?
Options Total no. Of
respondents
No. Of respondents Percentage (%)
Yes 50 30 60
No 50 20 40
Table: Likeliness for buying a pizza from an offer
Likeliness for buying pizza on offers (%)
Yes No
BUSINESS RESEARCH REPORT
The above table and chart depicts the responses towards advantages of healthy foods
as comparison to fast foods in terms of marketing 15 out of 50 customers, that is 30%,
strongly agree that marketing of healthy foods are more advantageous than fast foods. 10 out
of 50 customers, that is, 20 % agree that healthy foods are effective in terms of reducing the
instances of obesity. 1 out of the 50 customers remained neutral. On the contrary, 11 out of
50 customers, that is, 22%, disagree that marketing of healthy foods are more advantageous
as compared to fast foods. The rest of the 13 customers, that is, 26% strongly disagree that
marketing of healthy foods is more advantageous in comparison to healthy foods.
Q6. What is the likeliness that you would buy a pizza from Hell Pizza upon the levied offers
and schemes?
Options Total no. Of
respondents
No. Of respondents Percentage (%)
Yes 50 30 60
No 50 20 40
Table: Likeliness for buying a pizza from an offer
Likeliness for buying pizza on offers (%)
Yes No
⊘ This is a preview!⊘
Do you want full access?
Subscribe today to unlock all pages.
Trusted by 1+ million students worldwide
1 out of 26
Related Documents


Your All-in-One AI-Powered Toolkit for Academic Success.
+13062052269
info@desklib.com
Available 24*7 on WhatsApp / Email
![[object Object]](/_next/static/media/star-bottom.7253800d.svg)
Unlock your academic potential
Copyright © 2020–2026 A2Z Services. All Rights Reserved. Developed and managed by ZUCOL.