Hewlett-Packard Financial Statement Analysis
VerifiedAdded on 2019/10/01
|14
|3235
|307
Report
AI Summary
This report provides a detailed financial analysis of Hewlett-Packard, encompassing sales analysis and an assessment of profitability. It explains key concepts like target profitability, lifetime value cash flow, variable costs, and fixed costs. The report includes calculations using sample and existing customer sales data to illustrate these concepts. Furthermore, it delves into the organization's management accounting procedures for handling various costs, evaluating their effectiveness, and providing a step-by-step analysis of customer account profitability for sustainable performance. The report also evaluates the value of each client, recommends strategies for client growth, assesses business and financial risks associated with each account, identifies key trends and variances, and discusses where to find relevant financial data both internally and externally. Finally, it outlines who within the organization has a stake in the financial performance of these accounts and how to ensure appropriate data access, provides proformas for capturing performance data, and develops contingency plans for potential financial problems.
Hewlett-Packard
Financial statement
Financial statement and sales analysis
Name of the author-
University Name-
[Type the abstract of the document here. The abstract is typically a short summary of the contents
of the document. Type the abstract of the document here. The abstract is typically a short
summary of the contents of the document.]
Paraphrase This Document
Need a fresh take? Get an instant paraphrase of this document with our AI Paraphraser
Table of Contents
Task 1:...................................................................................................................................................3
Training Workbook for Sales Team........................................................................................................3
An explanation of the following concepts..................................................................................3
Using 2 made up sales volume numbers (simple) and 2 existing customers’ sales volume numbers
calculate;............................................................................................................................................3
The below given table shows the sales volume numbers and 2 existing client’s sales volume
numbers calculation...........................................................................................................................4
Assessment of the variable cost and cost which could impact the profitability..........................5
A description of your organisation’s management accounting procedures for dealing with the
following costs;.................................................................................................................................6
An evaluation of these costs and why these methods are used...................................................6
Example which shows the step by step analysis of the customer account for the profitability and how
it could be used for the sustainable customer performance.................................................................6
Task 2:...................................................................................................................................................9
Preparation of the financial analysis of company..................................................................................9
Evaluating the value of each clients towards.............................................................................9
Recommendation for growing the number of these clients in business..............................................9
An evaluation of the business and financial risks associated with each account.................................10
An identification of any key trends or variances......................................................................11
Where you would expect to look for financial data on these accounts (inside and outside your
organisation)....................................................................................................................................11
An identification of who else in your organisation would have a stake in the financial viability
and performance of these accounts and how you would ensure appropriate access to the data.......12
A provision of any proformas for capturing performance and financial data about these
accounts and the development of contingency plans for possible problems that may arise with the
financial performance of the accounts.............................................................................................12
REFERENCES....................................................................................................................................13
Task 1:
Training Workbook for Sales Team
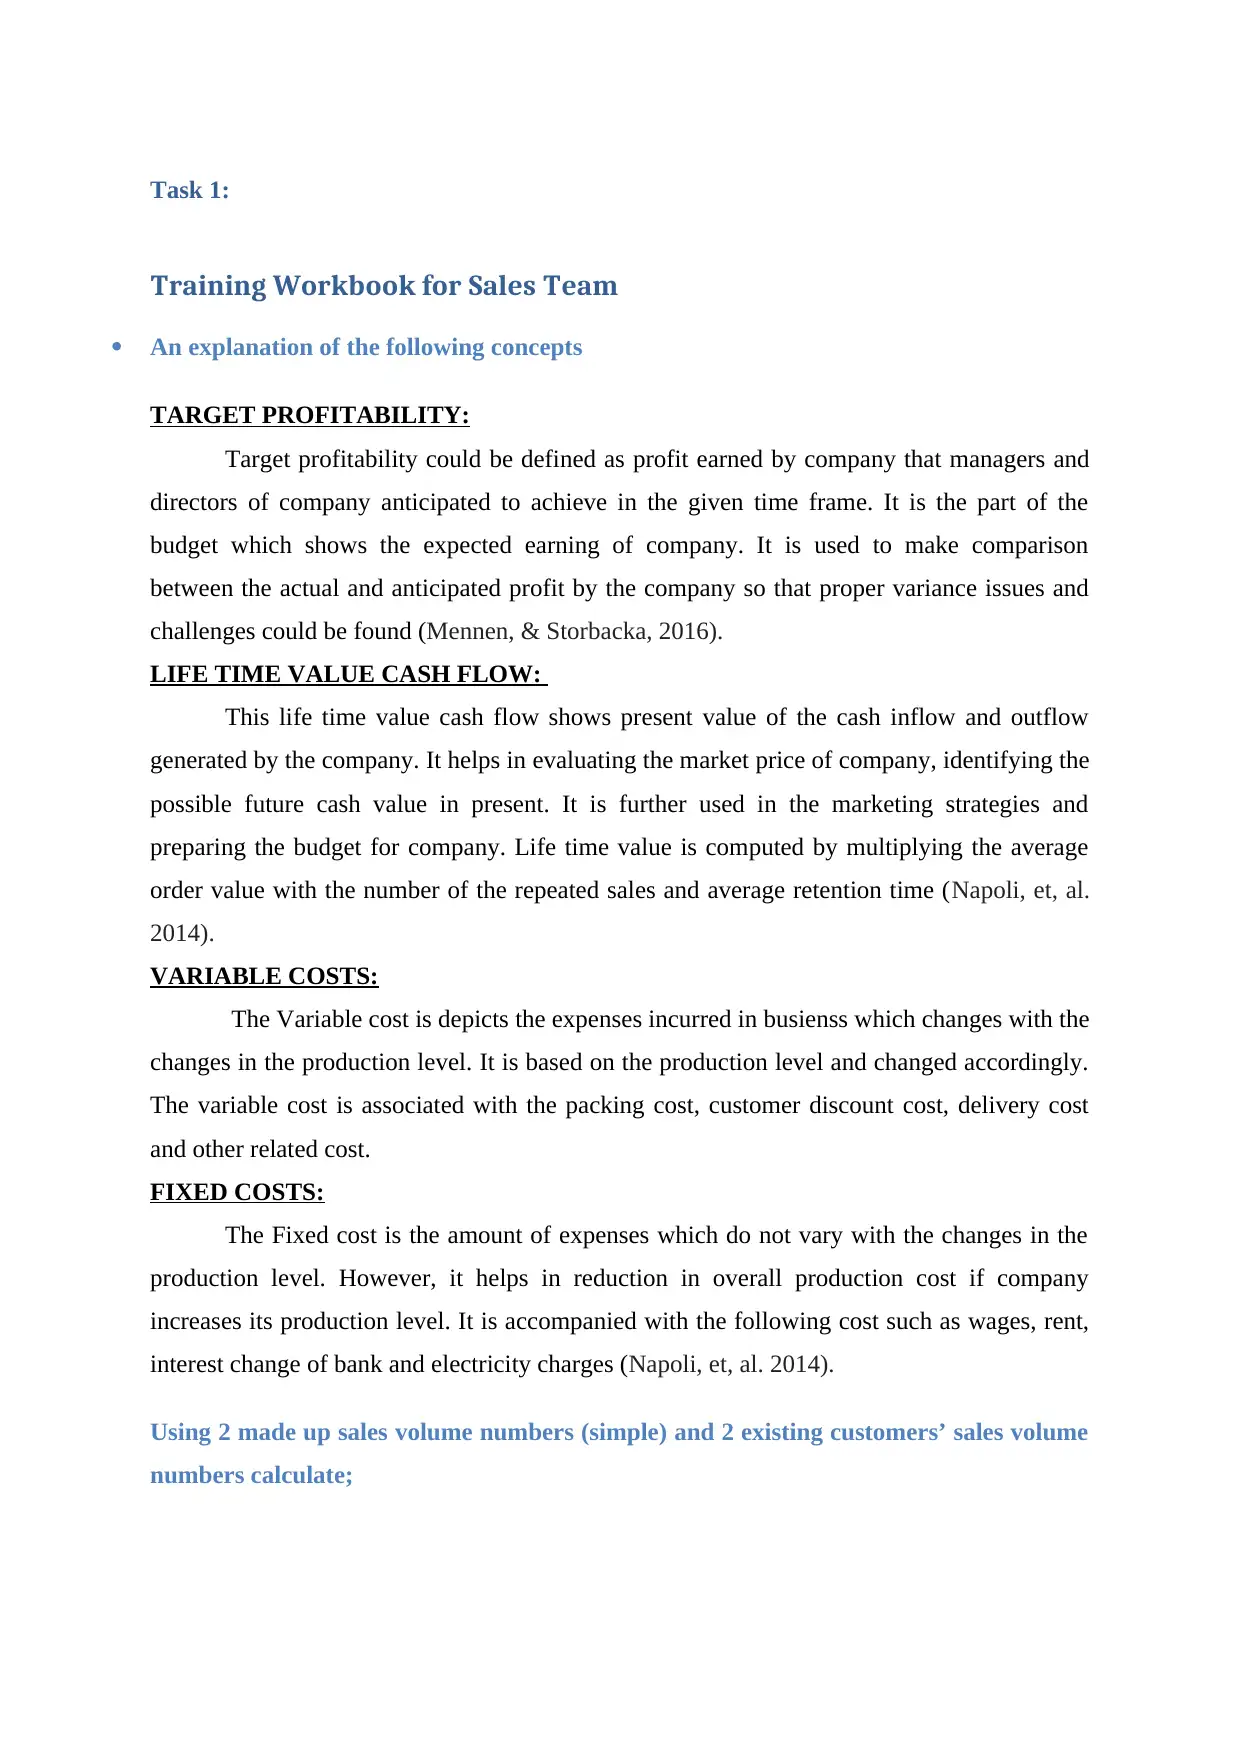
An explanation of the following concepts
TARGET PROFITABILITY:
Target profitability could be defined as profit earned by company that managers and
directors of company anticipated to achieve in the given time frame. It is the part of the
budget which shows the expected earning of company. It is used to make comparison
between the actual and anticipated profit by the company so that proper variance issues and
challenges could be found (Mennen, & Storbacka, 2016).
LIFE TIME VALUE CASH FLOW:
This life time value cash flow shows present value of the cash inflow and outflow
generated by the company. It helps in evaluating the market price of company, identifying the
possible future cash value in present. It is further used in the marketing strategies and
preparing the budget for company. Life time value is computed by multiplying the average
order value with the number of the repeated sales and average retention time (Napoli, et, al.
2014).
VARIABLE COSTS:
The Variable cost is depicts the expenses incurred in busienss which changes with the
changes in the production level. It is based on the production level and changed accordingly.
The variable cost is associated with the packing cost, customer discount cost, delivery cost
and other related cost.
FIXED COSTS:
The Fixed cost is the amount of expenses which do not vary with the changes in the
production level. However, it helps in reduction in overall production cost if company
increases its production level. It is accompanied with the following cost such as wages, rent,
interest change of bank and electricity charges (Napoli, et, al. 2014).
Using 2 made up sales volume numbers (simple) and 2 existing customers’ sales volume
numbers calculate;
Training Workbook for Sales Team
An explanation of the following concepts
TARGET PROFITABILITY:
Target profitability could be defined as profit earned by company that managers and
directors of company anticipated to achieve in the given time frame. It is the part of the
budget which shows the expected earning of company. It is used to make comparison
between the actual and anticipated profit by the company so that proper variance issues and
challenges could be found (Mennen, & Storbacka, 2016).
LIFE TIME VALUE CASH FLOW:
This life time value cash flow shows present value of the cash inflow and outflow
generated by the company. It helps in evaluating the market price of company, identifying the
possible future cash value in present. It is further used in the marketing strategies and
preparing the budget for company. Life time value is computed by multiplying the average
order value with the number of the repeated sales and average retention time (Napoli, et, al.
2014).
VARIABLE COSTS:
The Variable cost is depicts the expenses incurred in busienss which changes with the
changes in the production level. It is based on the production level and changed accordingly.
The variable cost is associated with the packing cost, customer discount cost, delivery cost
and other related cost.
FIXED COSTS:
The Fixed cost is the amount of expenses which do not vary with the changes in the
production level. However, it helps in reduction in overall production cost if company
increases its production level. It is accompanied with the following cost such as wages, rent,
interest change of bank and electricity charges (Napoli, et, al. 2014).
Using 2 made up sales volume numbers (simple) and 2 existing customers’ sales volume
numbers calculate;
⊘ This is a preview!⊘
Do you want full access?
Subscribe today to unlock all pages.
Trusted by 1+ million students worldwide
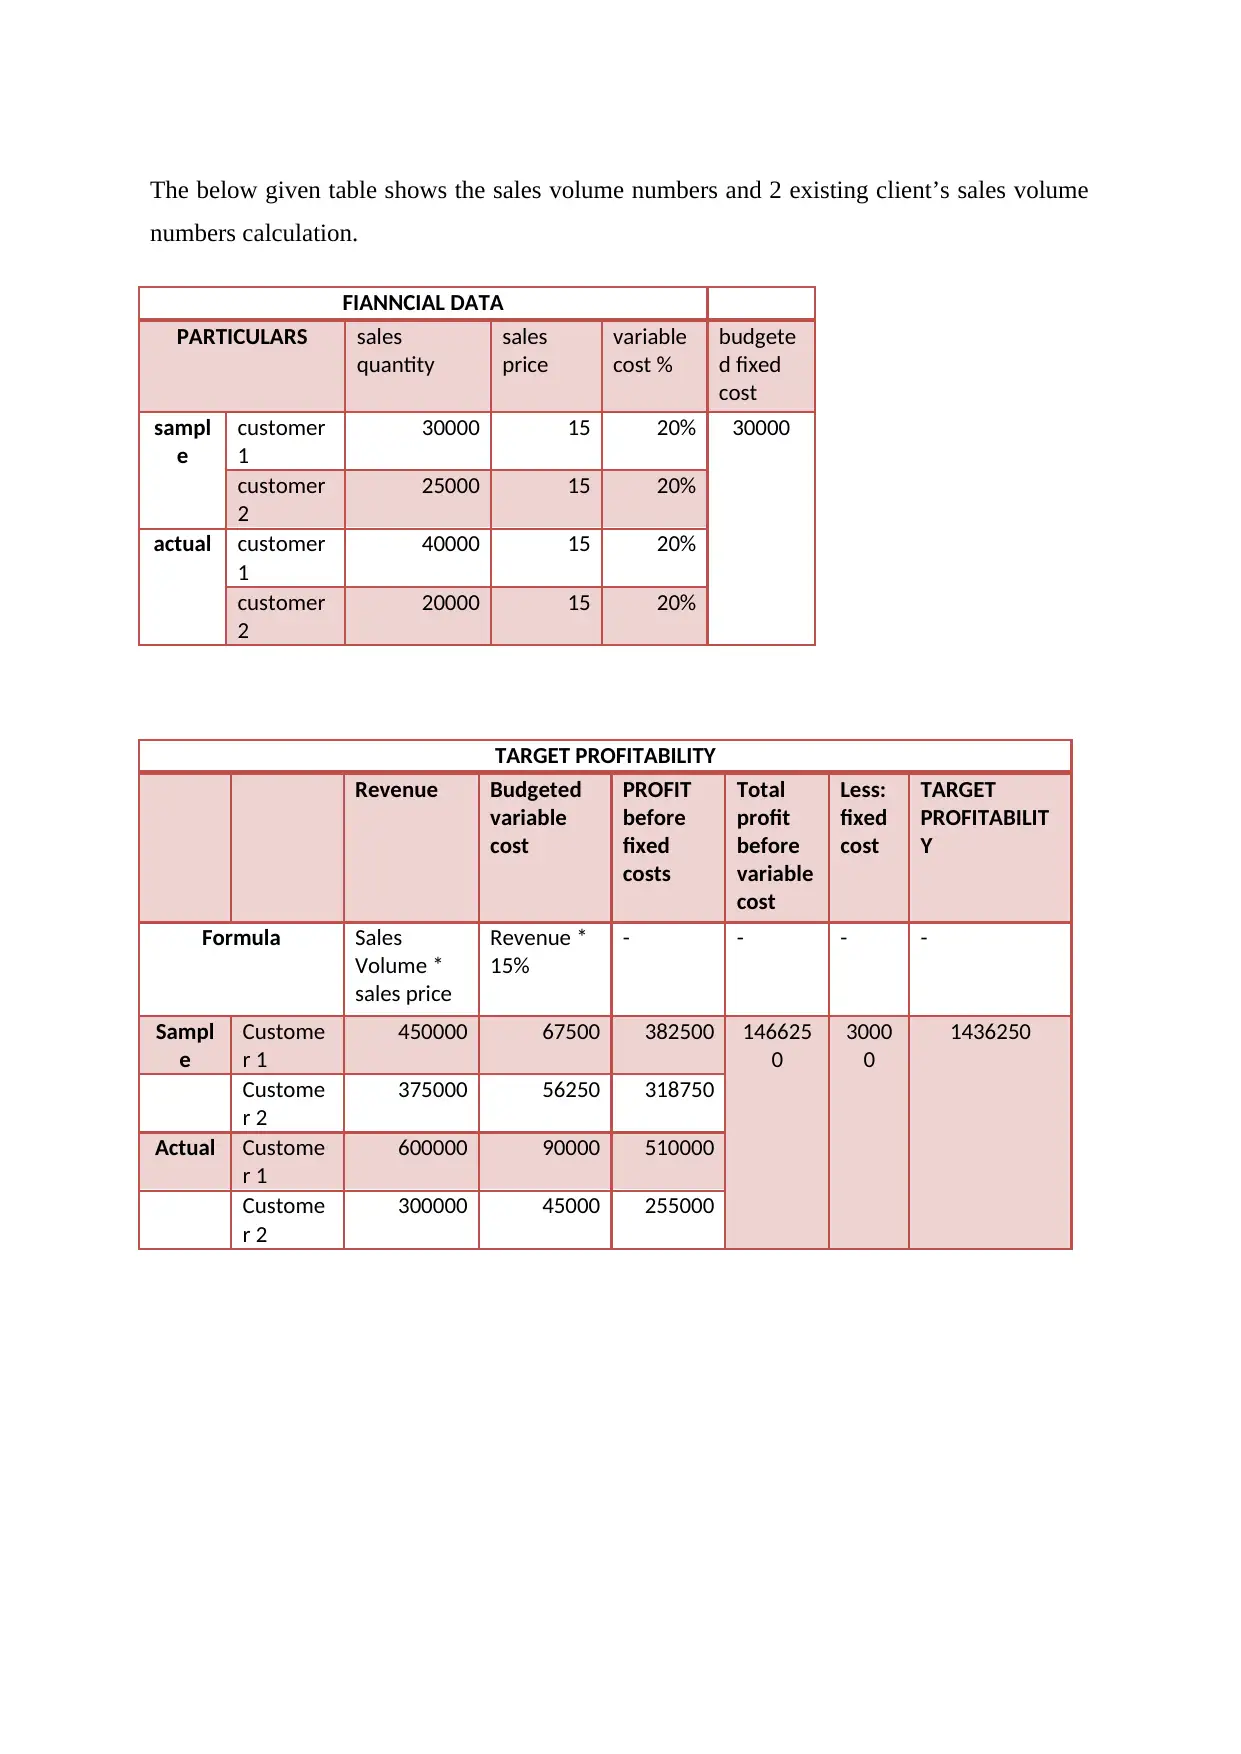
The below given table shows the sales volume numbers and 2 existing client’s sales volume
numbers calculation.
FIANNCIAL DATA
PARTICULARS sales
quantity
sales
price
variable
cost %
budgete
d fixed
cost
sampl
e
customer
1
30000 15 20% 30000
customer
2
25000 15 20%
actual customer
1
40000 15 20%
customer
2
20000 15 20%
TARGET PROFITABILITY
Revenue Budgeted
variable
cost
PROFIT
before
fixed
costs
Total
profit
before
variable
cost
Less:
fixed
cost
TARGET
PROFITABILIT
Y
Formula Sales
Volume *
sales price
Revenue *
15%
- - - -
Sampl
e
Custome
r 1
450000 67500 382500 146625
0
3000
0
1436250
Custome
r 2
375000 56250 318750
Actual Custome
r 1
600000 90000 510000
Custome
r 2
300000 45000 255000
Paraphrase This Document
Need a fresh take? Get an instant paraphrase of this document with our AI Paraphraser
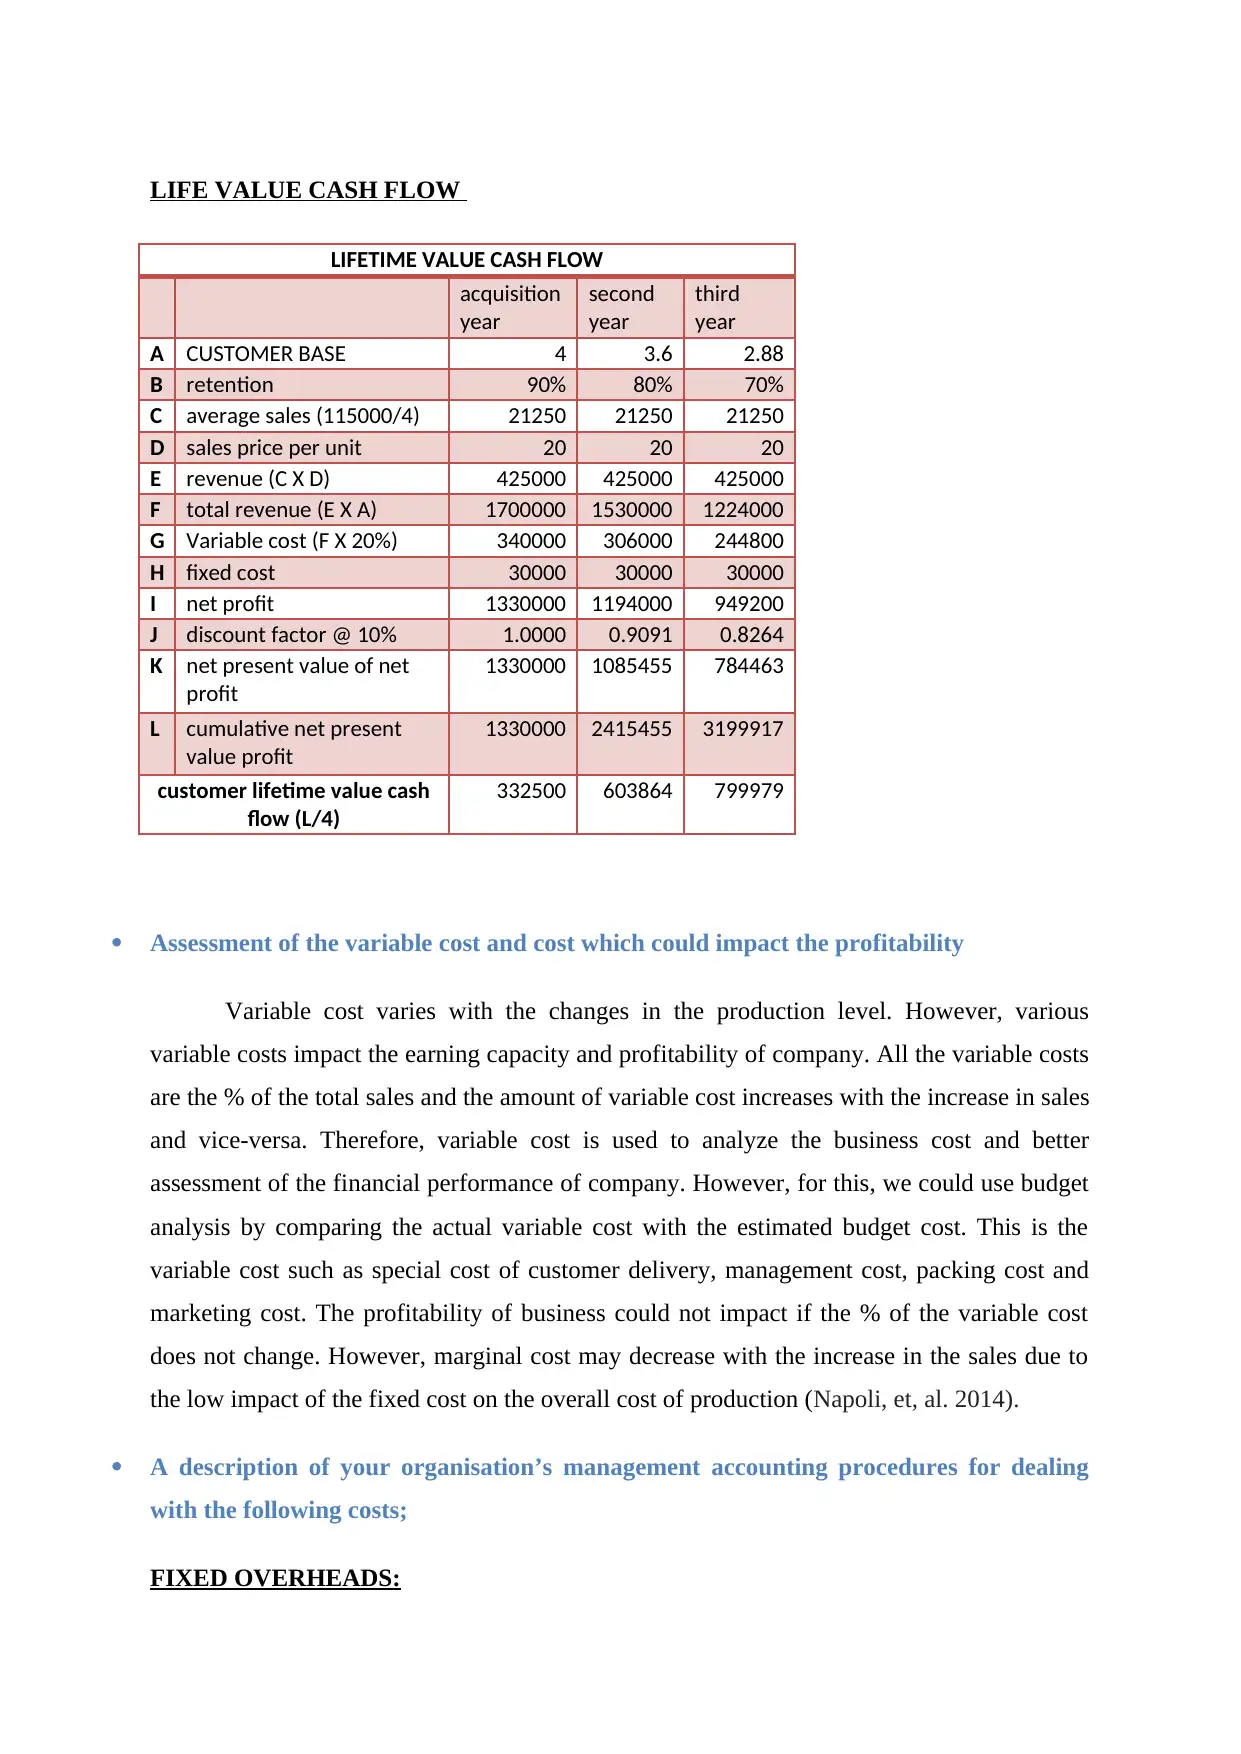
LIFE VALUE CASH FLOW
LIFETIME VALUE CASH FLOW
acquisition
year
second
year
third
year
A CUSTOMER BASE 4 3.6 2.88
B retention 90% 80% 70%
C average sales (115000/4) 21250 21250 21250
D sales price per unit 20 20 20
E revenue (C X D) 425000 425000 425000
F total revenue (E X A) 1700000 1530000 1224000
G Variable cost (F X 20%) 340000 306000 244800
H fixed cost 30000 30000 30000
I net profit 1330000 1194000 949200
J discount factor @ 10% 1.0000 0.9091 0.8264
K net present value of net
profit
1330000 1085455 784463
L cumulative net present
value profit
1330000 2415455 3199917
customer lifetime value cash
flow (L/4)
332500 603864 799979
Assessment of the variable cost and cost which could impact the profitability
Variable cost varies with the changes in the production level. However, various
variable costs impact the earning capacity and profitability of company. All the variable costs
are the % of the total sales and the amount of variable cost increases with the increase in sales
and vice-versa. Therefore, variable cost is used to analyze the business cost and better
assessment of the financial performance of company. However, for this, we could use budget
analysis by comparing the actual variable cost with the estimated budget cost. This is the
variable cost such as special cost of customer delivery, management cost, packing cost and
marketing cost. The profitability of business could not impact if the % of the variable cost
does not change. However, marginal cost may decrease with the increase in the sales due to
the low impact of the fixed cost on the overall cost of production (Napoli, et, al. 2014).
A description of your organisation’s management accounting procedures for dealing
with the following costs;
FIXED OVERHEADS:
It is analyzed that fixed cost is dealt by following absorption costing method. These fixed
closing are rend, electricity bill,bank interest and other charges which are fixed in nature and
absorbed on the basis of cost drivers. These costs are reduced from the contribution earned by
company to have net profit. Nonetheless, activity based costing are now a day’s used in place
of traditional costing method.
ADMINISTRATIVE SUPPORT:
The administrative support costing is fixed in nature and it does not vary with the he
administrative support costs are fixed in nature. These costs does not relate to individual
product but made expenses for the whole organization. It is analyzed that these costs are
incurred to manage all the work related to organization. However, absorption costing is used
to bifurcate the administration support costing allocation (Nenonen, & Storbacka, 2016).
An evaluation of these costs and why these methods are used
All these cost incurred in the business are highly imperative for the business and should be
lower down if company wants to sustain its business. If company could properly absorb these
costing in its related department by using the particular costing method then it will eventually
lower down the variance costing issues and related factors. In organization absorption of
these costing is done on the basis of their related cost drivers which may provide the related
cost for process (Yamey, 2017).
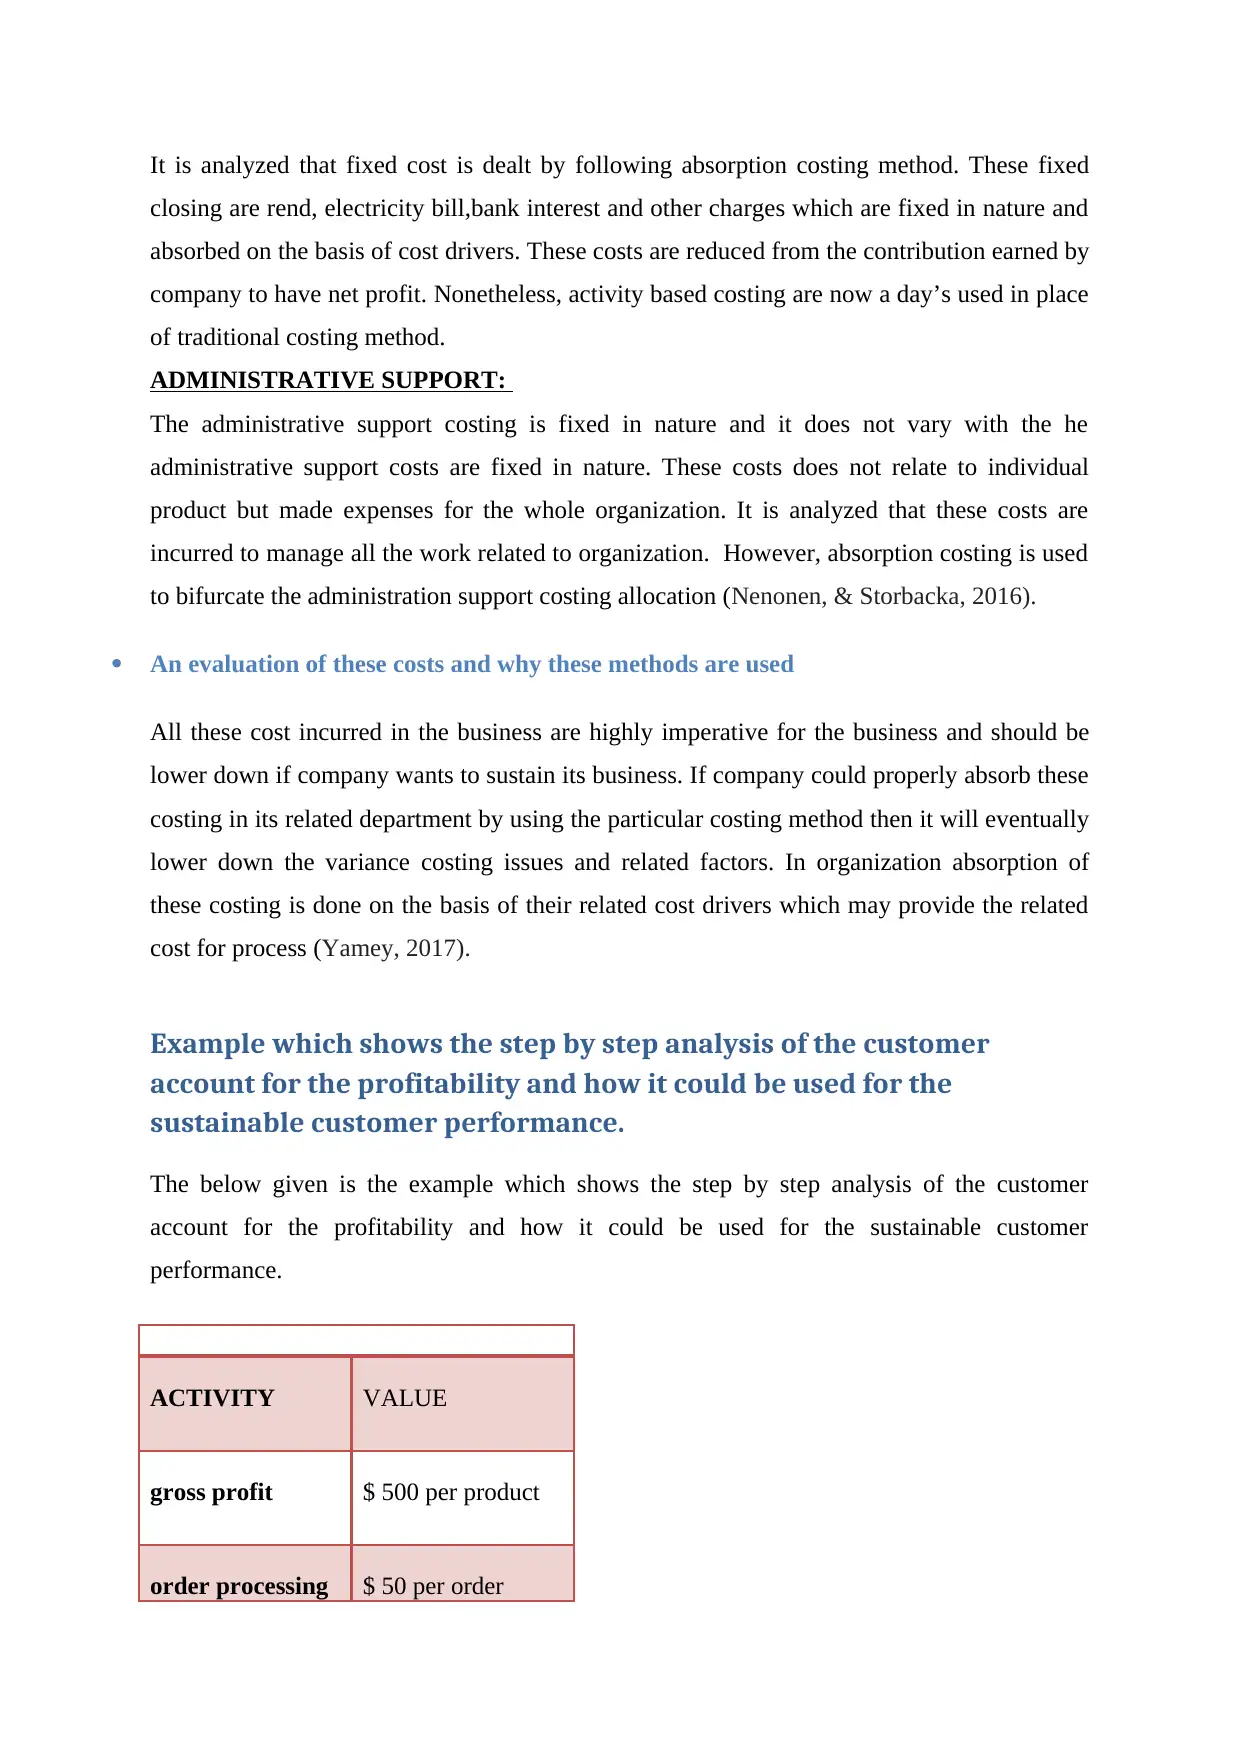
Example which shows the step by step analysis of the customer
account for the profitability and how it could be used for the
sustainable customer performance.
The below given is the example which shows the step by step analysis of the customer
account for the profitability and how it could be used for the sustainable customer
performance.
ACTIVITY VALUE
gross profit $ 500 per product
order processing $ 50 per order
closing are rend, electricity bill,bank interest and other charges which are fixed in nature and
absorbed on the basis of cost drivers. These costs are reduced from the contribution earned by
company to have net profit. Nonetheless, activity based costing are now a day’s used in place
of traditional costing method.
ADMINISTRATIVE SUPPORT:
The administrative support costing is fixed in nature and it does not vary with the he
administrative support costs are fixed in nature. These costs does not relate to individual
product but made expenses for the whole organization. It is analyzed that these costs are
incurred to manage all the work related to organization. However, absorption costing is used
to bifurcate the administration support costing allocation (Nenonen, & Storbacka, 2016).
An evaluation of these costs and why these methods are used
All these cost incurred in the business are highly imperative for the business and should be
lower down if company wants to sustain its business. If company could properly absorb these
costing in its related department by using the particular costing method then it will eventually
lower down the variance costing issues and related factors. In organization absorption of
these costing is done on the basis of their related cost drivers which may provide the related
cost for process (Yamey, 2017).
Example which shows the step by step analysis of the customer
account for the profitability and how it could be used for the
sustainable customer performance.
The below given is the example which shows the step by step analysis of the customer
account for the profitability and how it could be used for the sustainable customer
performance.
ACTIVITY VALUE
gross profit $ 500 per product
order processing $ 50 per order
⊘ This is a preview!⊘
Do you want full access?
Subscribe today to unlock all pages.
Trusted by 1+ million students worldwide
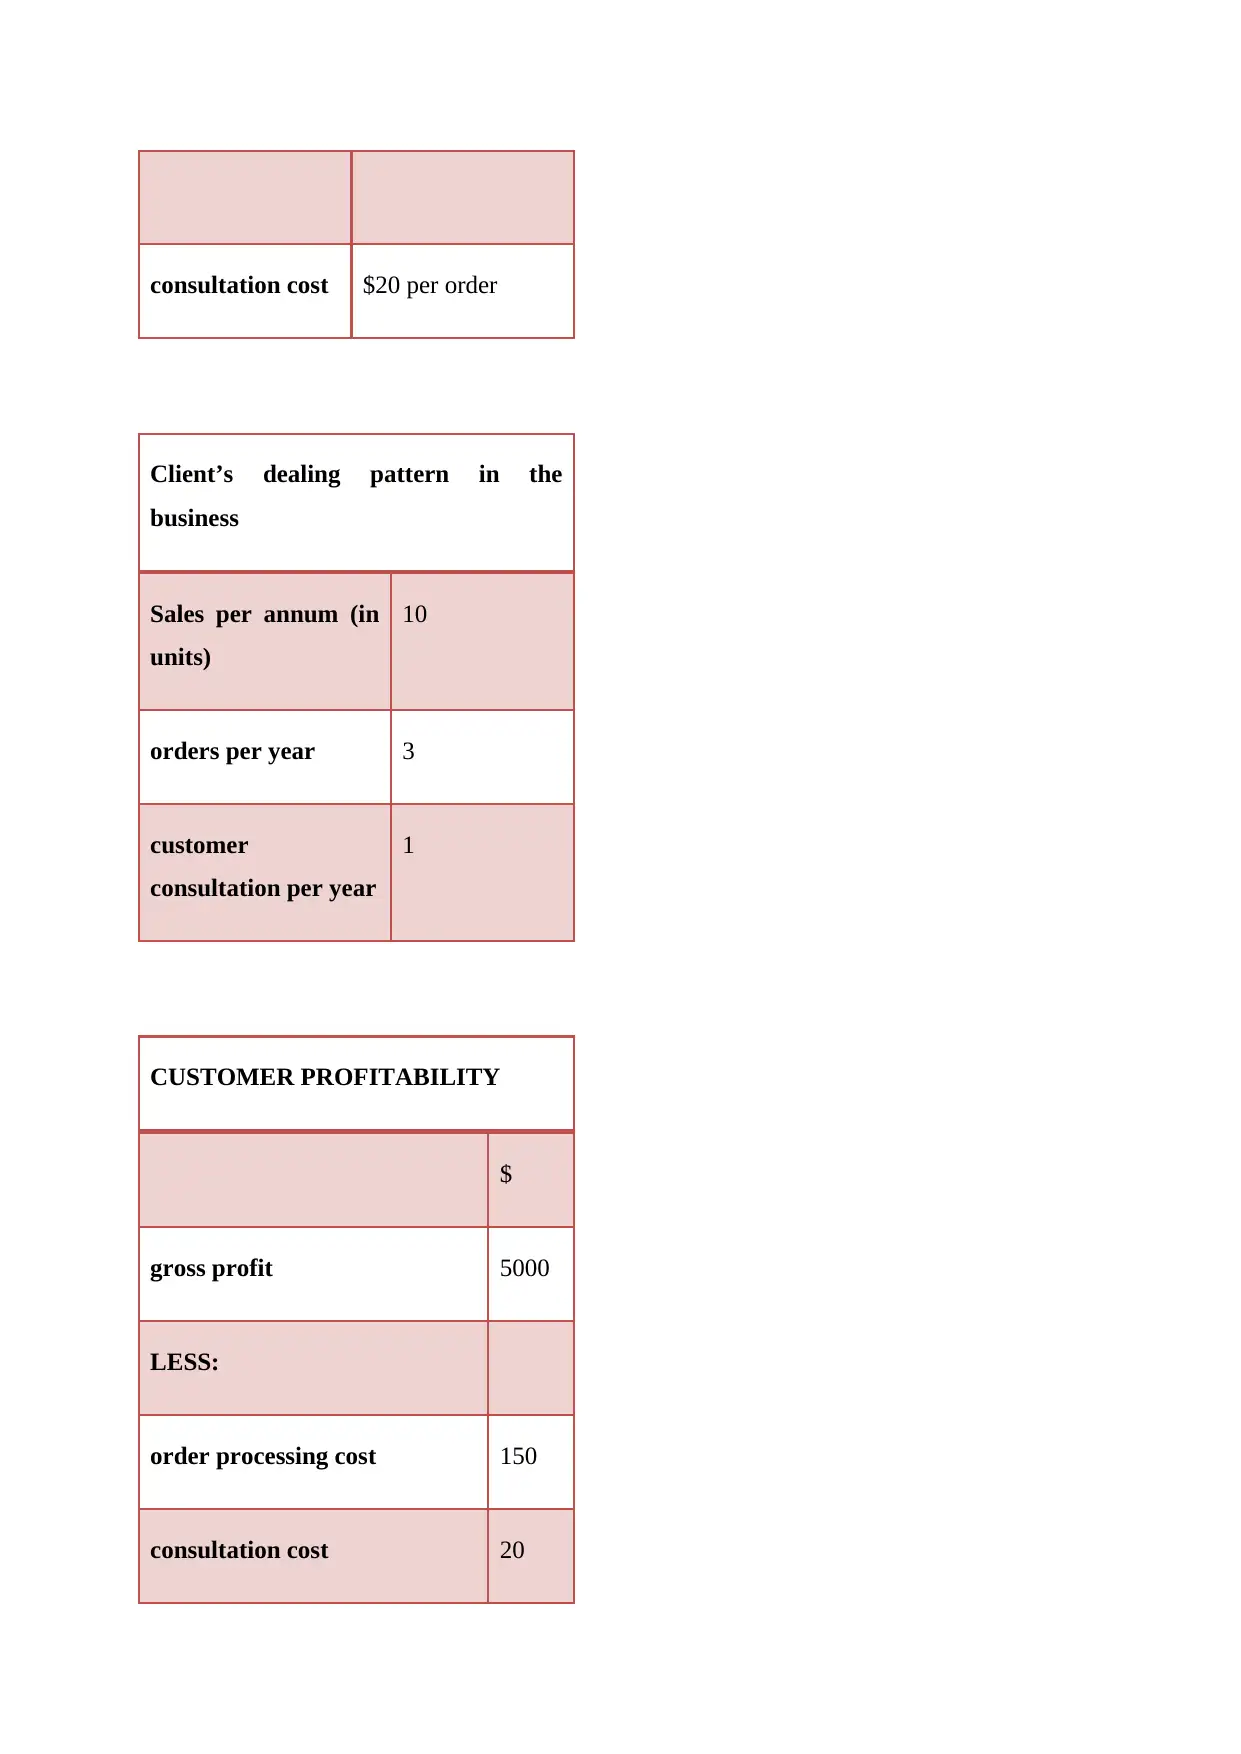
consultation cost $20 per order
Client’s dealing pattern in the
business
Sales per annum (in
units)
10
orders per year 3
customer
consultation per year
1
CUSTOMER PROFITABILITY
$
gross profit 5000
LESS:
order processing cost 150
consultation cost 20
Client’s dealing pattern in the
business
Sales per annum (in
units)
10
orders per year 3
customer
consultation per year
1
CUSTOMER PROFITABILITY
$
gross profit 5000
LESS:
order processing cost 150
consultation cost 20
Paraphrase This Document
Need a fresh take? Get an instant paraphrase of this document with our AI Paraphraser
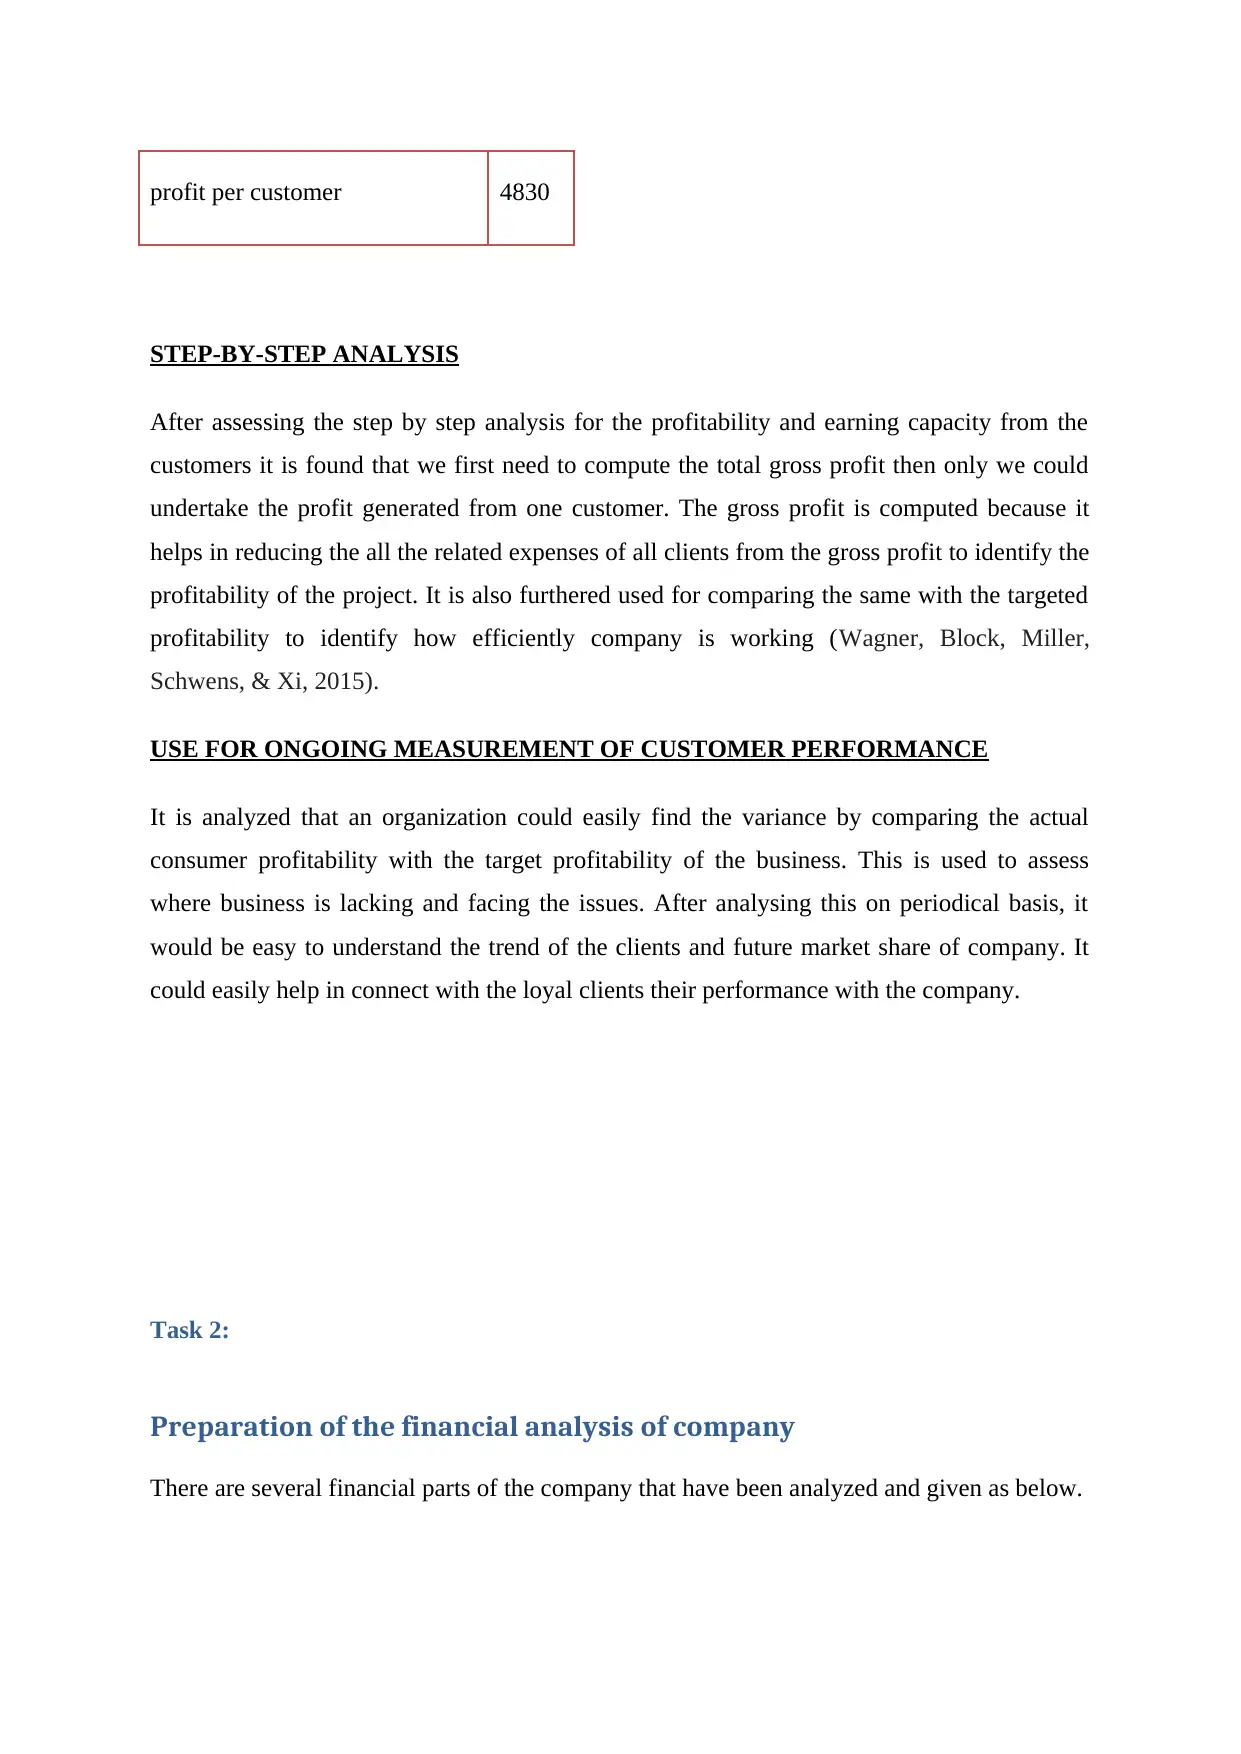
profit per customer 4830
STEP-BY-STEP ANALYSIS
After assessing the step by step analysis for the profitability and earning capacity from the
customers it is found that we first need to compute the total gross profit then only we could
undertake the profit generated from one customer. The gross profit is computed because it
helps in reducing the all the related expenses of all clients from the gross profit to identify the
profitability of the project. It is also furthered used for comparing the same with the targeted
profitability to identify how efficiently company is working (Wagner, Block, Miller,
Schwens, & Xi, 2015).
USE FOR ONGOING MEASUREMENT OF CUSTOMER PERFORMANCE
It is analyzed that an organization could easily find the variance by comparing the actual
consumer profitability with the target profitability of the business. This is used to assess
where business is lacking and facing the issues. After analysing this on periodical basis, it
would be easy to understand the trend of the clients and future market share of company. It
could easily help in connect with the loyal clients their performance with the company.
Task 2:
Preparation of the financial analysis of company
There are several financial parts of the company that have been analyzed and given as below.
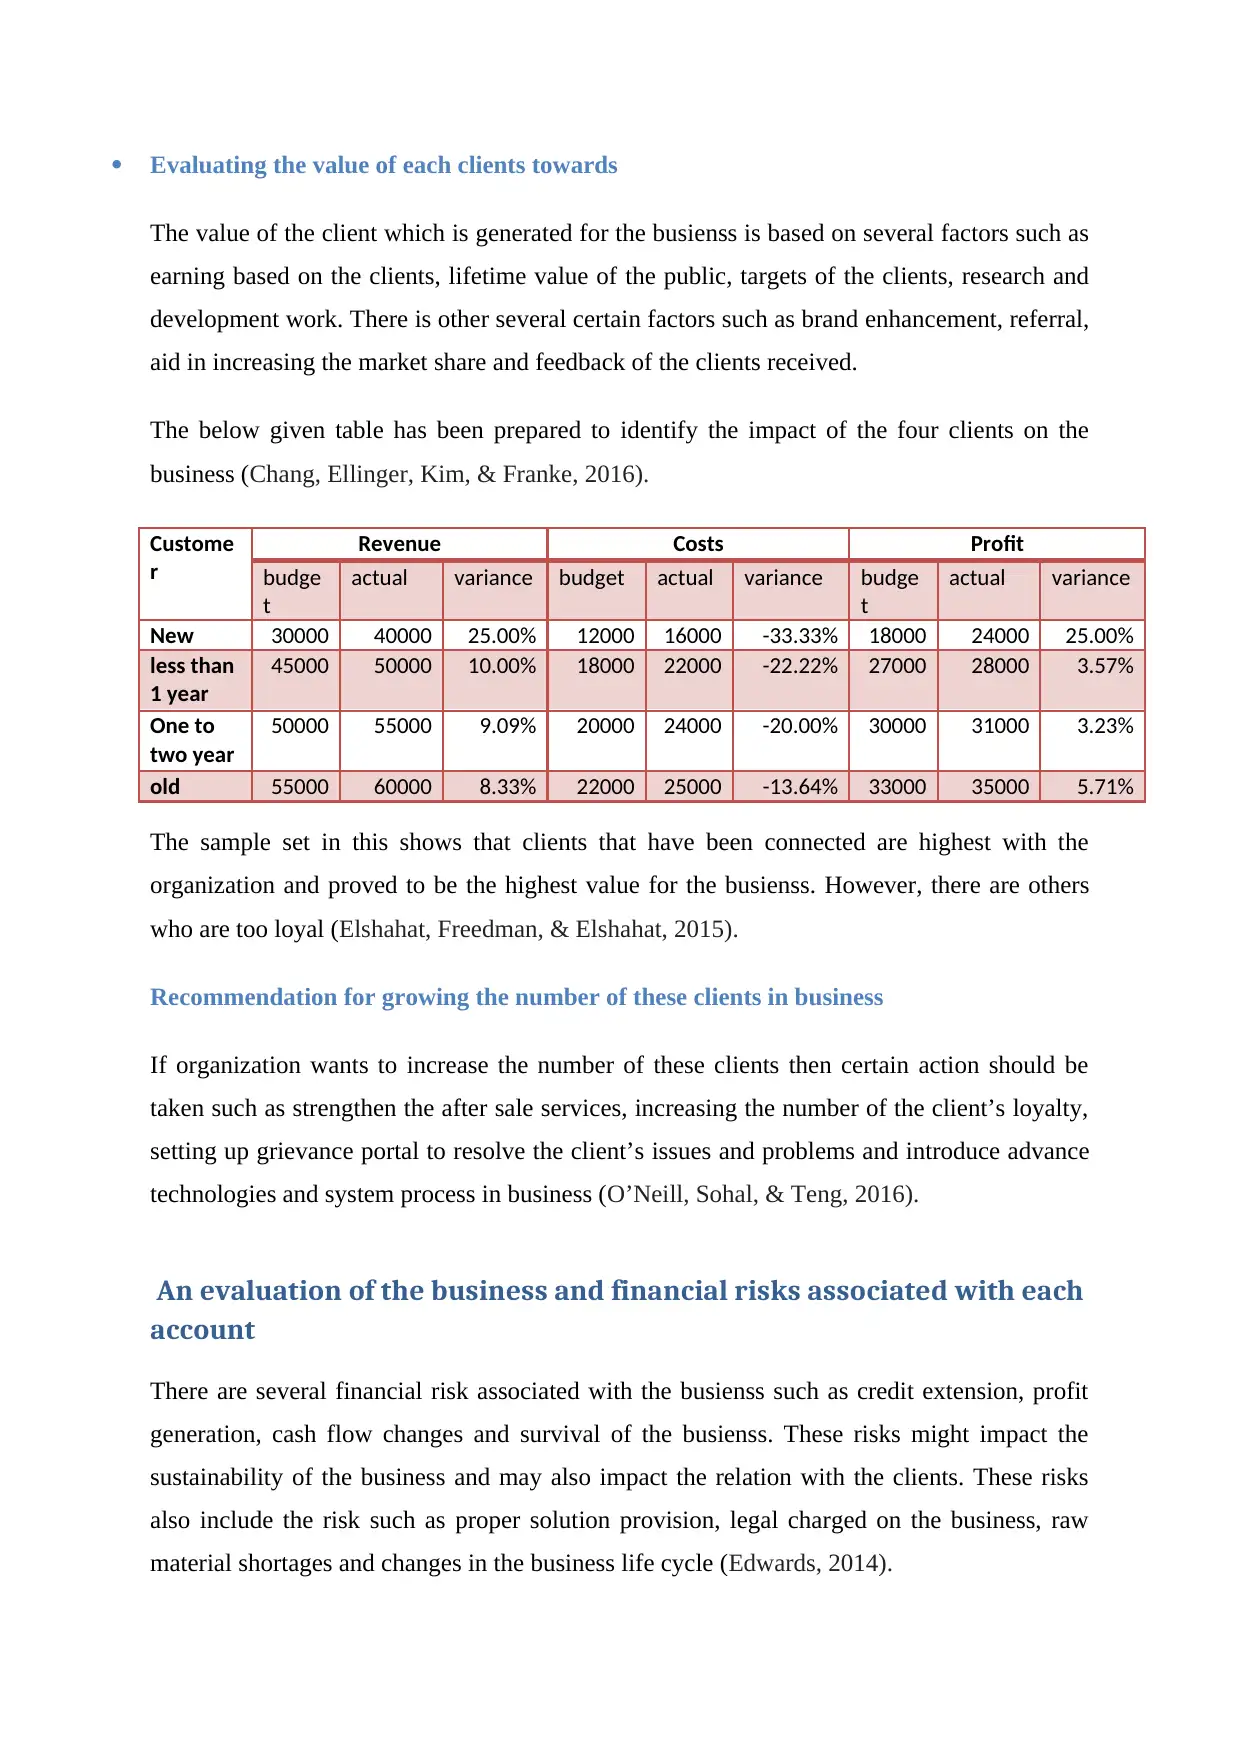
Evaluating the value of each clients towards
The value of the client which is generated for the busienss is based on several factors such as
earning based on the clients, lifetime value of the public, targets of the clients, research and
development work. There is other several certain factors such as brand enhancement, referral,
aid in increasing the market share and feedback of the clients received.
The below given table has been prepared to identify the impact of the four clients on the
business (Chang, Ellinger, Kim, & Franke, 2016).
Custome
r
Revenue Costs Profit
budge
t
actual variance budget actual variance budge
t
actual variance
New 30000 40000 25.00% 12000 16000 -33.33% 18000 24000 25.00%
less than
1 year
45000 50000 10.00% 18000 22000 -22.22% 27000 28000 3.57%
One to
two year
50000 55000 9.09% 20000 24000 -20.00% 30000 31000 3.23%
old 55000 60000 8.33% 22000 25000 -13.64% 33000 35000 5.71%
The sample set in this shows that clients that have been connected are highest with the
organization and proved to be the highest value for the busienss. However, there are others
who are too loyal (Elshahat, Freedman, & Elshahat, 2015).
Recommendation for growing the number of these clients in business
If organization wants to increase the number of these clients then certain action should be
taken such as strengthen the after sale services, increasing the number of the client’s loyalty,
setting up grievance portal to resolve the client’s issues and problems and introduce advance
technologies and system process in business (O’Neill, Sohal, & Teng, 2016).
An evaluation of the business and financial risks associated with each
account
There are several financial risk associated with the busienss such as credit extension, profit
generation, cash flow changes and survival of the busienss. These risks might impact the
sustainability of the business and may also impact the relation with the clients. These risks
also include the risk such as proper solution provision, legal charged on the business, raw
material shortages and changes in the business life cycle (Edwards, 2014).
⊘ This is a preview!⊘
Do you want full access?
Subscribe today to unlock all pages.
Trusted by 1+ million students worldwide
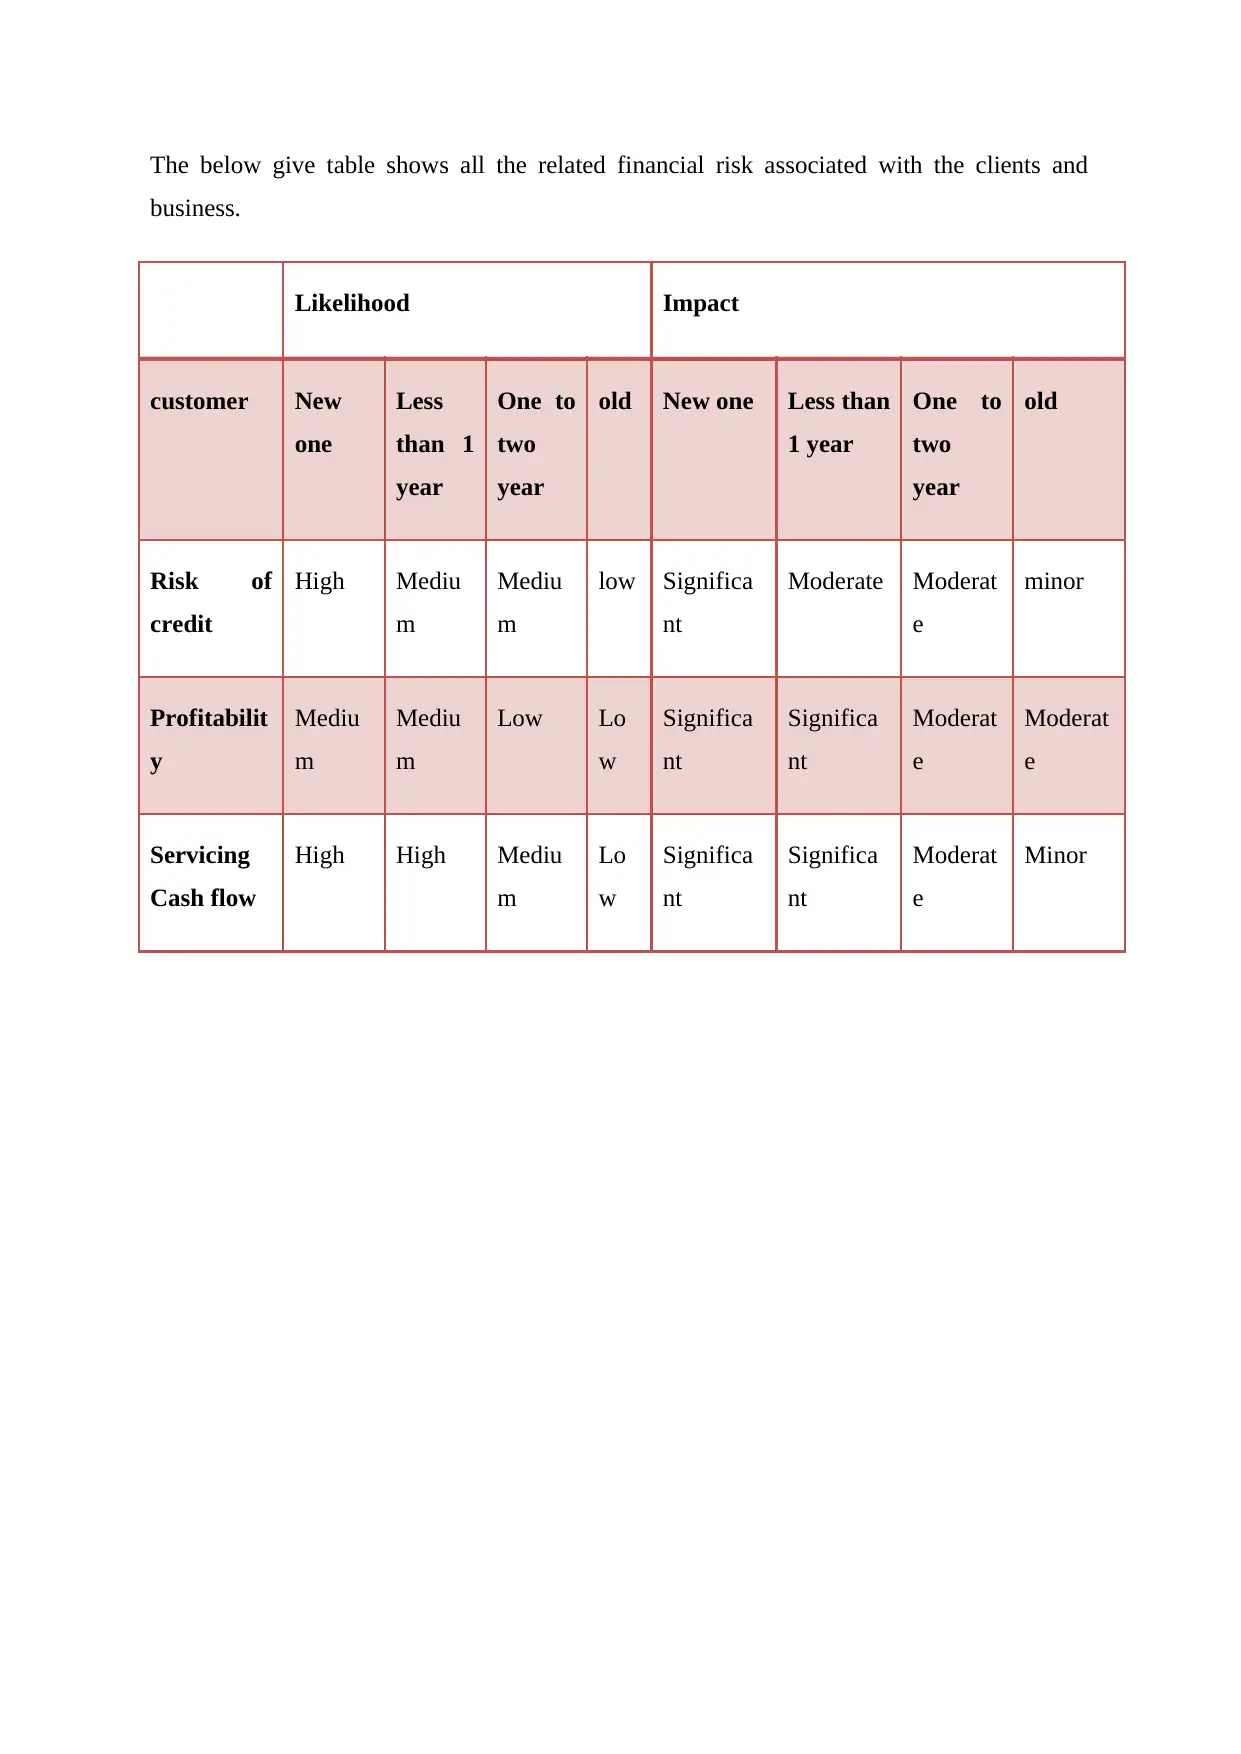
The below give table shows all the related financial risk associated with the clients and
business.
Likelihood Impact
customer New
one
Less
than 1
year
One to
two
year
old New one Less than
1 year
One to
two
year
old
Risk of
credit
High Mediu
m
Mediu
m
low Significa
nt
Moderate Moderat
e
minor
Profitabilit
y
Mediu
m
Mediu
m
Low Lo
w
Significa
nt
Significa
nt
Moderat
e
Moderat
e
Servicing
Cash flow
High High Mediu
m
Lo
w
Significa
nt
Significa
nt
Moderat
e
Minor
Paraphrase This Document
Need a fresh take? Get an instant paraphrase of this document with our AI Paraphraser
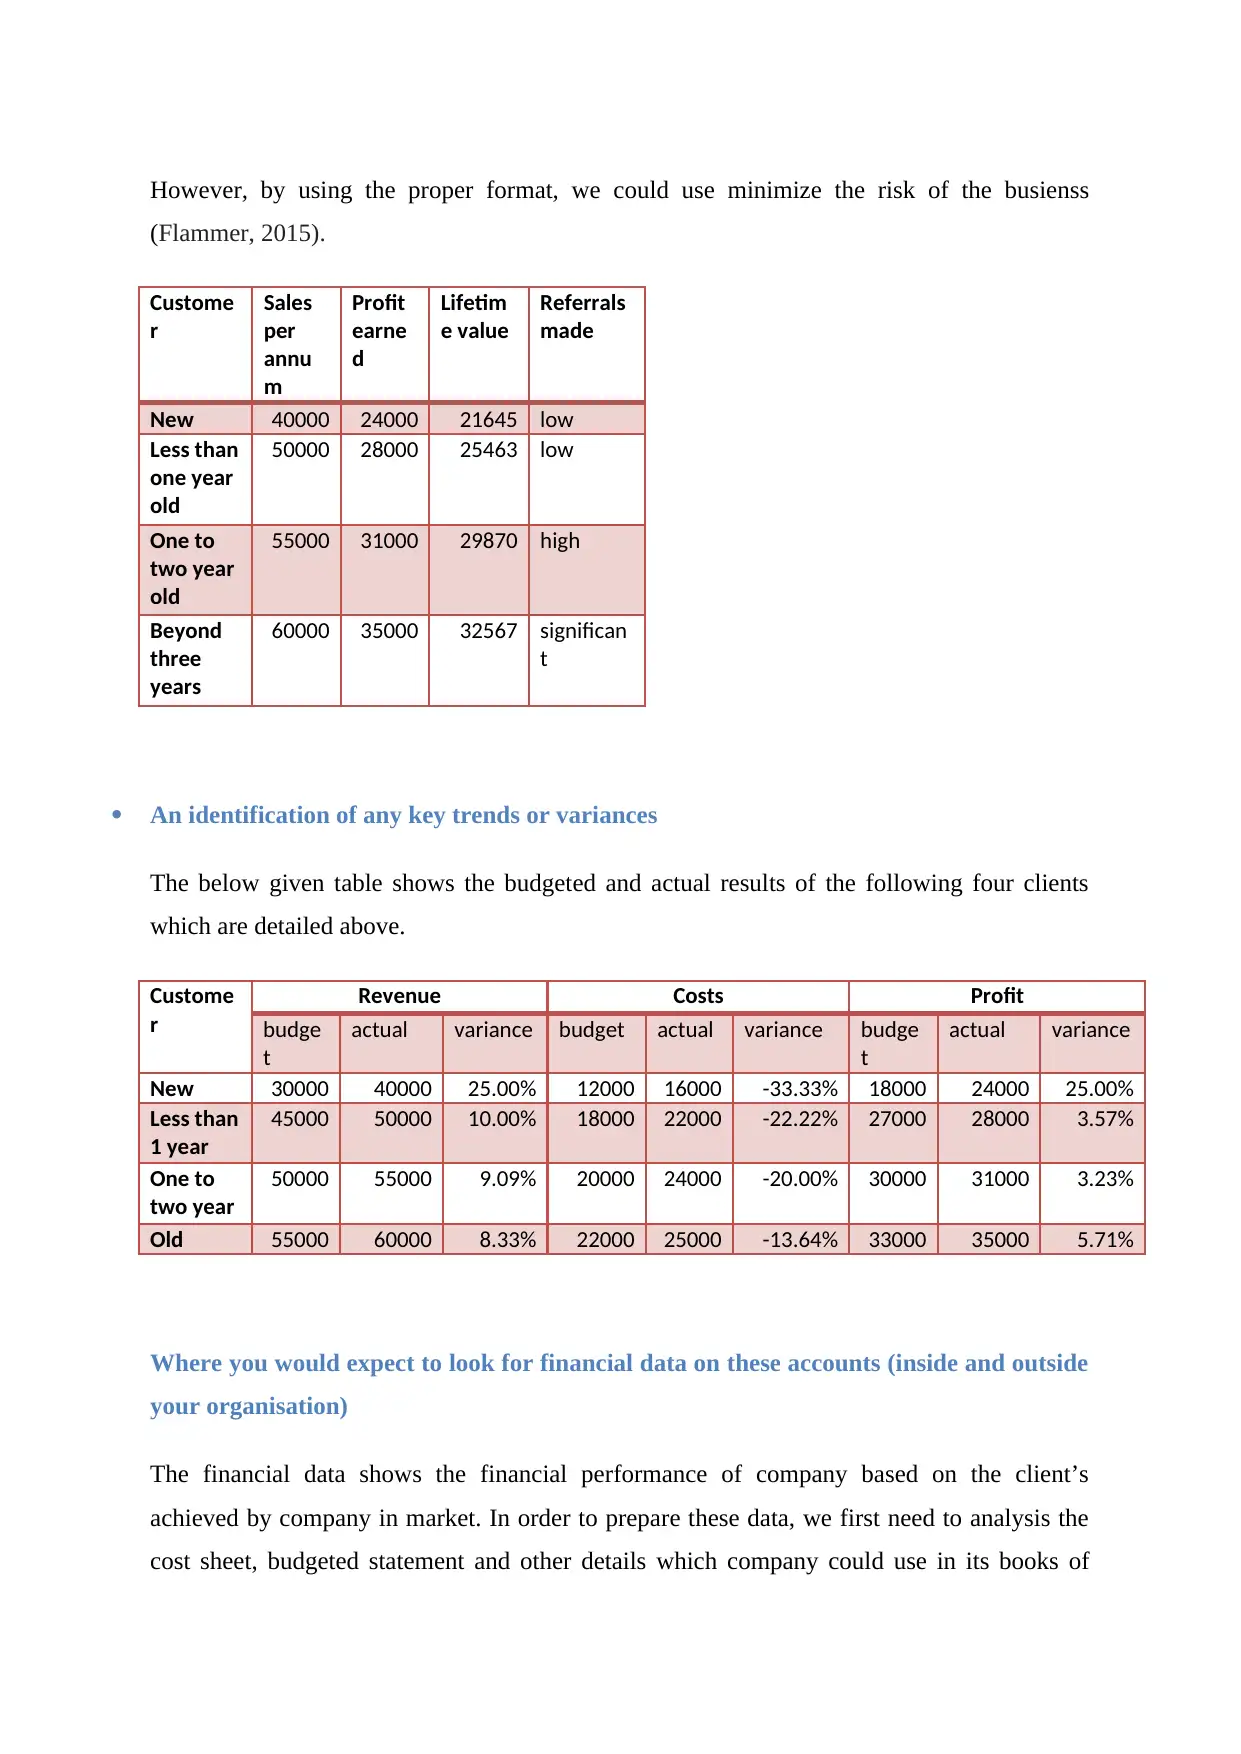
However, by using the proper format, we could use minimize the risk of the busienss
(Flammer, 2015).
Custome
r
Sales
per
annu
m
Profit
earne
d
Lifetim
e value
Referrals
made
New 40000 24000 21645 low
Less than
one year
old
50000 28000 25463 low
One to
two year
old
55000 31000 29870 high
Beyond
three
years
60000 35000 32567 significan
t
An identification of any key trends or variances
The below given table shows the budgeted and actual results of the following four clients
which are detailed above.
Custome
r
Revenue Costs Profit
budge
t
actual variance budget actual variance budge
t
actual variance
New 30000 40000 25.00% 12000 16000 -33.33% 18000 24000 25.00%
Less than
1 year
45000 50000 10.00% 18000 22000 -22.22% 27000 28000 3.57%
One to
two year
50000 55000 9.09% 20000 24000 -20.00% 30000 31000 3.23%
Old 55000 60000 8.33% 22000 25000 -13.64% 33000 35000 5.71%
Where you would expect to look for financial data on these accounts (inside and outside
your organisation)
The financial data shows the financial performance of company based on the client’s
achieved by company in market. In order to prepare these data, we first need to analysis the
cost sheet, budgeted statement and other details which company could use in its books of
accounts. In addition to this, loyalty card approach could also be used to strengthen the
financial data performance of company (Lu, Chau, Wang, & Pan, 2014).
An identification of who else in your organisation would have a stake in the financial
viability and performance of these accounts and how you would ensure appropriate
access to the data
In organization there are several people who has stake in organization such as senior sales
manager, clients, financial managers, department head managers and other person who have
stake in the financial viability and performance of company. Company should keep its data
more revealed to its stakeholder by focusing on harmonized reporting frameworks. Every
interested stakeholder should be disclosed relevant information. Company will hold proper
meeting to disclose the required information and strengthen its financial reporting
frameworks. E-mail and direct communication should be properly followed by company to
strengthen the proper disclosing financial performance of company (Qiu, Shaukat, &
Tharyan, 2016).
A provision of any proformas for capturing performance and financial data about these
accounts and the development of contingency plans for possible problems that may
arise with the financial performance of the accounts
There should be proper format in which all the required data must be properly recorded as per
the applicable rules and regulation of the corporate governance mechanism. There should be
proper contingency plans which must be prepared before holding meeting so that possible
problems and issues could be mitigated. Proper plans must be prepared based on the market
internal and external factors which will helps in strategic implication.
For instance, if the employee’s turnover of the company increases then company should
strengthen its hiring process to maintain the effective management (Abdel-Maksoud,
Cerbioni, Omran, & Ricceri, 2015).
⊘ This is a preview!⊘
Do you want full access?
Subscribe today to unlock all pages.
Trusted by 1+ million students worldwide
1 out of 14
Related Documents


Your All-in-One AI-Powered Toolkit for Academic Success.
+13062052269
info@desklib.com
Available 24*7 on WhatsApp / Email
![[object Object]](/_next/static/media/star-bottom.7253800d.svg)
Unlock your academic potential
Copyright © 2020–2026 A2Z Services. All Rights Reserved. Developed and managed by ZUCOL.