Financial Decision Making: A Report on Hi-Tech PLC Analysis
VerifiedAdded on 2021/06/15
|22
|4867
|43
Report
AI Summary
This report presents a comprehensive financial analysis of Hi-Tech PLC, a UK-based company in the computer hardware and accessories industry. The analysis is divided into two parts: the first part focuses on the company's business performance, examining its income statement and balance sheet through various financial ratios such as profitability, efficiency, liquidity, and gearing ratios. Cash flow and product line analyses are also included. The second part delves into investment appraisal techniques used to evaluate Hi-Tech PLC's expansion project, including management forecasts and methods like payback period, accounting rate of return, and net present value. The report also discusses sources of finance and non-financial factors influencing the company's decisions. The analysis reveals insights into Hi-Tech PLC's financial health, operational efficiency, and investment strategies.
RUNNING HEAD: FINANCIAL DECISION MAKING
financial analysis
Hi-Tech PLC
financial analysis
Hi-Tech PLC
Paraphrase This Document
Need a fresh take? Get an instant paraphrase of this document with our AI Paraphraser
Financial decision making 1
Executive summary
This report contains a brief financial analysis of Hi-Tech PLC, a company that operates in United
Kingdom and deals with the manufacturing of computer hardware and accessories. It was
founded in 1980 and is now a multi-national company in UK. The first part of the report deals
with the analysis of company’s income statement and balance sheet with help of some specific
ratios. In addition to this, cash flow analysis and production analysis is also done which reflects
the financial position of Hi-Tech in the market.
The second part of the report contains investment appraisal techniques used for evaluating the
expansion project of Hi-Tech PLC. A management forecast is been done and various appraisal
methods are been used. The methods include payback, accounting rate of return and net present
value method. Along with this, various sources of finance and non financial factors are also
discussed in the later part of the report. Overall, the report presents the business analysis and
investment analysis of Hi-Tech PLC and its expansion strategy.
Financial decision making 2
Contents
Part 1 Business Performance Analysis........................................................................................................4
Statement of profit and loss analysis...........................................................................................................4
Analysis of sales......................................................................................................................................4
Profitability ratios....................................................................................................................................4
Gross profit ratio..................................................................................................................................4
Net profit ratio.....................................................................................................................................5
Return on equity..................................................................................................................................6
Statement of financial position analysis......................................................................................................7
Efficiency ratios......................................................................................................................................7
Inventory turnover ratio.......................................................................................................................7
Inventory days.....................................................................................................................................7
Receivable turnover ratio.....................................................................................................................8
Receivable days...................................................................................................................................8
Creditor turnover ratio.........................................................................................................................9
Payables days....................................................................................................................................10
Asset turnover ratio...........................................................................................................................10
Liquidity ratios......................................................................................................................................11
Current ratio......................................................................................................................................11
Quick ratio.........................................................................................................................................12
Gearing ratios........................................................................................................................................12
Debt-to-equity ratio...........................................................................................................................12
Interest coverage ratio........................................................................................................................13
Statement of cash flow analysis.............................................................................................................14
Product Line Analysis...........................................................................................................................15
Part-2 Investment Appraisal......................................................................................................................16
Management forecast.............................................................................................................................16
⊘ This is a preview!⊘
Do you want full access?
Subscribe today to unlock all pages.
Trusted by 1+ million students worldwide
Financial decision making 3
Appraisal Techniques............................................................................................................................17
Payback period..................................................................................................................................17
Accounting rate of return...................................................................................................................17
Net Present Value..............................................................................................................................18
Sources of Finance................................................................................................................................18
Non-Financial factors............................................................................................................................19
References.................................................................................................................................................20
Paraphrase This Document
Need a fresh take? Get an instant paraphrase of this document with our AI Paraphraser
Financial decision making 4
Part 1 Business Performance Analysis
Statement of profit and loss analysis
Analysis of sales
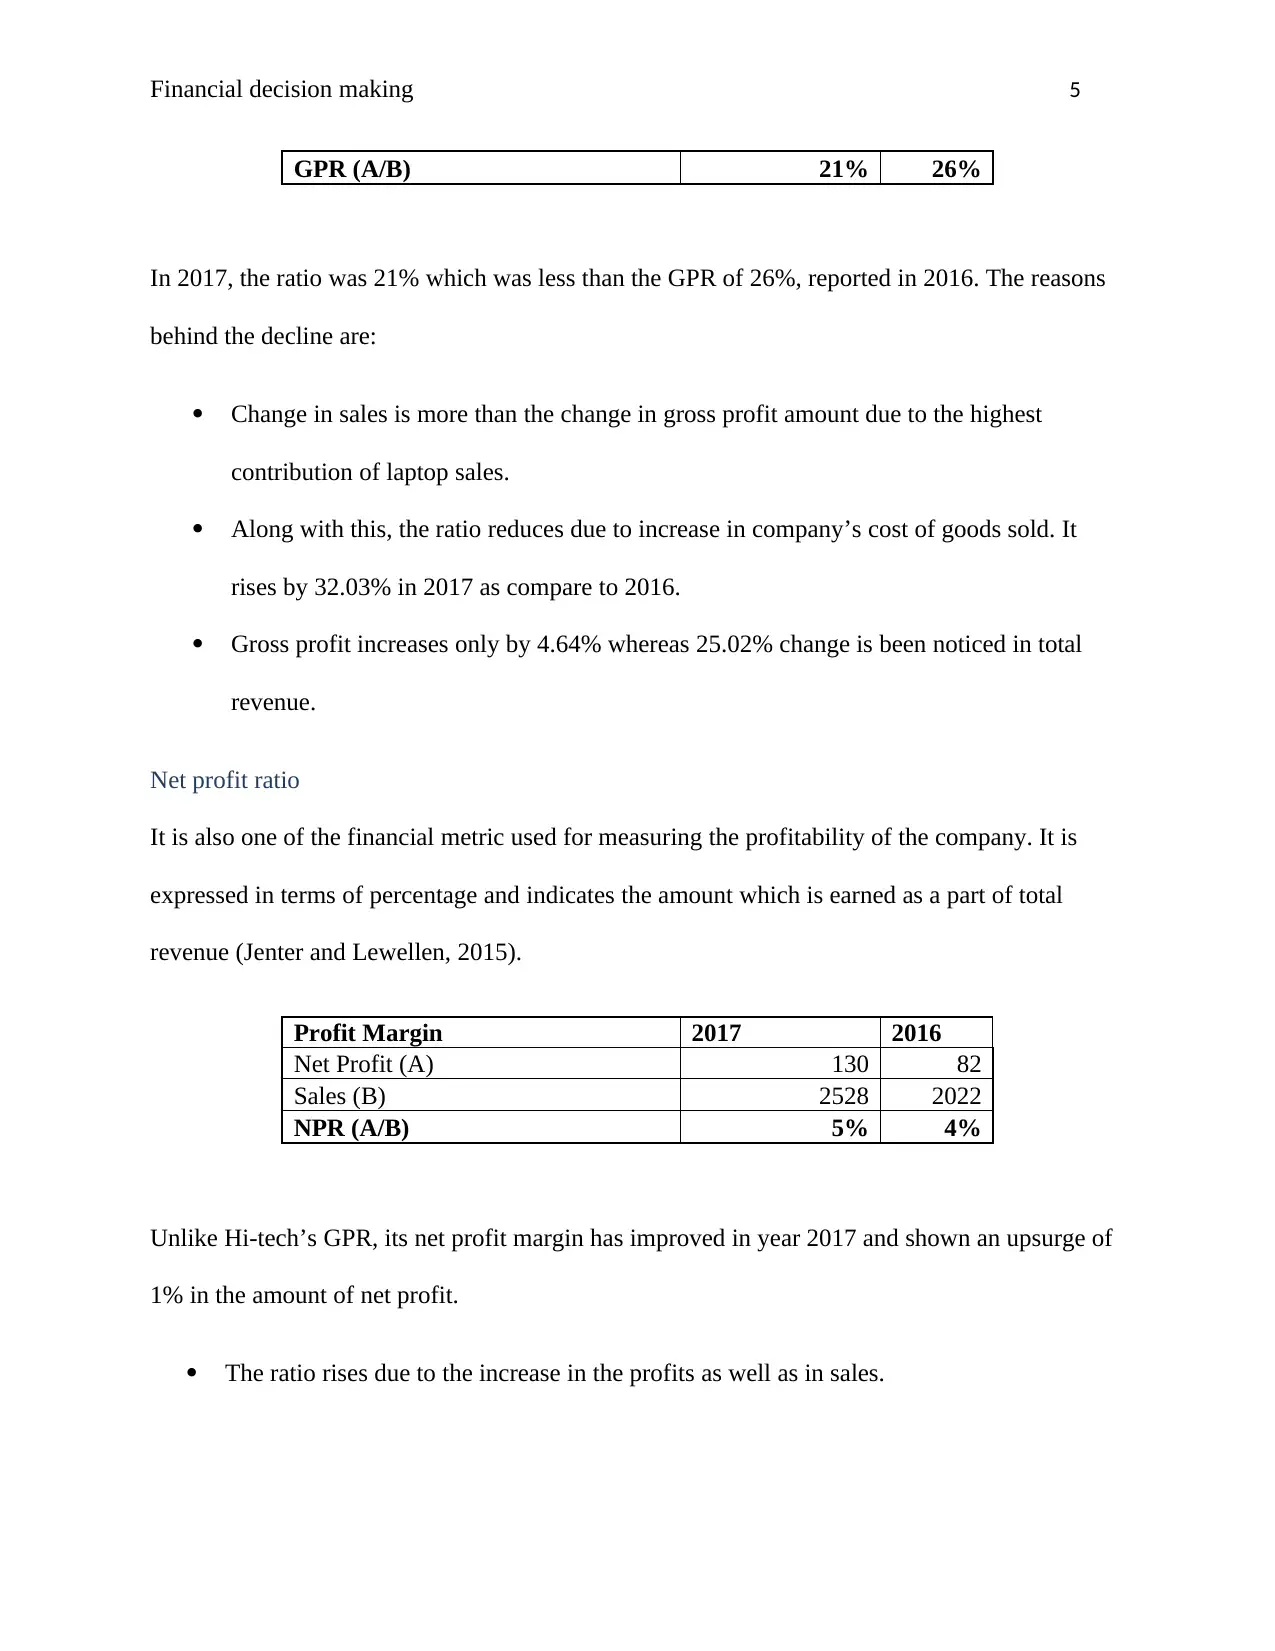
Looking at the revenue of Hi-Tech PLC, it is observed that total sales of the company increase
by 25.02% in 2017. Prior to this year, the amount was reported at £2022 million and it changed
to £2528 million in 2017. Reason behind such upsurge is the expansion plan of the company, in
which it has supplied new range of products in the market at the start of 2017. The core products
of the company are computers, laptop, tablet and other It devices. The sale of laptops makes the
highest contribution in the total revenue of Hi-Tech PLC. The sale of tablets has also increases
the company’s revenue as well as stimulates growth in business IT markets. It is expected that it
will become Hi-Tech’s main product by 2019.
From increased sales, it is reflected that company is performing better in its industry and is
focused on achieving its objectives as well as making profits.
Profitability ratios
Gross profit ratio
It is basically a financial metric used for assessing the financial health of a company. The amount
of gross profit is shown as a percentage of total sales, which is known as gross profit margin
(Vogel, 2014).
Gross Profit Margin 2017 2016
Gross Profit (A) 541 517
Sales (B) 2528 2022
Part 1 Business Performance Analysis
Statement of profit and loss analysis
Analysis of sales
Looking at the revenue of Hi-Tech PLC, it is observed that total sales of the company increase
by 25.02% in 2017. Prior to this year, the amount was reported at £2022 million and it changed
to £2528 million in 2017. Reason behind such upsurge is the expansion plan of the company, in
which it has supplied new range of products in the market at the start of 2017. The core products
of the company are computers, laptop, tablet and other It devices. The sale of laptops makes the
highest contribution in the total revenue of Hi-Tech PLC. The sale of tablets has also increases
the company’s revenue as well as stimulates growth in business IT markets. It is expected that it
will become Hi-Tech’s main product by 2019.
From increased sales, it is reflected that company is performing better in its industry and is
focused on achieving its objectives as well as making profits.
Profitability ratios
Gross profit ratio
It is basically a financial metric used for assessing the financial health of a company. The amount
of gross profit is shown as a percentage of total sales, which is known as gross profit margin
(Vogel, 2014).
Gross Profit Margin 2017 2016
Gross Profit (A) 541 517
Sales (B) 2528 2022
Financial decision making 5
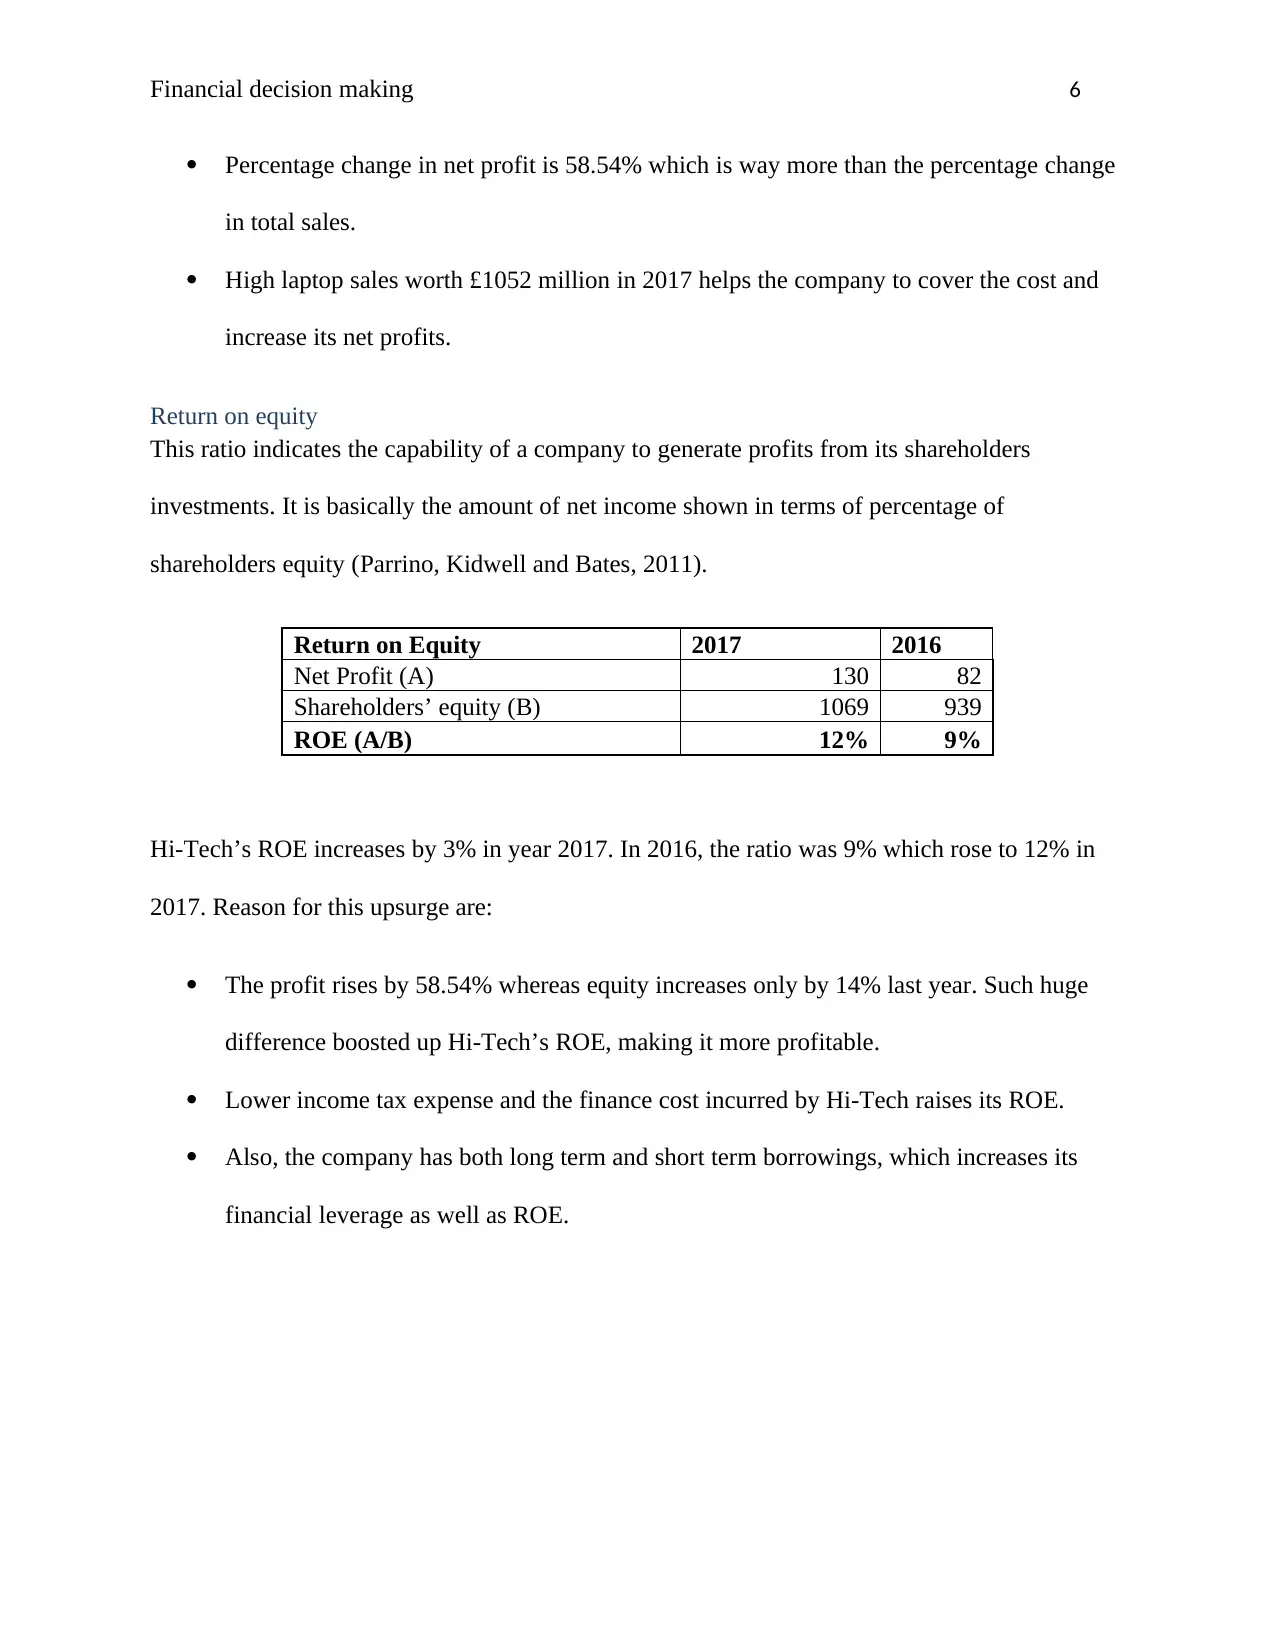
GPR (A/B) 21% 26%
In 2017, the ratio was 21% which was less than the GPR of 26%, reported in 2016. The reasons
behind the decline are:
Change in sales is more than the change in gross profit amount due to the highest
contribution of laptop sales.
Along with this, the ratio reduces due to increase in company’s cost of goods sold. It
rises by 32.03% in 2017 as compare to 2016.
Gross profit increases only by 4.64% whereas 25.02% change is been noticed in total
revenue.
Net profit ratio
It is also one of the financial metric used for measuring the profitability of the company. It is
expressed in terms of percentage and indicates the amount which is earned as a part of total
revenue (Jenter and Lewellen, 2015).
Profit Margin 2017 2016
Net Profit (A) 130 82
Sales (B) 2528 2022
NPR (A/B) 5% 4%
Unlike Hi-tech’s GPR, its net profit margin has improved in year 2017 and shown an upsurge of
1% in the amount of net profit.
The ratio rises due to the increase in the profits as well as in sales.
⊘ This is a preview!⊘
Do you want full access?
Subscribe today to unlock all pages.
Trusted by 1+ million students worldwide
Financial decision making 6
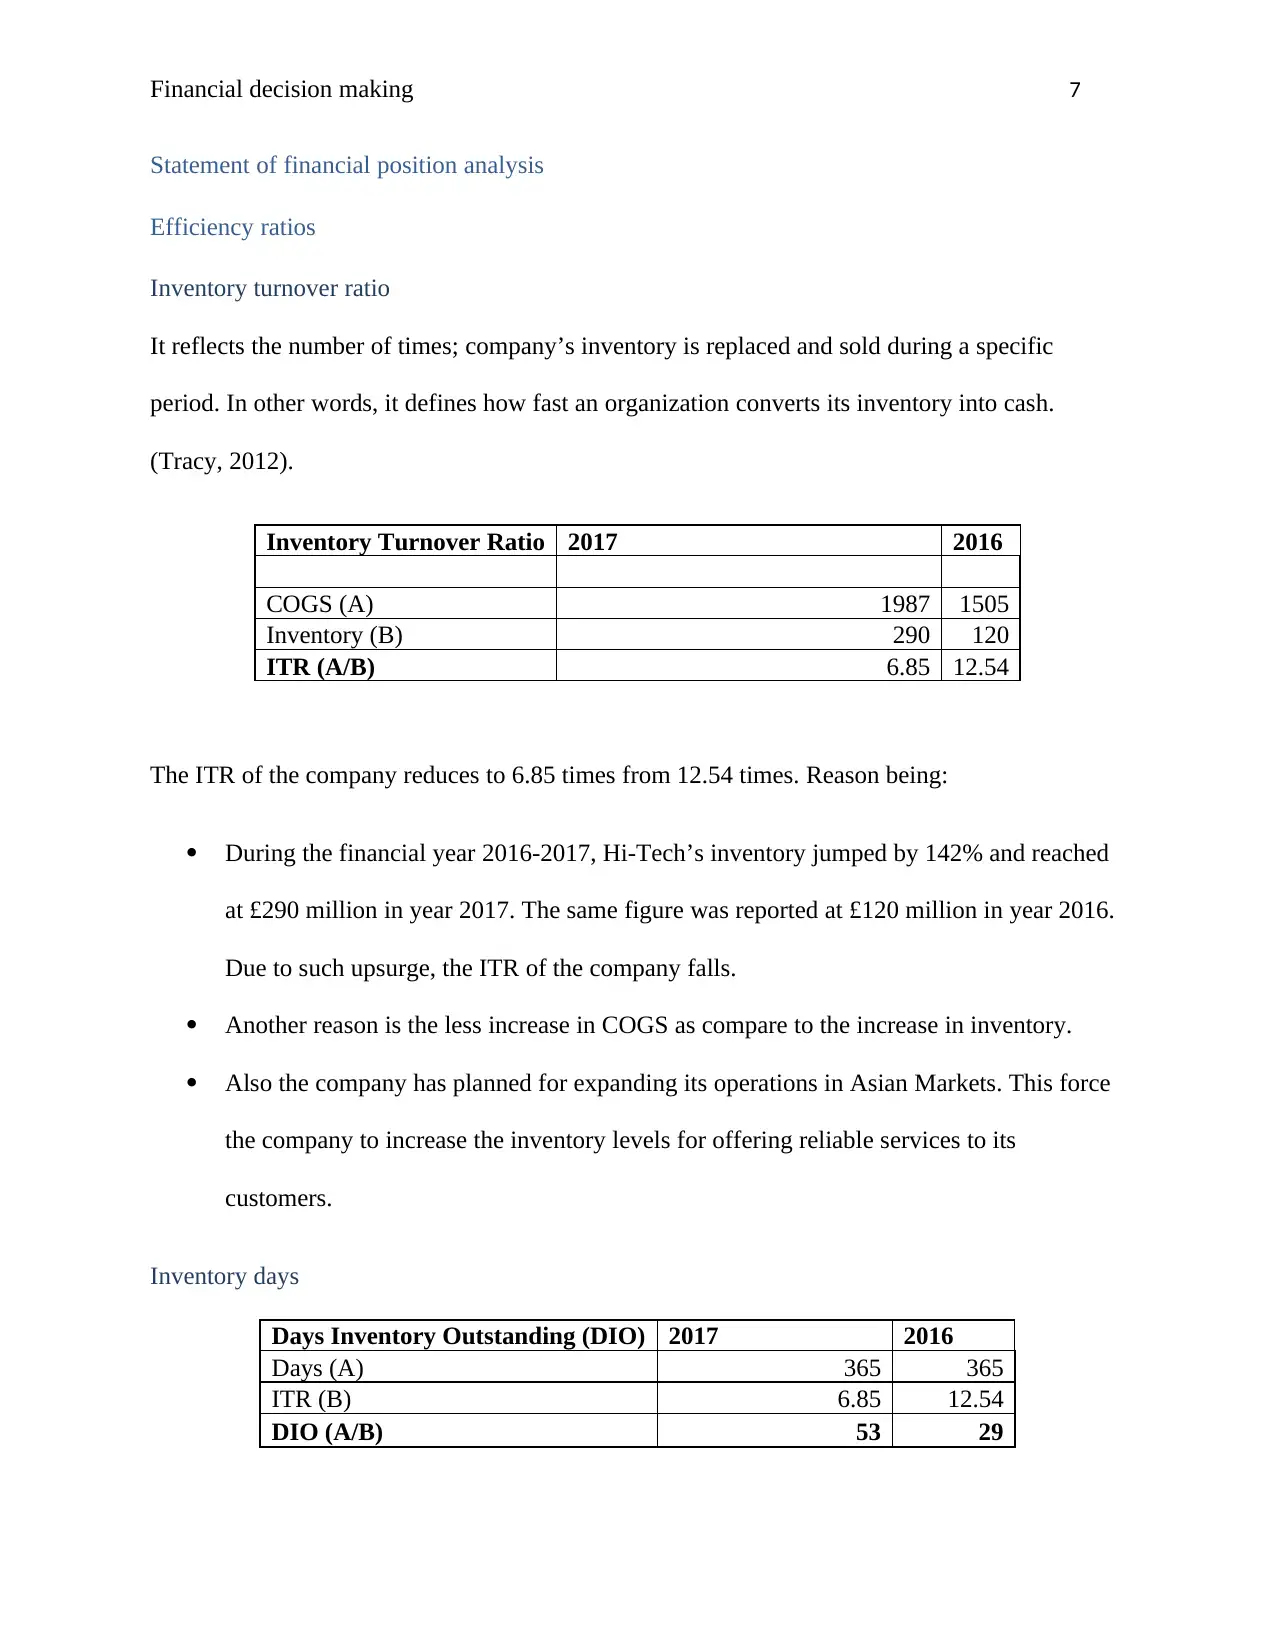
Percentage change in net profit is 58.54% which is way more than the percentage change
in total sales.
High laptop sales worth £1052 million in 2017 helps the company to cover the cost and
increase its net profits.
Return on equity
This ratio indicates the capability of a company to generate profits from its shareholders
investments. It is basically the amount of net income shown in terms of percentage of
shareholders equity (Parrino, Kidwell and Bates, 2011).
Return on Equity 2017 2016
Net Profit (A) 130 82
Shareholders’ equity (B) 1069 939
ROE (A/B) 12% 9%
Hi-Tech’s ROE increases by 3% in year 2017. In 2016, the ratio was 9% which rose to 12% in
2017. Reason for this upsurge are:
The profit rises by 58.54% whereas equity increases only by 14% last year. Such huge
difference boosted up Hi-Tech’s ROE, making it more profitable.
Lower income tax expense and the finance cost incurred by Hi-Tech raises its ROE.
Also, the company has both long term and short term borrowings, which increases its
financial leverage as well as ROE.
Paraphrase This Document
Need a fresh take? Get an instant paraphrase of this document with our AI Paraphraser
Financial decision making 7
Statement of financial position analysis
Efficiency ratios
Inventory turnover ratio
It reflects the number of times; company’s inventory is replaced and sold during a specific
period. In other words, it defines how fast an organization converts its inventory into cash.
(Tracy, 2012).
Inventory Turnover Ratio 2017 2016
COGS (A) 1987 1505
Inventory (B) 290 120
ITR (A/B) 6.85 12.54
The ITR of the company reduces to 6.85 times from 12.54 times. Reason being:
During the financial year 2016-2017, Hi-Tech’s inventory jumped by 142% and reached
at £290 million in year 2017. The same figure was reported at £120 million in year 2016.
Due to such upsurge, the ITR of the company falls.
Another reason is the less increase in COGS as compare to the increase in inventory.
Also the company has planned for expanding its operations in Asian Markets. This force
the company to increase the inventory levels for offering reliable services to its
customers.
Inventory days
Days Inventory Outstanding (DIO) 2017 2016
Days (A) 365 365
ITR (B) 6.85 12.54
DIO (A/B) 53 29
Financial decision making 8
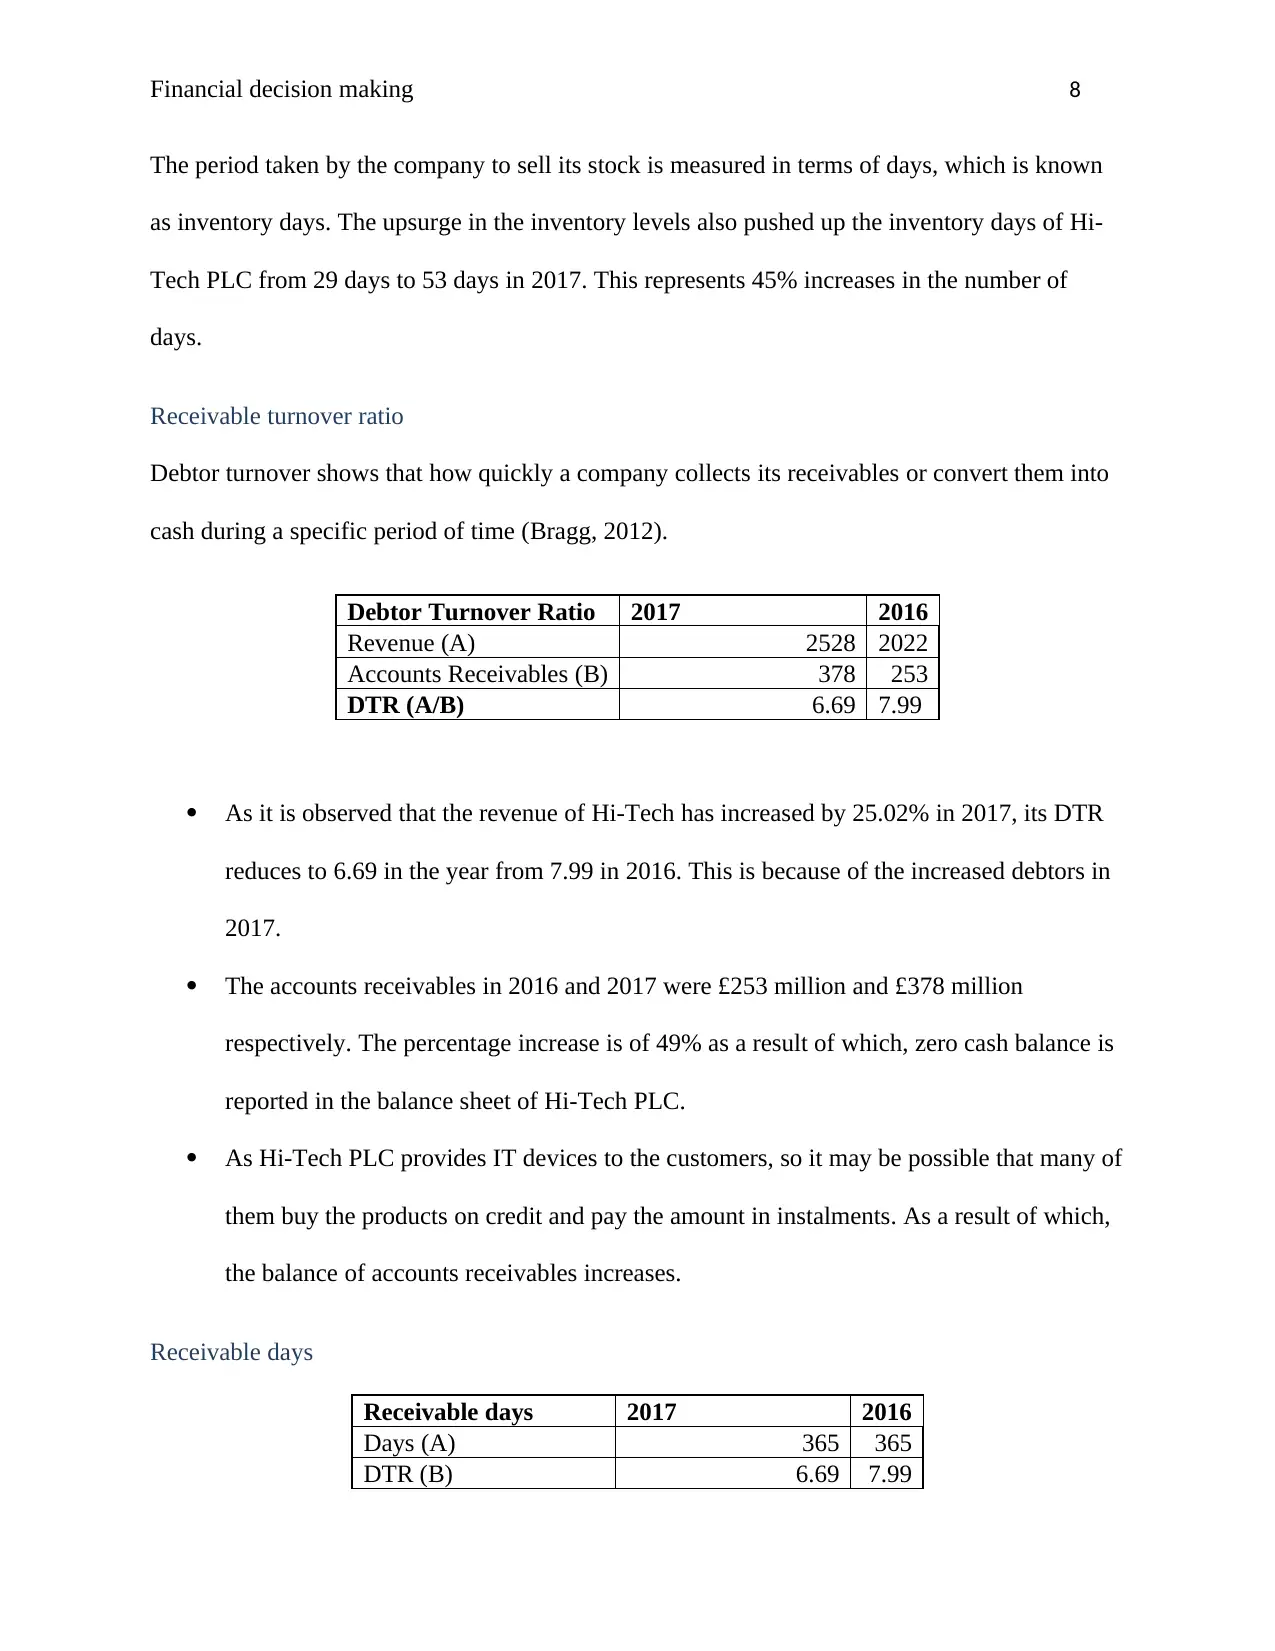
The period taken by the company to sell its stock is measured in terms of days, which is known
as inventory days. The upsurge in the inventory levels also pushed up the inventory days of Hi-
Tech PLC from 29 days to 53 days in 2017. This represents 45% increases in the number of
days.
Receivable turnover ratio
Debtor turnover shows that how quickly a company collects its receivables or convert them into
cash during a specific period of time (Bragg, 2012).
Debtor Turnover Ratio 2017 2016
Revenue (A) 2528 2022
Accounts Receivables (B) 378 253
DTR (A/B) 6.69 7.99
As it is observed that the revenue of Hi-Tech has increased by 25.02% in 2017, its DTR
reduces to 6.69 in the year from 7.99 in 2016. This is because of the increased debtors in
2017.
The accounts receivables in 2016 and 2017 were £253 million and £378 million
respectively. The percentage increase is of 49% as a result of which, zero cash balance is
reported in the balance sheet of Hi-Tech PLC.
As Hi-Tech PLC provides IT devices to the customers, so it may be possible that many of
them buy the products on credit and pay the amount in instalments. As a result of which,
the balance of accounts receivables increases.
Receivable days
Receivable days 2017 2016
Days (A) 365 365
DTR (B) 6.69 7.99
⊘ This is a preview!⊘
Do you want full access?
Subscribe today to unlock all pages.
Trusted by 1+ million students worldwide
Financial decision making 9
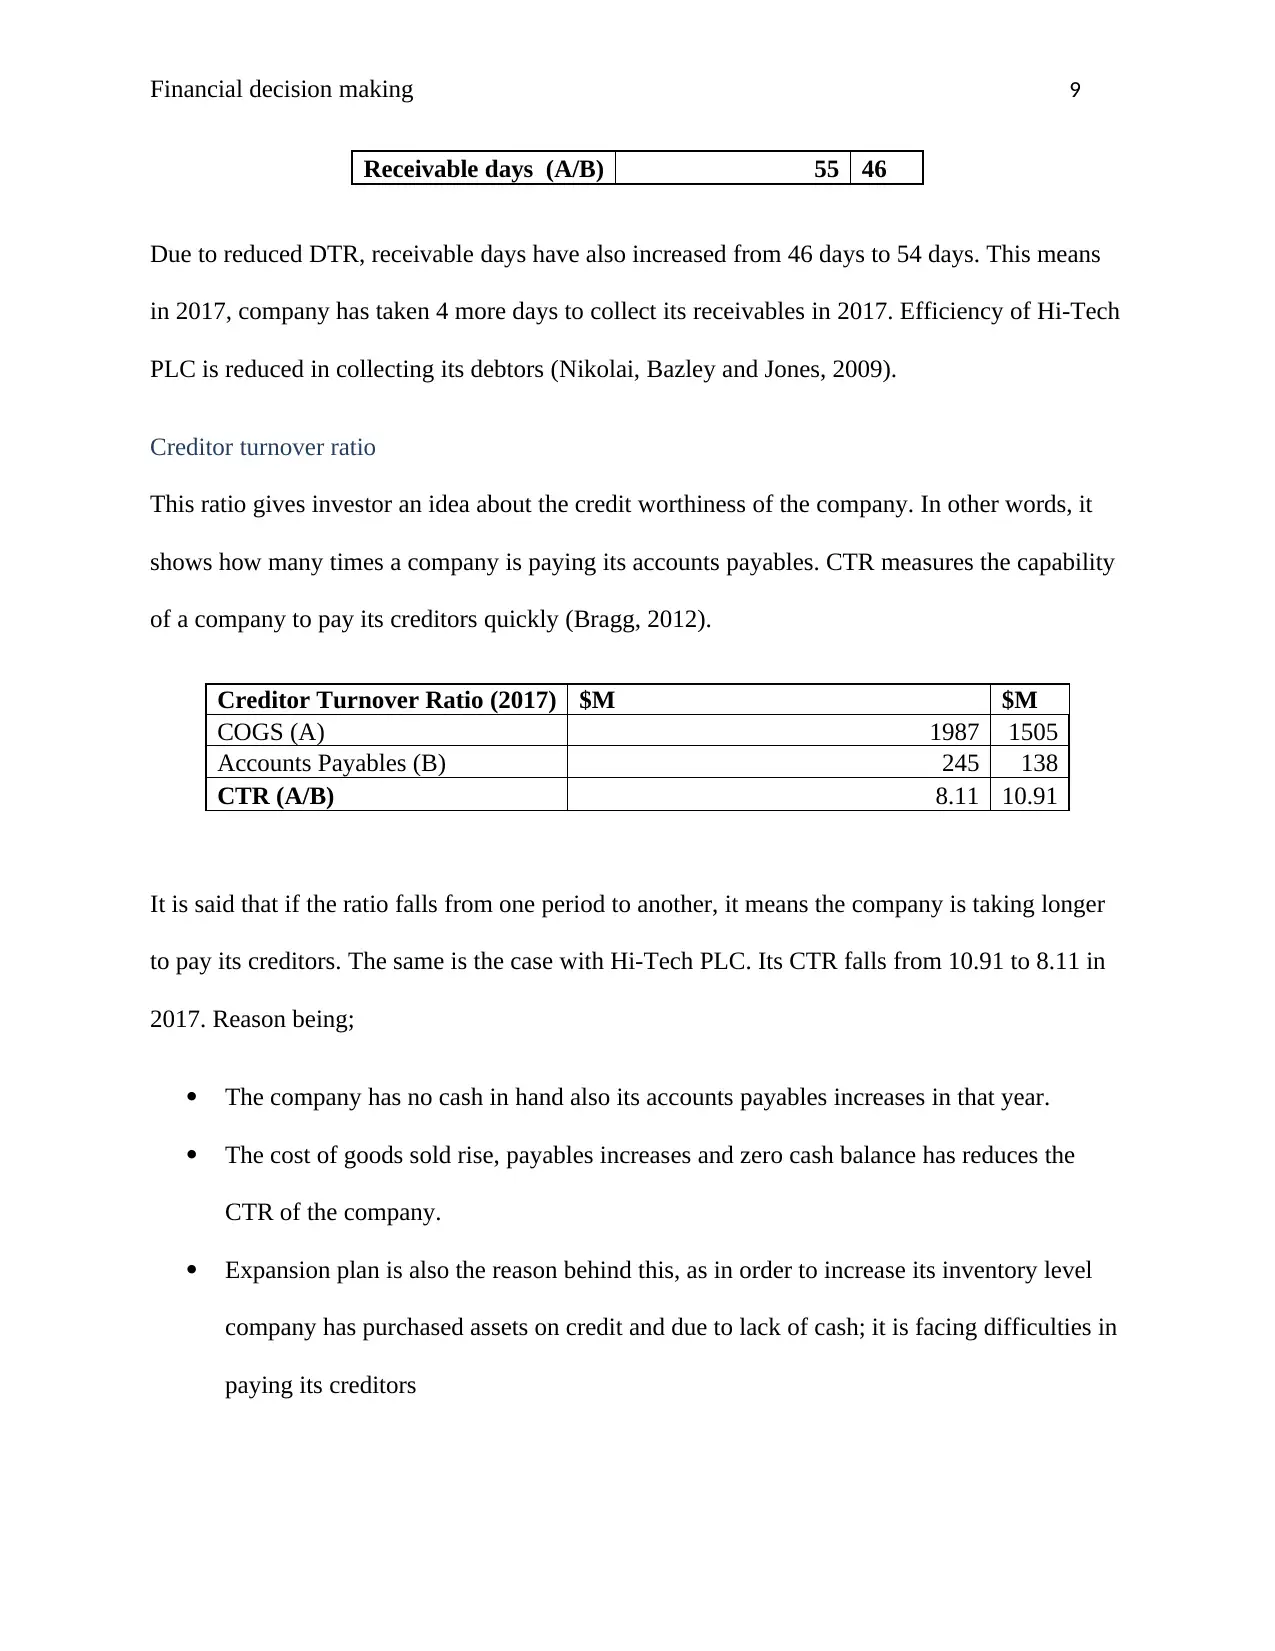
Receivable days (A/B) 55 46
Due to reduced DTR, receivable days have also increased from 46 days to 54 days. This means
in 2017, company has taken 4 more days to collect its receivables in 2017. Efficiency of Hi-Tech
PLC is reduced in collecting its debtors (Nikolai, Bazley and Jones, 2009).
Creditor turnover ratio
This ratio gives investor an idea about the credit worthiness of the company. In other words, it
shows how many times a company is paying its accounts payables. CTR measures the capability
of a company to pay its creditors quickly (Bragg, 2012).
Creditor Turnover Ratio (2017) $M $M
COGS (A) 1987 1505
Accounts Payables (B) 245 138
CTR (A/B) 8.11 10.91
It is said that if the ratio falls from one period to another, it means the company is taking longer
to pay its creditors. The same is the case with Hi-Tech PLC. Its CTR falls from 10.91 to 8.11 in
2017. Reason being;
The company has no cash in hand also its accounts payables increases in that year.
The cost of goods sold rise, payables increases and zero cash balance has reduces the
CTR of the company.
Expansion plan is also the reason behind this, as in order to increase its inventory level
company has purchased assets on credit and due to lack of cash; it is facing difficulties in
paying its creditors
Paraphrase This Document
Need a fresh take? Get an instant paraphrase of this document with our AI Paraphraser
Financial decision making 10
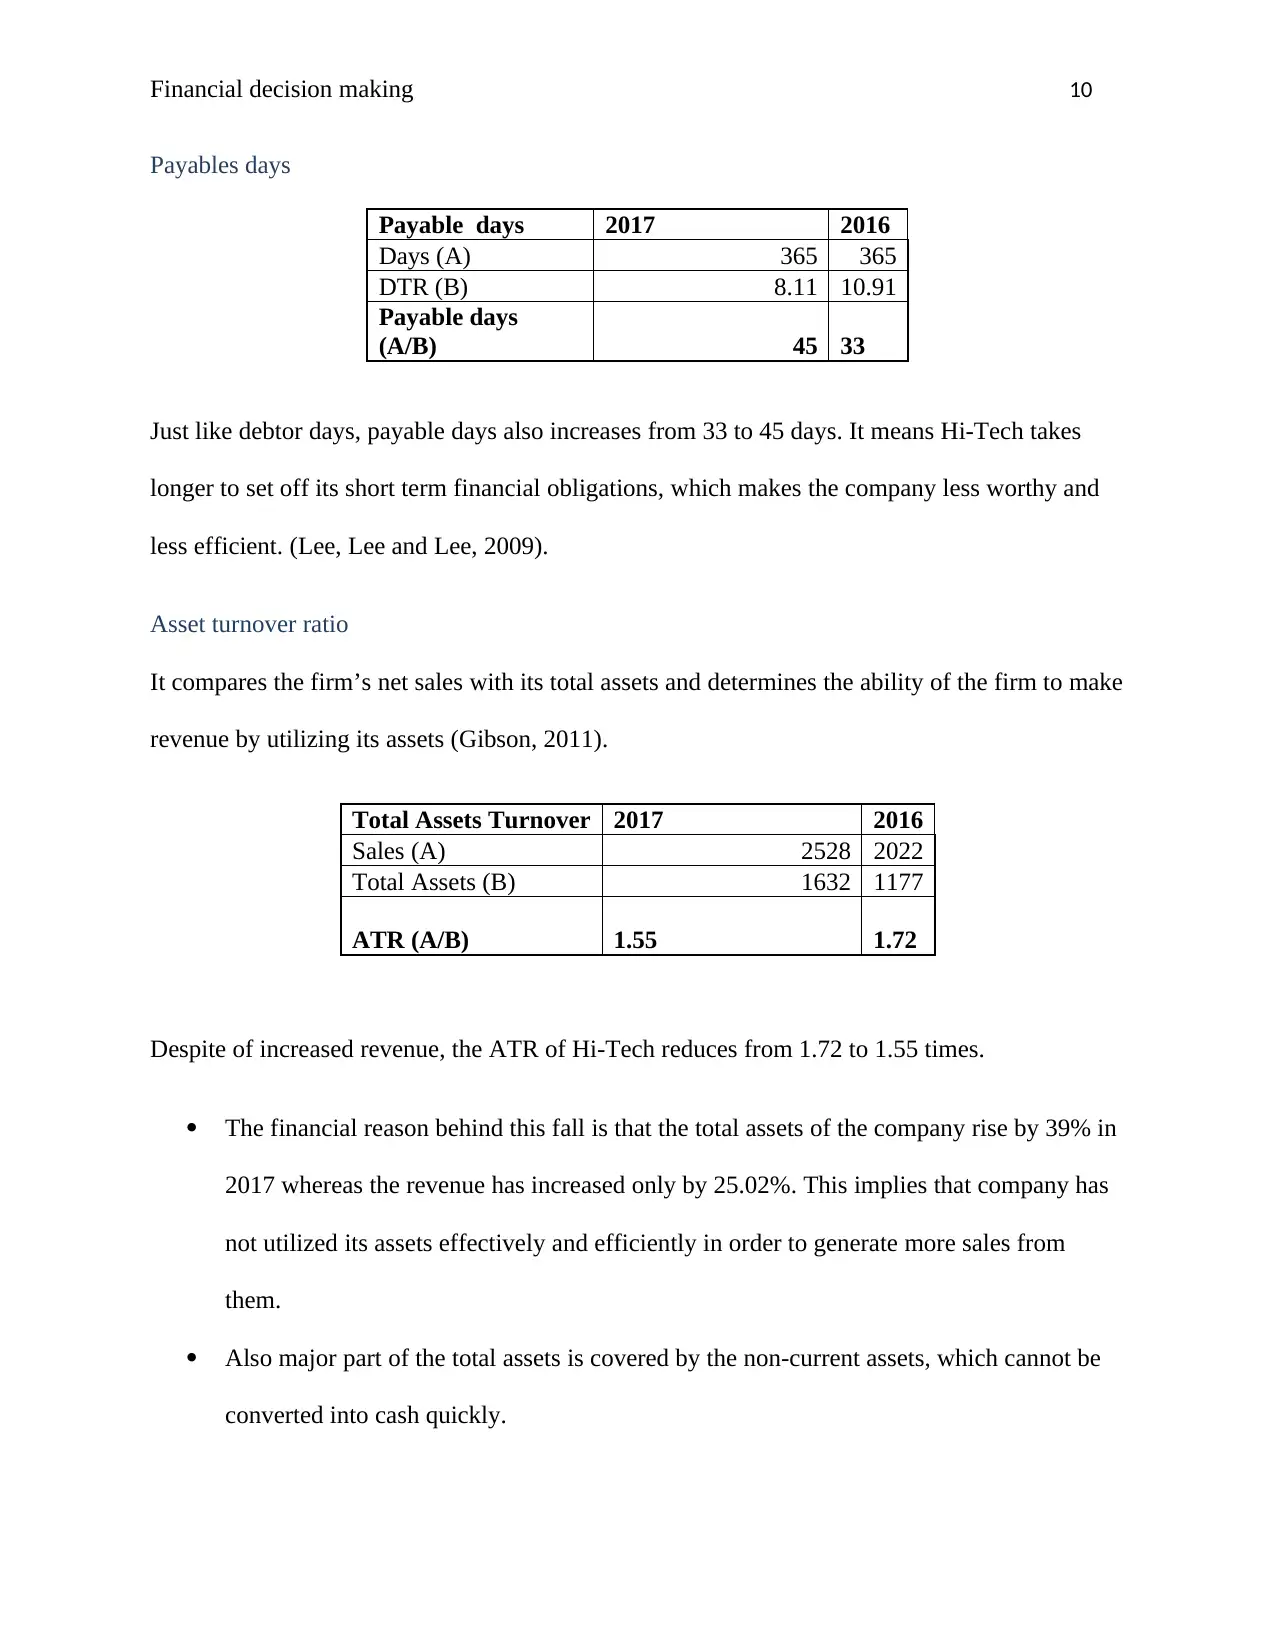
Payables days
Payable days 2017 2016
Days (A) 365 365
DTR (B) 8.11 10.91
Payable days
(A/B) 45 33
Just like debtor days, payable days also increases from 33 to 45 days. It means Hi-Tech takes
longer to set off its short term financial obligations, which makes the company less worthy and
less efficient. (Lee, Lee and Lee, 2009).
Asset turnover ratio
It compares the firm’s net sales with its total assets and determines the ability of the firm to make
revenue by utilizing its assets (Gibson, 2011).
Total Assets Turnover 2017 2016
Sales (A) 2528 2022
Total Assets (B) 1632 1177
ATR (A/B) 1.55 1.72
Despite of increased revenue, the ATR of Hi-Tech reduces from 1.72 to 1.55 times.
The financial reason behind this fall is that the total assets of the company rise by 39% in
2017 whereas the revenue has increased only by 25.02%. This implies that company has
not utilized its assets effectively and efficiently in order to generate more sales from
them.
Also major part of the total assets is covered by the non-current assets, which cannot be
converted into cash quickly.
Financial decision making 11
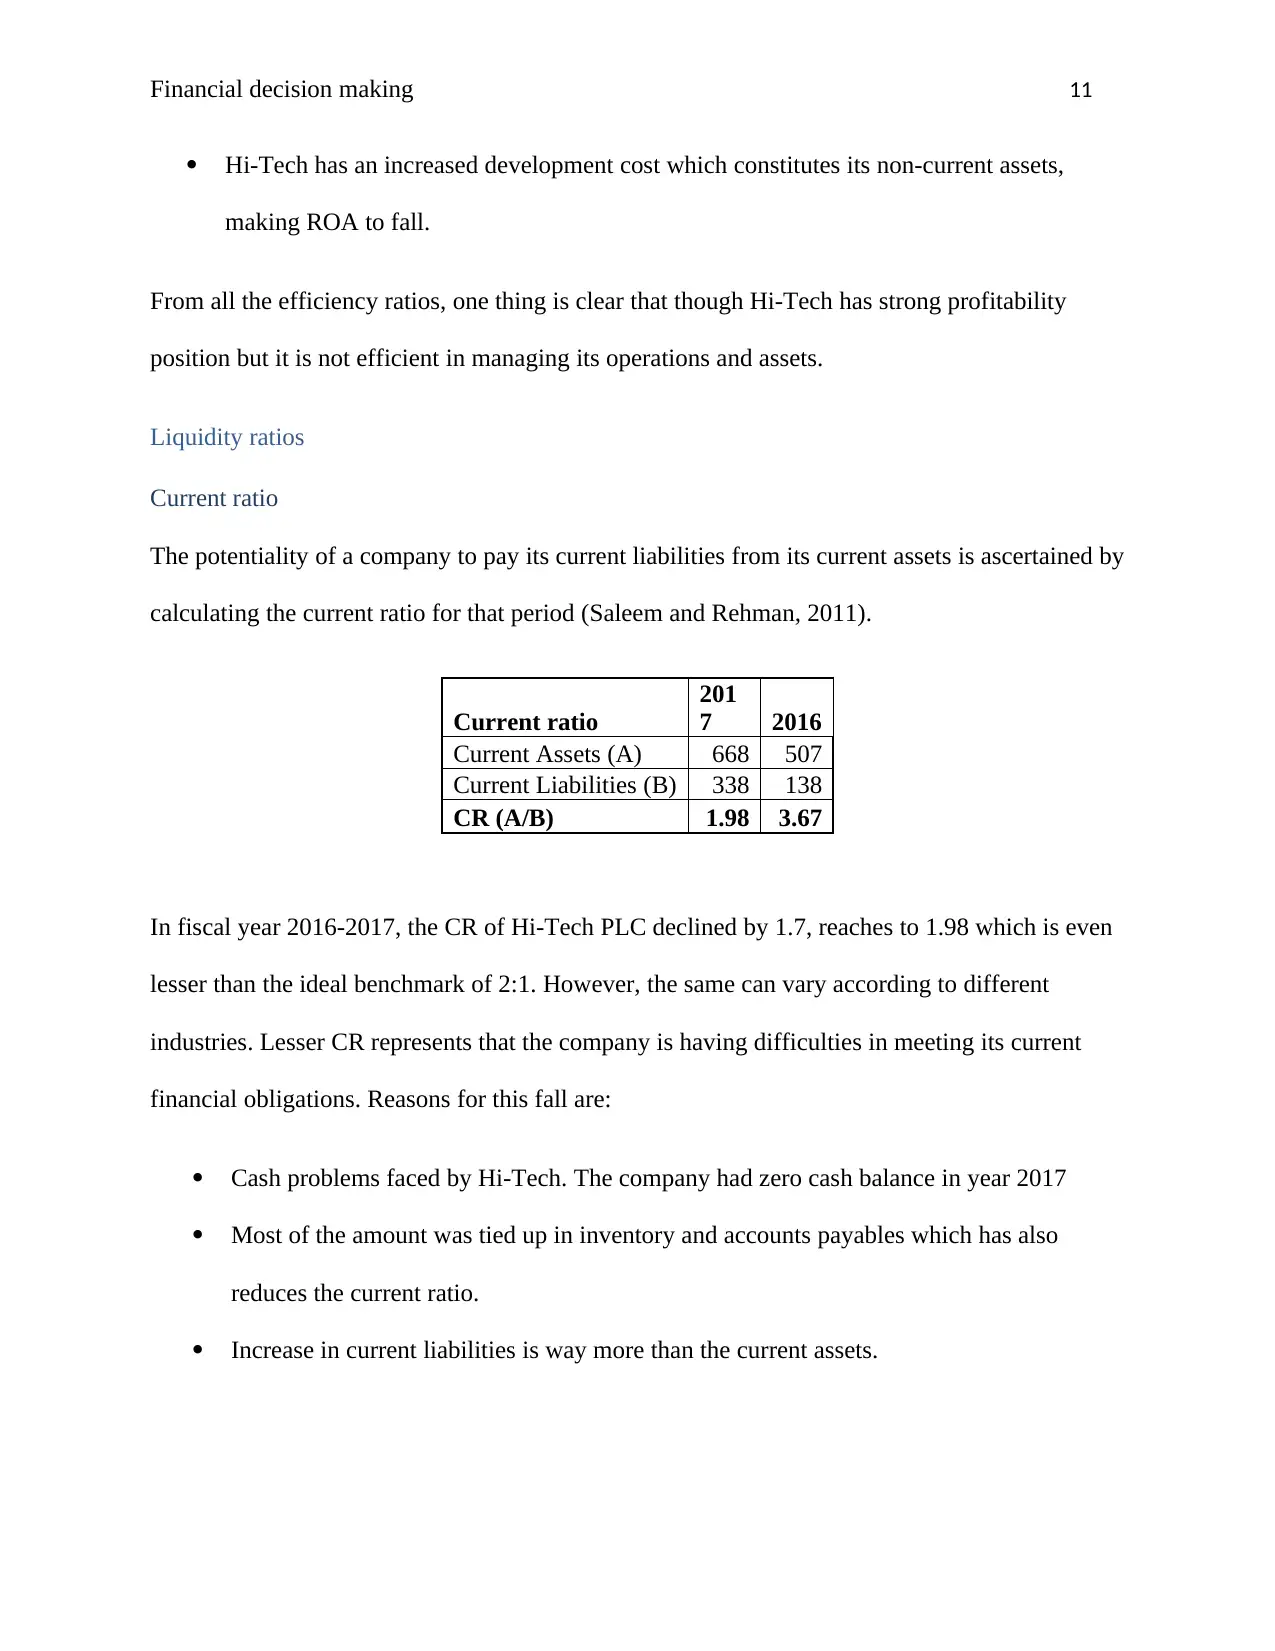
Hi-Tech has an increased development cost which constitutes its non-current assets,
making ROA to fall.
From all the efficiency ratios, one thing is clear that though Hi-Tech has strong profitability
position but it is not efficient in managing its operations and assets.
Liquidity ratios
Current ratio
The potentiality of a company to pay its current liabilities from its current assets is ascertained by
calculating the current ratio for that period (Saleem and Rehman, 2011).
Current ratio
201
7 2016
Current Assets (A) 668 507
Current Liabilities (B) 338 138
CR (A/B) 1.98 3.67
In fiscal year 2016-2017, the CR of Hi-Tech PLC declined by 1.7, reaches to 1.98 which is even
lesser than the ideal benchmark of 2:1. However, the same can vary according to different
industries. Lesser CR represents that the company is having difficulties in meeting its current
financial obligations. Reasons for this fall are:
Cash problems faced by Hi-Tech. The company had zero cash balance in year 2017
Most of the amount was tied up in inventory and accounts payables which has also
reduces the current ratio.
Increase in current liabilities is way more than the current assets.
⊘ This is a preview!⊘
Do you want full access?
Subscribe today to unlock all pages.
Trusted by 1+ million students worldwide
1 out of 22
Related Documents


Your All-in-One AI-Powered Toolkit for Academic Success.
+13062052269
info@desklib.com
Available 24*7 on WhatsApp / Email
![[object Object]](/_next/static/media/star-bottom.7253800d.svg)
Unlock your academic potential
Copyright © 2020–2026 A2Z Services. All Rights Reserved. Developed and managed by ZUCOL.