Detailed Financial Analysis and Recommendation: AGL Limited Report
VerifiedAdded on 2024/05/31
|22
|3082
|62
Report
AI Summary
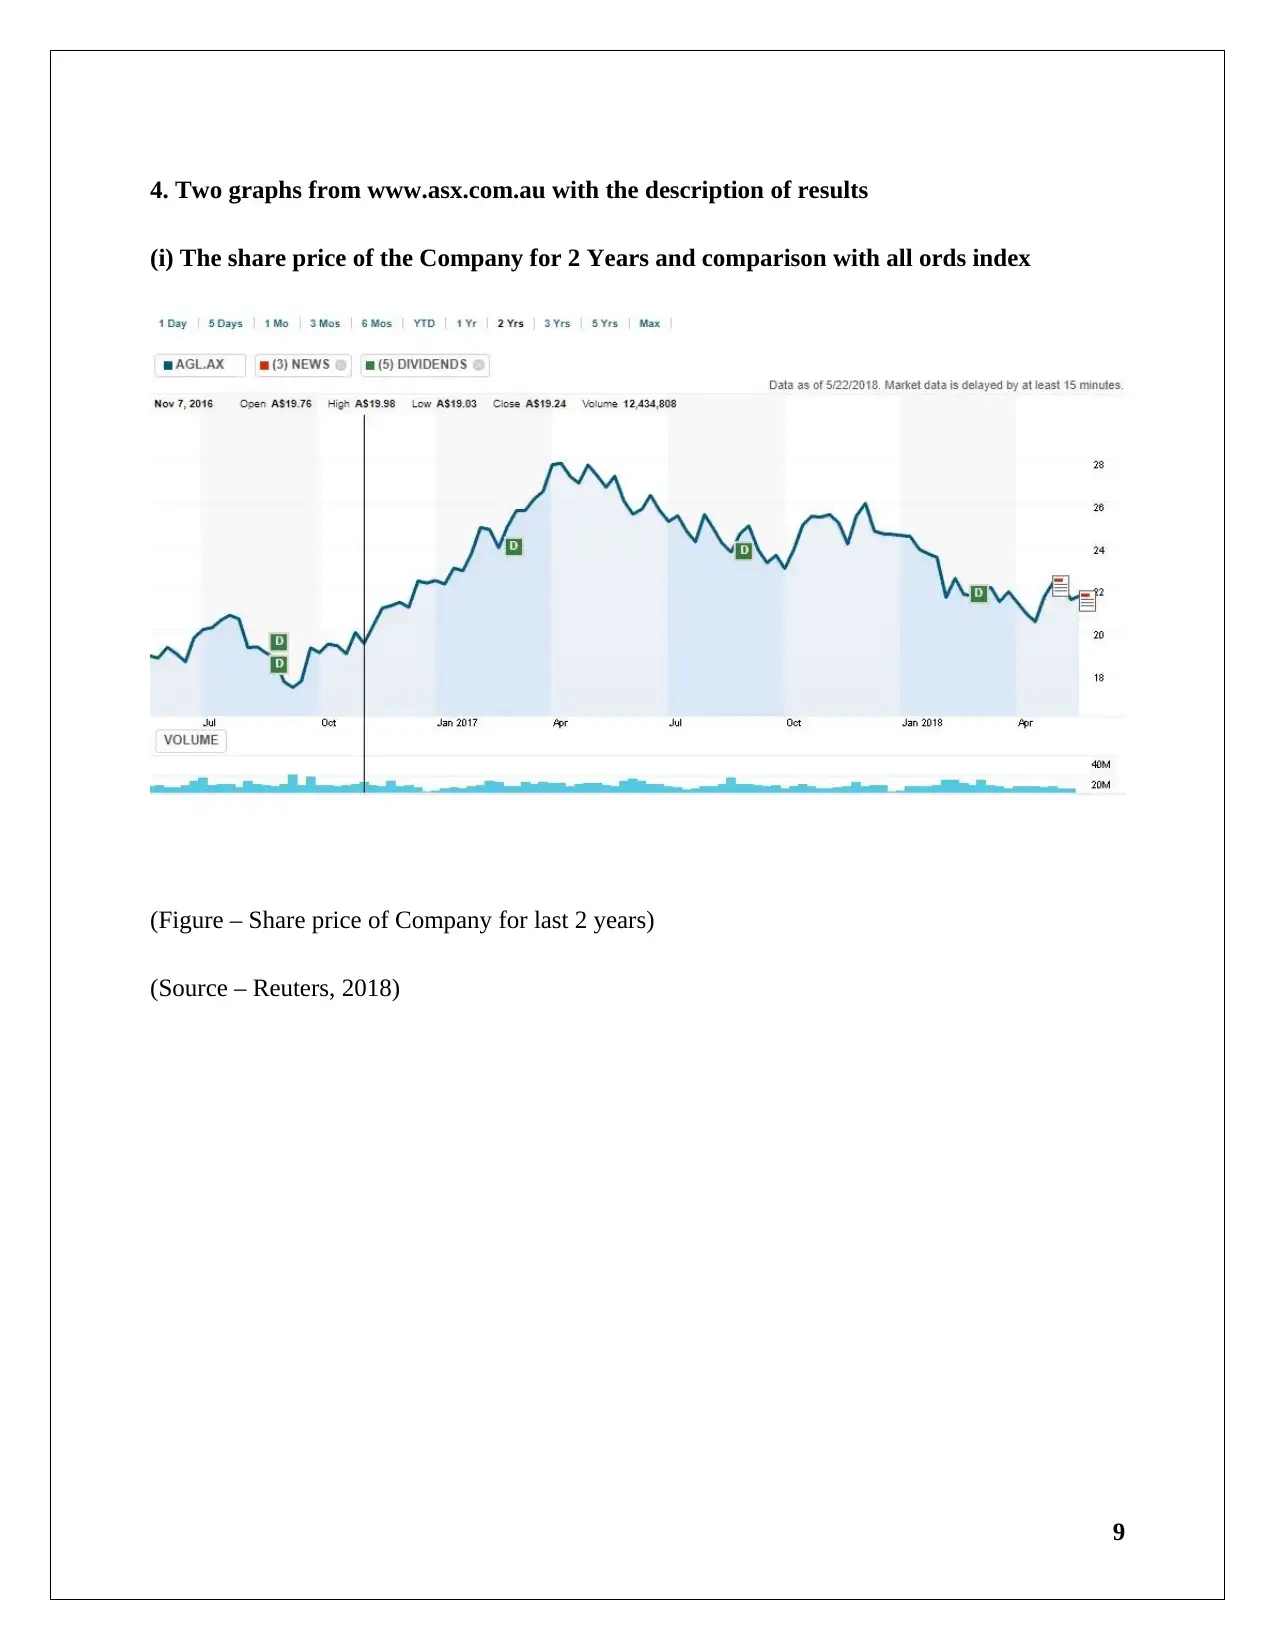
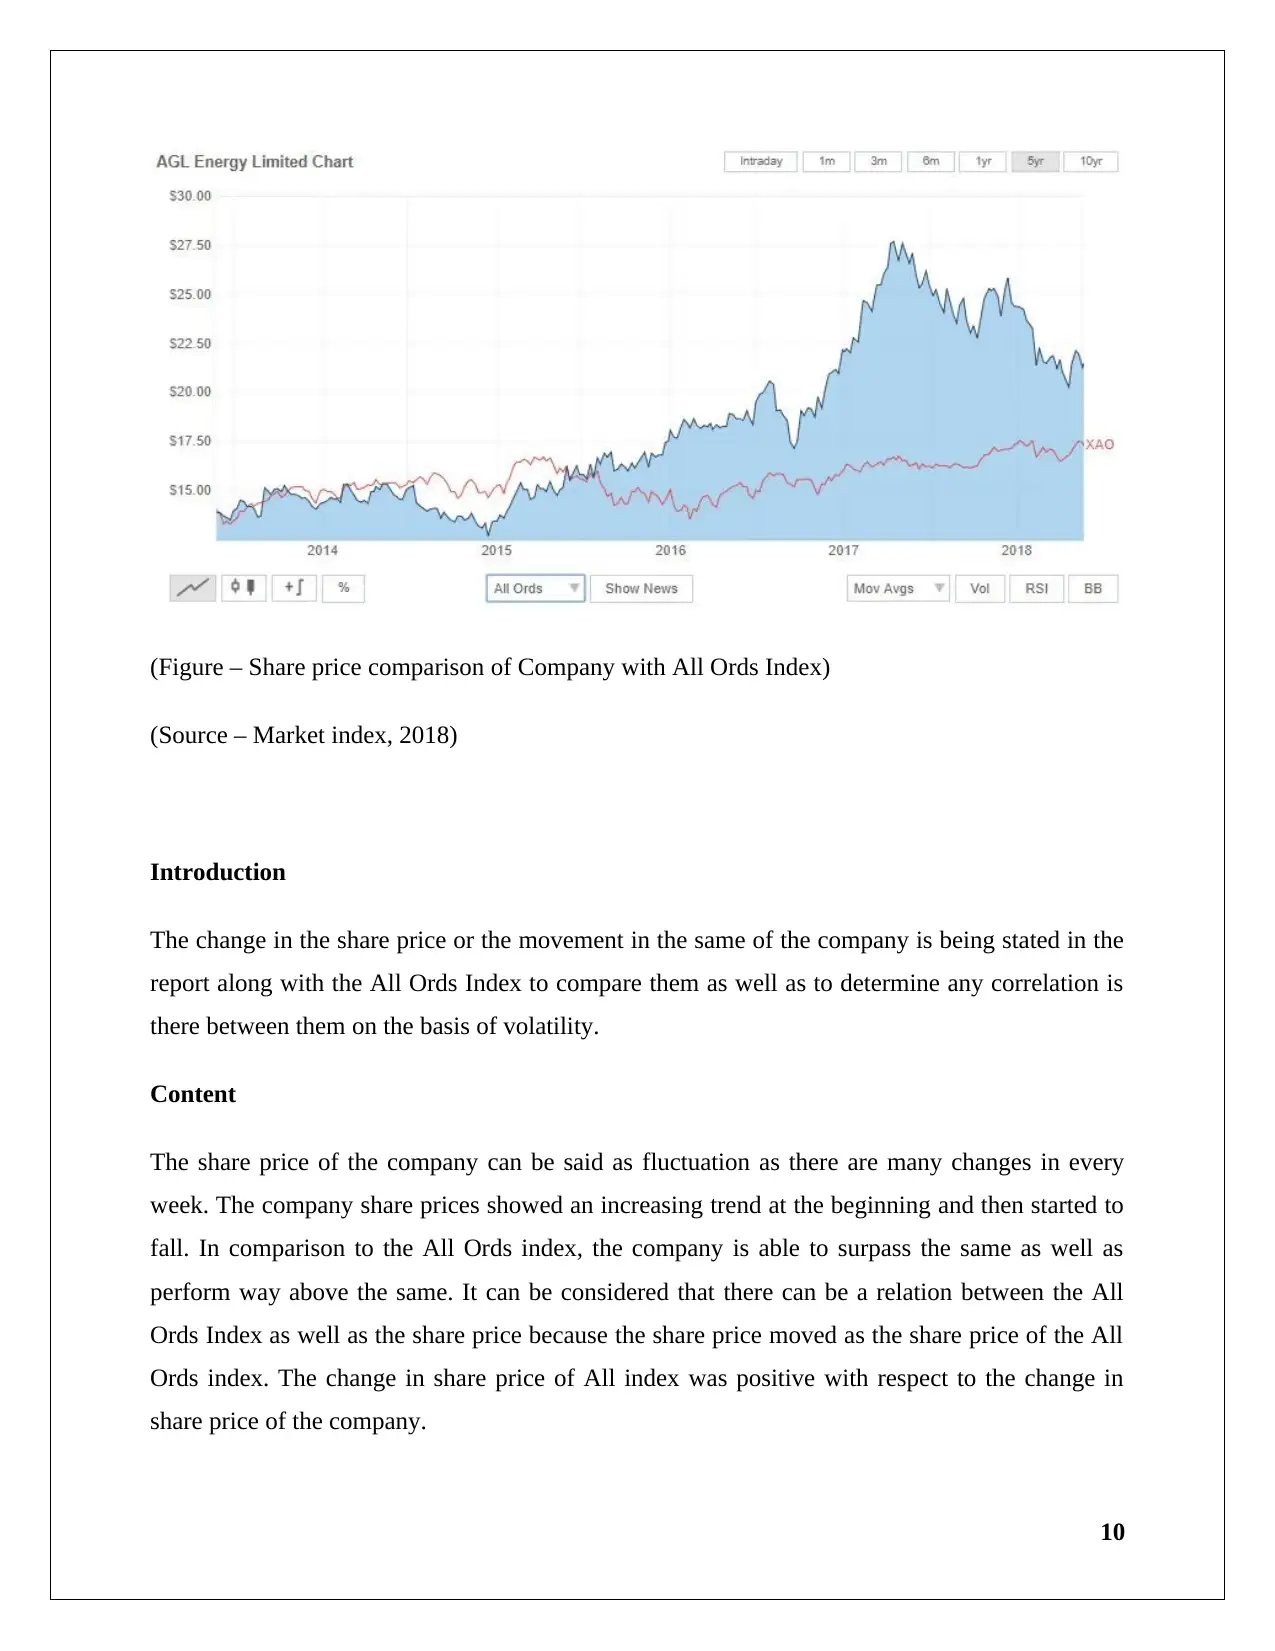
This report provides a comprehensive financial analysis of AGL Limited, an Australian electricity generation company. It covers the company's ownership and governance structure, along with calculations of various financial ratios to evaluate its performance. The report includes an analysis of AGL's share price fluctuations using graphs from the ASX, identifies significant factors influencing the share price, and calculates the company's beta value and expected rate of return using the CAPM model. Furthermore, it determines the weighted average cost of capital (WACC), discusses the preferred optimal capital structure, and reviews the company's dividend policy. The report concludes with a letter of recommendation based on the analysis, offering insights into AGL's financial health and investment potential, with data sourced from AGL's reports and Reuters.

HI5002: Finance for business
1
1
Paraphrase This Document
Need a fresh take? Get an instant paraphrase of this document with our AI Paraphraser

Table of Contents
Introduction....................................................................................................................................3
Portfolio..........................................................................................................................................4
1. A brief description of Company...........................................................................................4
2. Ownership Governance Structure.......................................................................................5
3. Calculation of Ratios.............................................................................................................7
4. Two graphs from www.asx.com.au with the description of results..................................9
5. Significant factors that influenced share price.................................................................11
6. Calculation of ’ beta values and Expected Rates of Return using the CAPM...............12
7. Weighted Average Cost of Capital (WACC).....................................................................13
8. Preferred optimal capital structure...................................................................................15
9. Dividend Policy....................................................................................................................17
10. Letter Recommendation....................................................................................................18
Conclusion....................................................................................................................................19
References.....................................................................................................................................20
2

Introduction
The company is required to be managed in such manner that success is attained. For this, all the
resources which are available with it shall be used in most appropriate manner. In this report, the
overview of the company will be provided which in the given case is taken as AGL Limited. The
governance structure of the company will be provided and then the ratios will be calculated so
that performance of the company can be evaluated in most appropriate manner. Graphs will be
also included so that the fluctuations in the share price can be ascertained in the appropriate
manner. The dividend policy and the cost of capital and rate of return will also be calculated in
the report.
3
⊘ This is a preview!⊘
Do you want full access?
Subscribe today to unlock all pages.

Trusted by 1+ million students worldwide

Portfolio
1. A brief description of Company
AGL energy is an Australian company which is operating in the electricity generation. This is
one of the largest ASX listed investors which is dealing with the renewable energy. The numbers
of customer accounts are more than 3.6 million (AGL, 2017). The aim of the company is to
enhance and achieve growth in the carbon-constrained world. They work in such manner by
which customers are supported and also contribute to the charity partners. The portfolio of the
company is diverse and it includes peaking, intermediate generation plants, a base which is
spread in the traditional thermal generation, storage and natural gas. There are various renewable
energy sources which are also used by the company such as wind, solar and hydro.
4
Paraphrase This Document
Need a fresh take? Get an instant paraphrase of this document with our AI Paraphraser

2. Ownership Governance Structure
i)
Main substantial shareholders
Having more than 20% shareholding: The person who holds the shares in the company are
considered as the shareholders and out of them some are considered as the substantial
shareholder. They are the ones who will be holding the shares of more than 20% total stake. In
the company, there is no such shareholder who is holding this large number of shares (AGL,
2017).
Having more than 5%: The shareholders who are holding the more than 5% present of the
stake, are also required to be identified. There is only one shareholder who is holding the 5.42%
of the stake which has 352055 shares and that is HSBC Custody Nominees (Australia) Limited.
ii)
Designation Name
Chairman Jerry Maycock
Managing Director & CEO Andy Vesey
Director Jeremy Maycock
Director Jacqueline Hey
Director Les Hosking
Director Graeme Hunt
5

Director Belinda Hutchinson
Director Peter Botten
Director Diane Smith-Gander
Director John Stanhope AM
There is no such person who is holding the substantial interest in the company and so it cannot
be said that the company is a family company.
6
Director Peter Botten
Director Diane Smith-Gander
Director John Stanhope AM
There is no such person who is holding the substantial interest in the company and so it cannot
be said that the company is a family company.
6
⊘ This is a preview!⊘
Do you want full access?
Subscribe today to unlock all pages.

Trusted by 1+ million students worldwide

3. Calculation of Ratios
Calculation of Ratios
Sr.
No. Particular Year 2017
$M
Year 2016
$M
1 Total Asset 14458.000 14604.000
2 Total Liability 6884.000 6678.000
3 Ordinary Equity 7574.000 7926.000
4 Net profit After Tax (NPAT) 539.000 -407.000
5 Current Asset 3625.000 3587.000
6 Current Liability 2731.000 2553.000
7 Inventory 351.000 414.000
8 Quick Asset 2380.000 2139.000
9 Debt 3466.000 3387.000
10 Net Sales 12584.000 11150.000
11 Fixed Asset 6513.000 6541.000
12 Gross profit 1472.000 222.000
13 EPS (Cents) 80.400 -60.400
Current Ratio = Current Asset/
Current Liability 1.33 1.41
Quick Ratio = Quick Asset/
Current Liability 0.87 0.84
Debt Equity ratio = Debt/ Equity 0.46 0.43
Inventory Turnover Ratio = sales /
Inventory 35.85 26.93
Fixed Asset Turnover Ratio = sales
/ Fixed assets 1.93 1.70
Gross Profit Margin Ratio = Gross
profit / Sales 0.12 0.02
ROA = Net Income / Total Asset 0.04 -0.03
Earnings per share 80.40 -60.40
The current and quick ratio of the company is used to determine the liquidity position whereas
ratios such as the debt-equity ratio, turnover ratio are used to measure the solvency of the ratios.
7
Paraphrase This Document
Need a fresh take? Get an instant paraphrase of this document with our AI Paraphraser

The profitability ratio of the company states about the performance of the company during the
year as well as the return that is being provided to the shareholders of the company (Basu, 2018).
The company current ratio and quick ratio which are ideal for the organisation are 2:1 and 1:1
respectively. The ratio has decreased from 1.41 to 1.33 but it is still in a satisfactory position as
the company can meet the short term as well as long-term liabilities. In case of quick assets, the
company should try to strengthen the assets so that there is no problem (Hossan, 2010).
The Debt equity ratio of the company has increased from 0.43 to 0.46. The company position is
still satisfactory as there is a balance of both the debt and equity in the capital structure. The
Turnover ratio of the company increased with the increase in the revenue as well as the fixed
asset turnover ratio which is a positive sign.
The performance ratio of the previous year were not at all satisfactory as the company incurred
losses but in current year company is able to provide a positive return to the stakeholders of the
company with better and effective results in terms of return on asset, gross profit margin as well
a earning per share (Hossan, 2010).
8

4. Two graphs from www.asx.com.au with the description of results
(i) The share price of the Company for 2 Years and comparison with all ords index
(Figure – Share price of Company for last 2 years)
(Source – Reuters, 2018)
9
(i) The share price of the Company for 2 Years and comparison with all ords index
(Figure – Share price of Company for last 2 years)
(Source – Reuters, 2018)
9
⊘ This is a preview!⊘
Do you want full access?
Subscribe today to unlock all pages.

Trusted by 1+ million students worldwide

(Figure – Share price comparison of Company with All Ords Index)
(Source – Market index, 2018)
Introduction
The change in the share price or the movement in the same of the company is being stated in the
report along with the All Ords Index to compare them as well as to determine any correlation is
there between them on the basis of volatility.
Content
The share price of the company can be said as fluctuation as there are many changes in every
week. The company share prices showed an increasing trend at the beginning and then started to
fall. In comparison to the All Ords index, the company is able to surpass the same as well as
perform way above the same. It can be considered that there can be a relation between the All
Ords Index as well as the share price because the share price moved as the share price of the All
Ords index. The change in share price of All index was positive with respect to the change in
share price of the company.
10
Paraphrase This Document
Need a fresh take? Get an instant paraphrase of this document with our AI Paraphraser

Conclusion
It can be concluded with the help of the above report the company is very strong and have higher
share price than the All Ords Index. There is volatility in the share price but not much as there
are fluctuations in the share price of the company.
11
It can be concluded with the help of the above report the company is very strong and have higher
share price than the All Ords Index. There is volatility in the share price but not much as there
are fluctuations in the share price of the company.
11

5. Significant factors that influenced share price
Since AGL Energy Limited is a business organization which deals majorly with energy
production, there are various factors affecting the determination of share price. These factors can
be broadly classified into two major categories, namely, internal or external factors
(Aruomoaghe & Agbo, 2013). Another basis or point of classification can be minor or major.
Whatever be the point of classification, all the factors need to be analysed accordingly. Ignorance
of a single factor can bring a major change in the share price and as such can affect the
determination of share price to a major extent.
Some of the major factors responsible for influencing or determination of share price are relating
to nations related or factors relating to outside the international boundaries. The most prominent
factors are the political and economic factors. This is because energy production sector is the
sector which involves continuous updating or modification with the changing scenario. Any
change in the economic scenario prevalent in the Australia or world, this sector is highly affected
or influenced by any slight change. Another factor that is affected is the cost of fuel or other
manufacturing inputs that are used to produce or manufacture the energy. Besides, cost of labor,
political situations, GDP of Australia, its political relations with other countries are also some
major factors that also need to be considered.
12
⊘ This is a preview!⊘
Do you want full access?
Subscribe today to unlock all pages.

Trusted by 1+ million students worldwide
1 out of 22
Related Documents

Your All-in-One AI-Powered Toolkit for Academic Success.
+13062052269
info@desklib.com
Available 24*7 on WhatsApp / Email
Unlock your academic potential
Copyright © 2020–2025 A2Z Services. All Rights Reserved. Developed and managed by ZUCOL.