HI5002 Finance for Business: Investment Report on ELK Petroleum
VerifiedAdded on 2023/06/12
|19
|4271
|300
Case Study
AI Summary
This report provides an investment recommendation for ELK Petroleum Limited, analyzing the company's products, services, and governance structure. It evaluates financial statements, stock prices, debt costs, equity costs, and dividend policy to assess investment viability. Key findings include a detailed examination of ownership governance, highlighting that major shareholders are independent of the board, reducing potential manipulation. The report also analyzes fundamental ratios, including liquidity, solvency, asset utilization, profitability, and market value, revealing a decline in company performance. Stock price analysis compares ELK's performance against the AORD index, indicating a negative correlation. The report concludes that investing in ELK Petroleum Limited may be risky due to its continuous decline in performance.
Running Head: Finance 1
Project Report: Finance
Project Report: Finance
Paraphrase This Document
Need a fresh take? Get an instant paraphrase of this document with our AI Paraphraser
Finance 2
Contents
Introduction.......................................................................................................................3
1Company description......................................................................................................3
2. Ownership governance structure..................................................................................3
3. Fundamental ratios........................................................................................................5
4. Stock price....................................................................................................................9
5. Changes into the stock price.......................................................................................10
6. Calculations................................................................................................................10
7. WACC........................................................................................................................11
8. Debt ratio....................................................................................................................12
9. Dividend policy..........................................................................................................13
10. Letter of recommendation.........................................................................................13
References.......................................................................................................................15
Appendix.........................................................................................................................16
Finance 3
Introduction:
The report emphasizes on the investment opportunity of an organization. This report
has been prepared to offer a recommendation to client of the company about the investment
into a particular company, for this project, ELK petroleum limited company has been taken
into the concern of the study. For evaluation the investment opportunity of the company,
product, services, industry hospital etc of the company has been studied firstly and further the
study has been conducted on the governance structure of the company to identify the
manipulation of the final financial statement of the company.
In addition, the report focuses on the financial statement, stock price, debt cost, equity
cost, total cost of capital, debt position, dividend policy etc to recommend the client about the
short term and long term investment into the company. The report explains that the
investment into the company could be risky in current period as the performance of the
company in continuously decreasing.
1. Company description:
ELK petroleum limited is an oil and gas company which develops and produces the oil
and gas product in the United States and Australian market. The major activities of the
company includes carbon dioxide (CO2) which enhances the enhanced oil recovery project in
the Wyoming’s Grieve oil filed in the united states. The subsidiary companies of the
company are also involving into various oil and gas projects (Reuters, 2018). The company
has been listed in Australian stock exchange in the year of 2004 and from that time it is
trading its stock from one stock exchange only. The current projects of the company are one
of the largest projects in US market and it has helped the company to enhance the market and
financial base (Home, 2018).
2. Ownership governance structure:
Ownership governance of an organization explains about the top people and investors
who invests and holds the most of the stock of the company. On the basis of the study on the
annual report (2017) of the company, it has been recognized that the there are only one
company which has more than 20% ownership in the company. HSBC CUSTODY
NOMINEES (AUSTRALIA) LIMITED holds 267,130,763 shares in the company which is
31.18% of total stock of the company. HSBC CUSTODY NOMINEES (AUSTRALIA)
LIMITED is not related with the directors and the board of members of the company.
⊘ This is a preview!⊘
Do you want full access?
Subscribe today to unlock all pages.
Trusted by 1+ million students worldwide
Finance 4
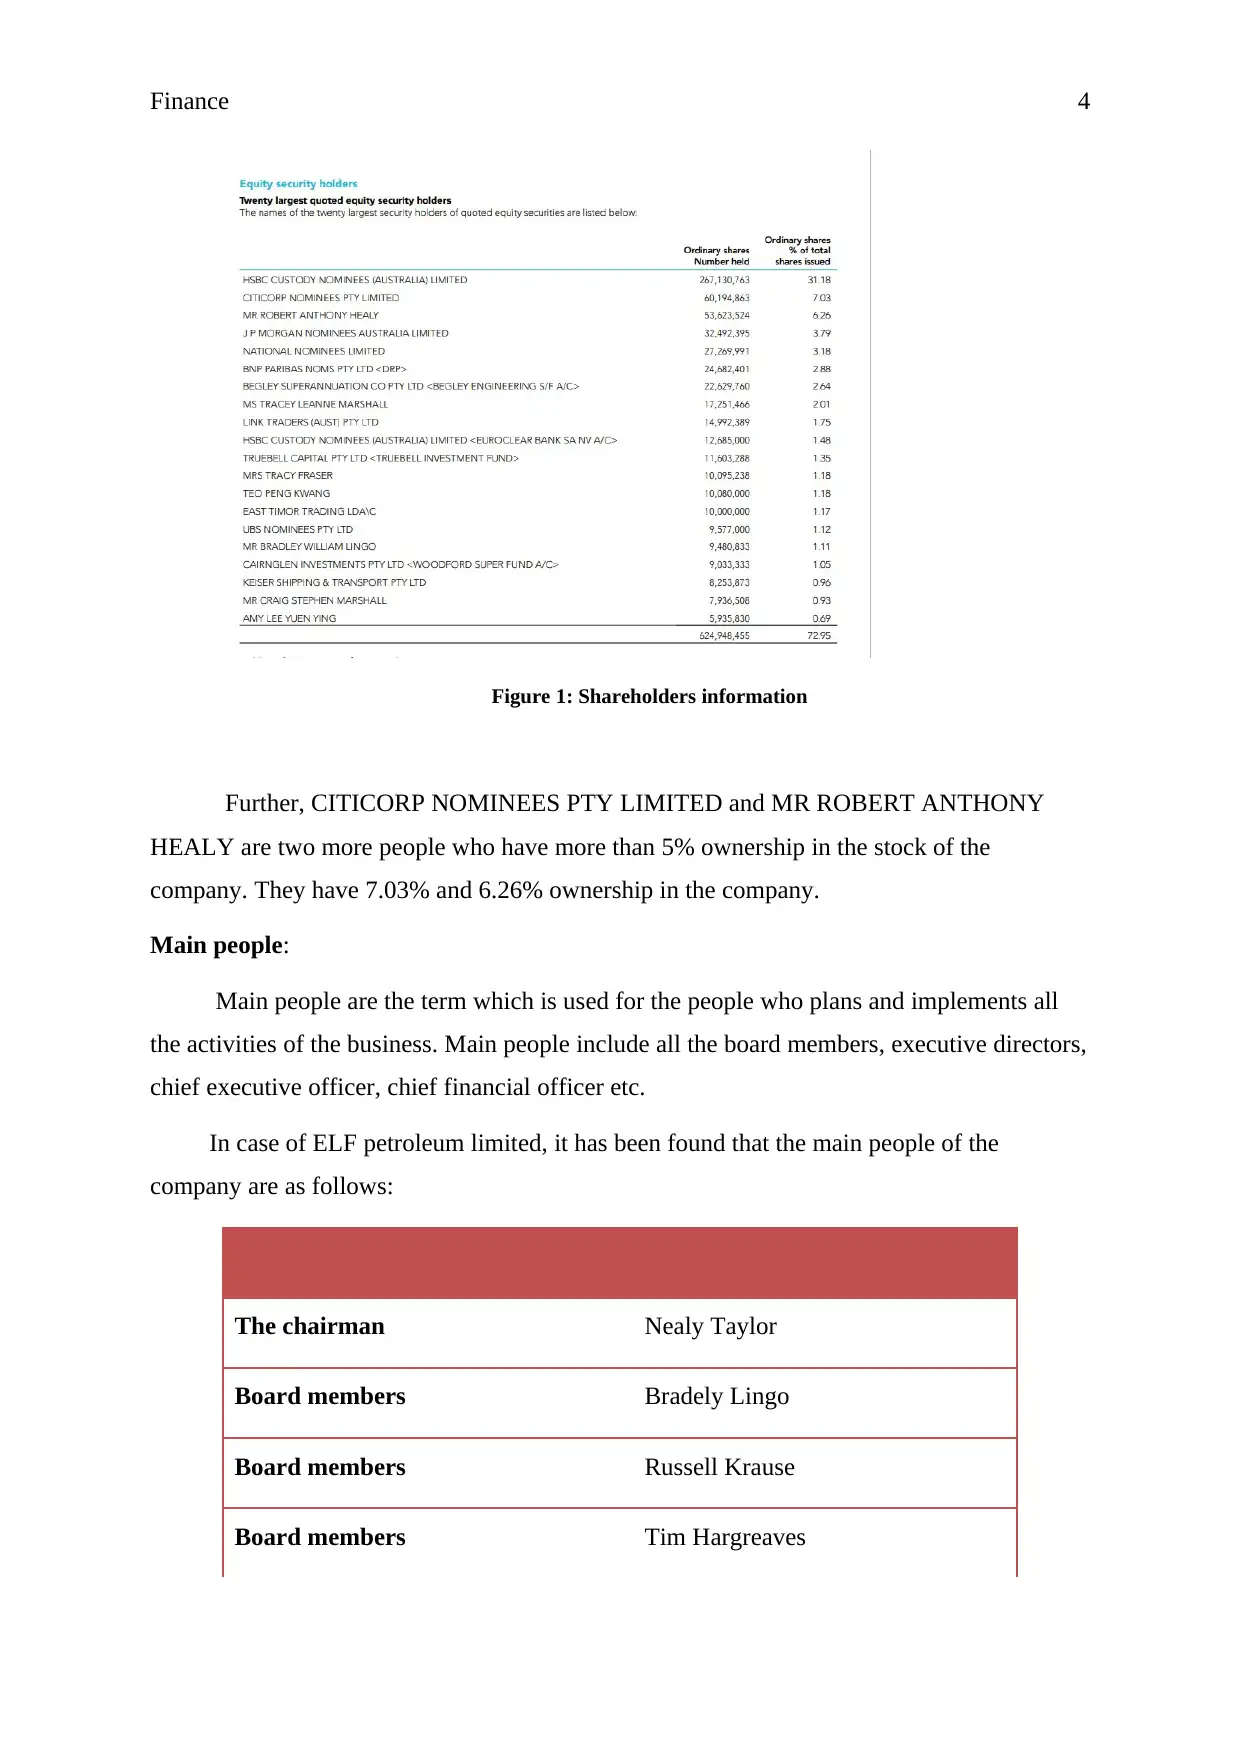
Figure 1: Shareholders information
Further, CITICORP NOMINEES PTY LIMITED and MR ROBERT ANTHONY
HEALY are two more people who have more than 5% ownership in the stock of the
company. They have 7.03% and 6.26% ownership in the company.
Main people:
Main people are the term which is used for the people who plans and implements all
the activities of the business. Main people include all the board members, executive directors,
chief executive officer, chief financial officer etc.
In case of ELF petroleum limited, it has been found that the main people of the
company are as follows:
The chairman Nealy Taylor
Board members Bradely Lingo
Board members Russell Krause
Board members Tim Hargreaves
Paraphrase This Document
Need a fresh take? Get an instant paraphrase of this document with our AI Paraphraser
Finance 5
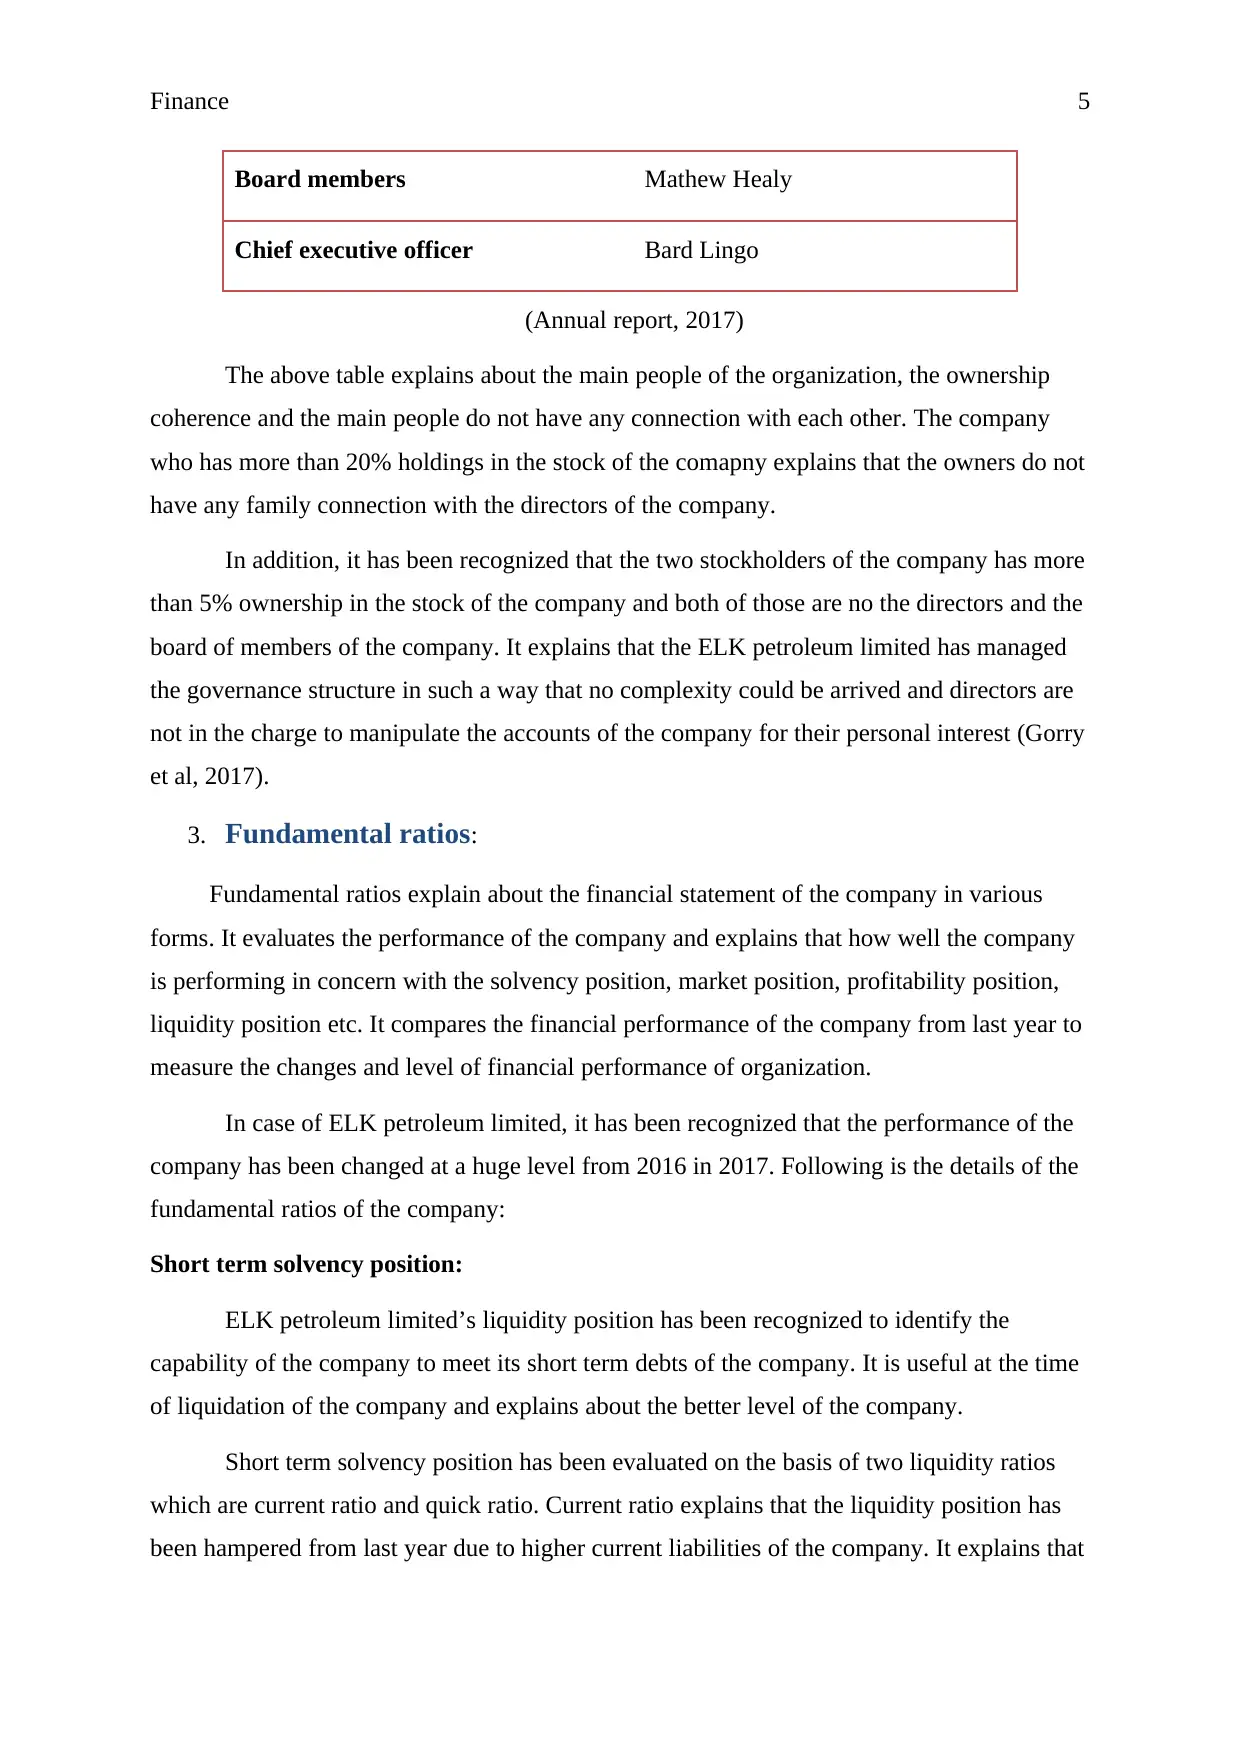
Board members Mathew Healy
Chief executive officer Bard Lingo
(Annual report, 2017)
The above table explains about the main people of the organization, the ownership
coherence and the main people do not have any connection with each other. The company
who has more than 20% holdings in the stock of the comapny explains that the owners do not
have any family connection with the directors of the company.
In addition, it has been recognized that the two stockholders of the company has more
than 5% ownership in the stock of the company and both of those are no the directors and the
board of members of the company. It explains that the ELK petroleum limited has managed
the governance structure in such a way that no complexity could be arrived and directors are
not in the charge to manipulate the accounts of the company for their personal interest (Gorry
et al, 2017).
3. Fundamental ratios:
Fundamental ratios explain about the financial statement of the company in various
forms. It evaluates the performance of the company and explains that how well the company
is performing in concern with the solvency position, market position, profitability position,
liquidity position etc. It compares the financial performance of the company from last year to
measure the changes and level of financial performance of organization.
In case of ELK petroleum limited, it has been recognized that the performance of the
company has been changed at a huge level from 2016 in 2017. Following is the details of the
fundamental ratios of the company:
Short term solvency position:
ELK petroleum limited’s liquidity position has been recognized to identify the
capability of the company to meet its short term debts of the company. It is useful at the time
of liquidation of the company and explains about the better level of the company.
Short term solvency position has been evaluated on the basis of two liquidity ratios
which are current ratio and quick ratio. Current ratio explains that the liquidity position has
been hampered from last year due to higher current liabilities of the company. It explains that
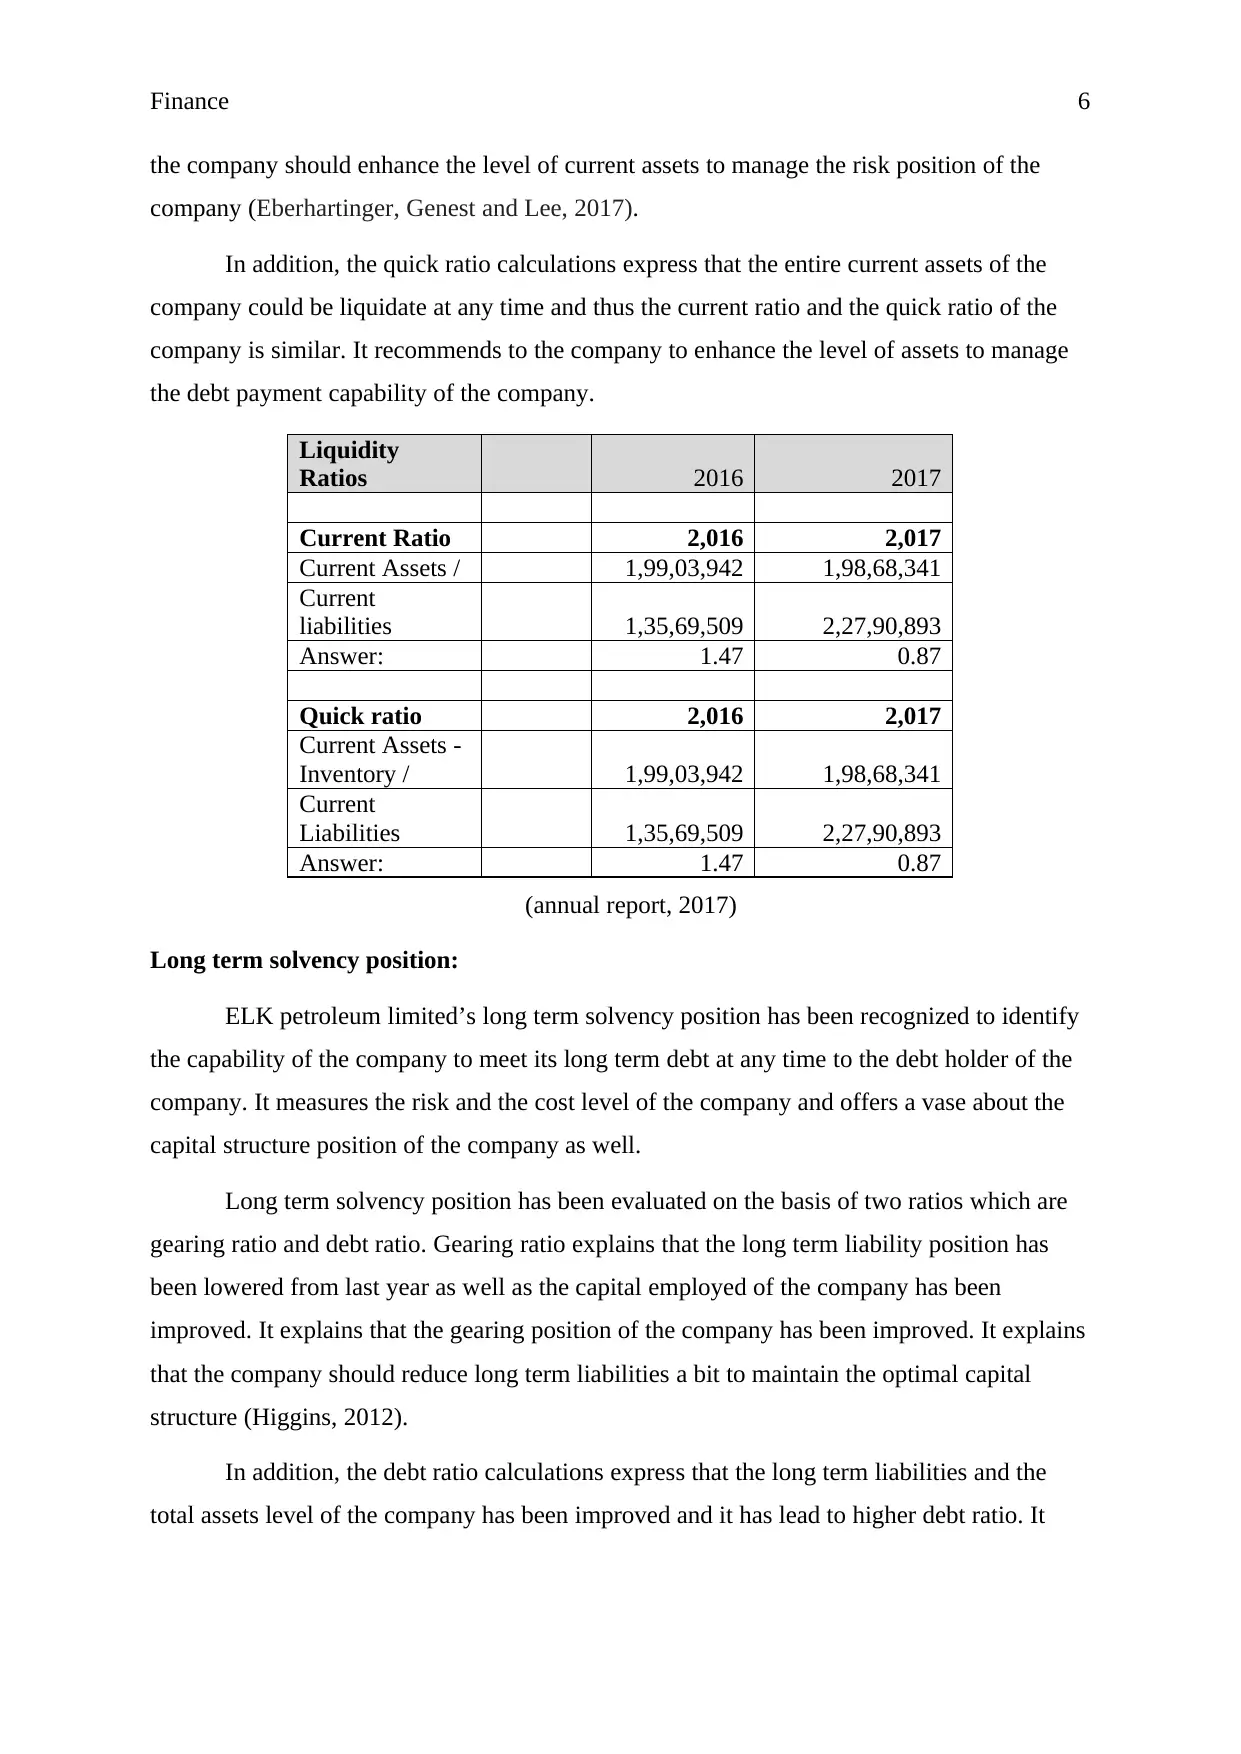
Finance 6
the company should enhance the level of current assets to manage the risk position of the
company (Eberhartinger, Genest and Lee, 2017).
In addition, the quick ratio calculations express that the entire current assets of the
company could be liquidate at any time and thus the current ratio and the quick ratio of the
company is similar. It recommends to the company to enhance the level of assets to manage
the debt payment capability of the company.
Liquidity
Ratios 2016 2017
Current Ratio 2,016 2,017
Current Assets / 1,99,03,942 1,98,68,341
Current
liabilities 1,35,69,509 2,27,90,893
Answer: 1.47 0.87
Quick ratio 2,016 2,017
Current Assets -
Inventory / 1,99,03,942 1,98,68,341
Current
Liabilities 1,35,69,509 2,27,90,893
Answer: 1.47 0.87
(annual report, 2017)
Long term solvency position:
ELK petroleum limited’s long term solvency position has been recognized to identify
the capability of the company to meet its long term debt at any time to the debt holder of the
company. It measures the risk and the cost level of the company and offers a vase about the
capital structure position of the company as well.
Long term solvency position has been evaluated on the basis of two ratios which are
gearing ratio and debt ratio. Gearing ratio explains that the long term liability position has
been lowered from last year as well as the capital employed of the company has been
improved. It explains that the gearing position of the company has been improved. It explains
that the company should reduce long term liabilities a bit to maintain the optimal capital
structure (Higgins, 2012).
In addition, the debt ratio calculations express that the long term liabilities and the
total assets level of the company has been improved and it has lead to higher debt ratio. It
⊘ This is a preview!⊘
Do you want full access?
Subscribe today to unlock all pages.
Trusted by 1+ million students worldwide
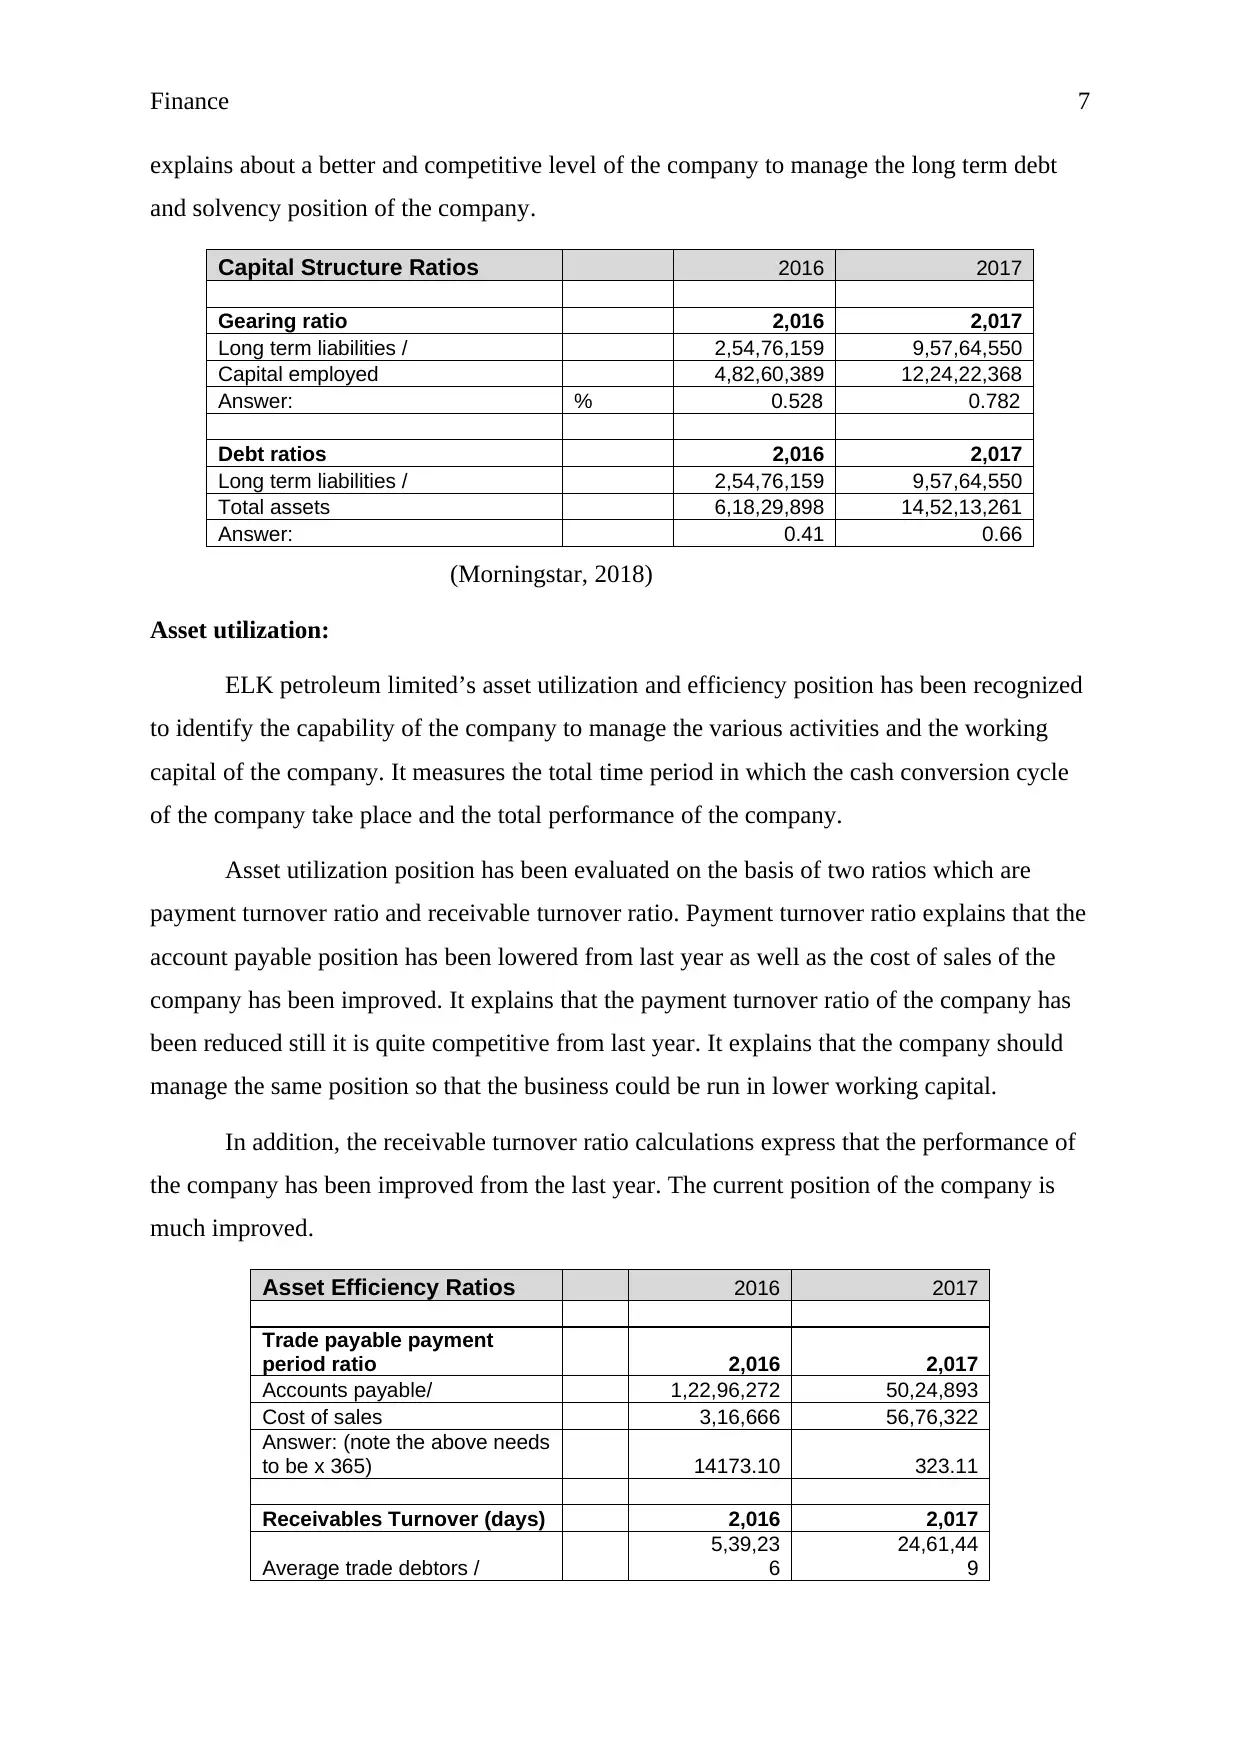
Finance 7
explains about a better and competitive level of the company to manage the long term debt
and solvency position of the company.
Capital Structure Ratios 2016 2017
Gearing ratio 2,016 2,017
Long term liabilities / 2,54,76,159 9,57,64,550
Capital employed 4,82,60,389 12,24,22,368
Answer: % 0.528 0.782
Debt ratios 2,016 2,017
Long term liabilities / 2,54,76,159 9,57,64,550
Total assets 6,18,29,898 14,52,13,261
Answer: 0.41 0.66
(Morningstar, 2018)
Asset utilization:
ELK petroleum limited’s asset utilization and efficiency position has been recognized
to identify the capability of the company to manage the various activities and the working
capital of the company. It measures the total time period in which the cash conversion cycle
of the company take place and the total performance of the company.
Asset utilization position has been evaluated on the basis of two ratios which are
payment turnover ratio and receivable turnover ratio. Payment turnover ratio explains that the
account payable position has been lowered from last year as well as the cost of sales of the
company has been improved. It explains that the payment turnover ratio of the company has
been reduced still it is quite competitive from last year. It explains that the company should
manage the same position so that the business could be run in lower working capital.
In addition, the receivable turnover ratio calculations express that the performance of
the company has been improved from the last year. The current position of the company is
much improved.
Asset Efficiency Ratios 2016 2017
Trade payable payment
period ratio 2,016 2,017
Accounts payable/ 1,22,96,272 50,24,893
Cost of sales 3,16,666 56,76,322
Answer: (note the above needs
to be x 365) 14173.10 323.11
Receivables Turnover (days) 2,016 2,017
Average trade debtors /
5,39,23
6
24,61,44
9
Paraphrase This Document
Need a fresh take? Get an instant paraphrase of this document with our AI Paraphraser
Finance 8
Sales revenue (note used
operating revenue)
#
days
47,67
3
64,31,32
4
Answer: (note the above needs to
be x 365) 4128.57 139.70
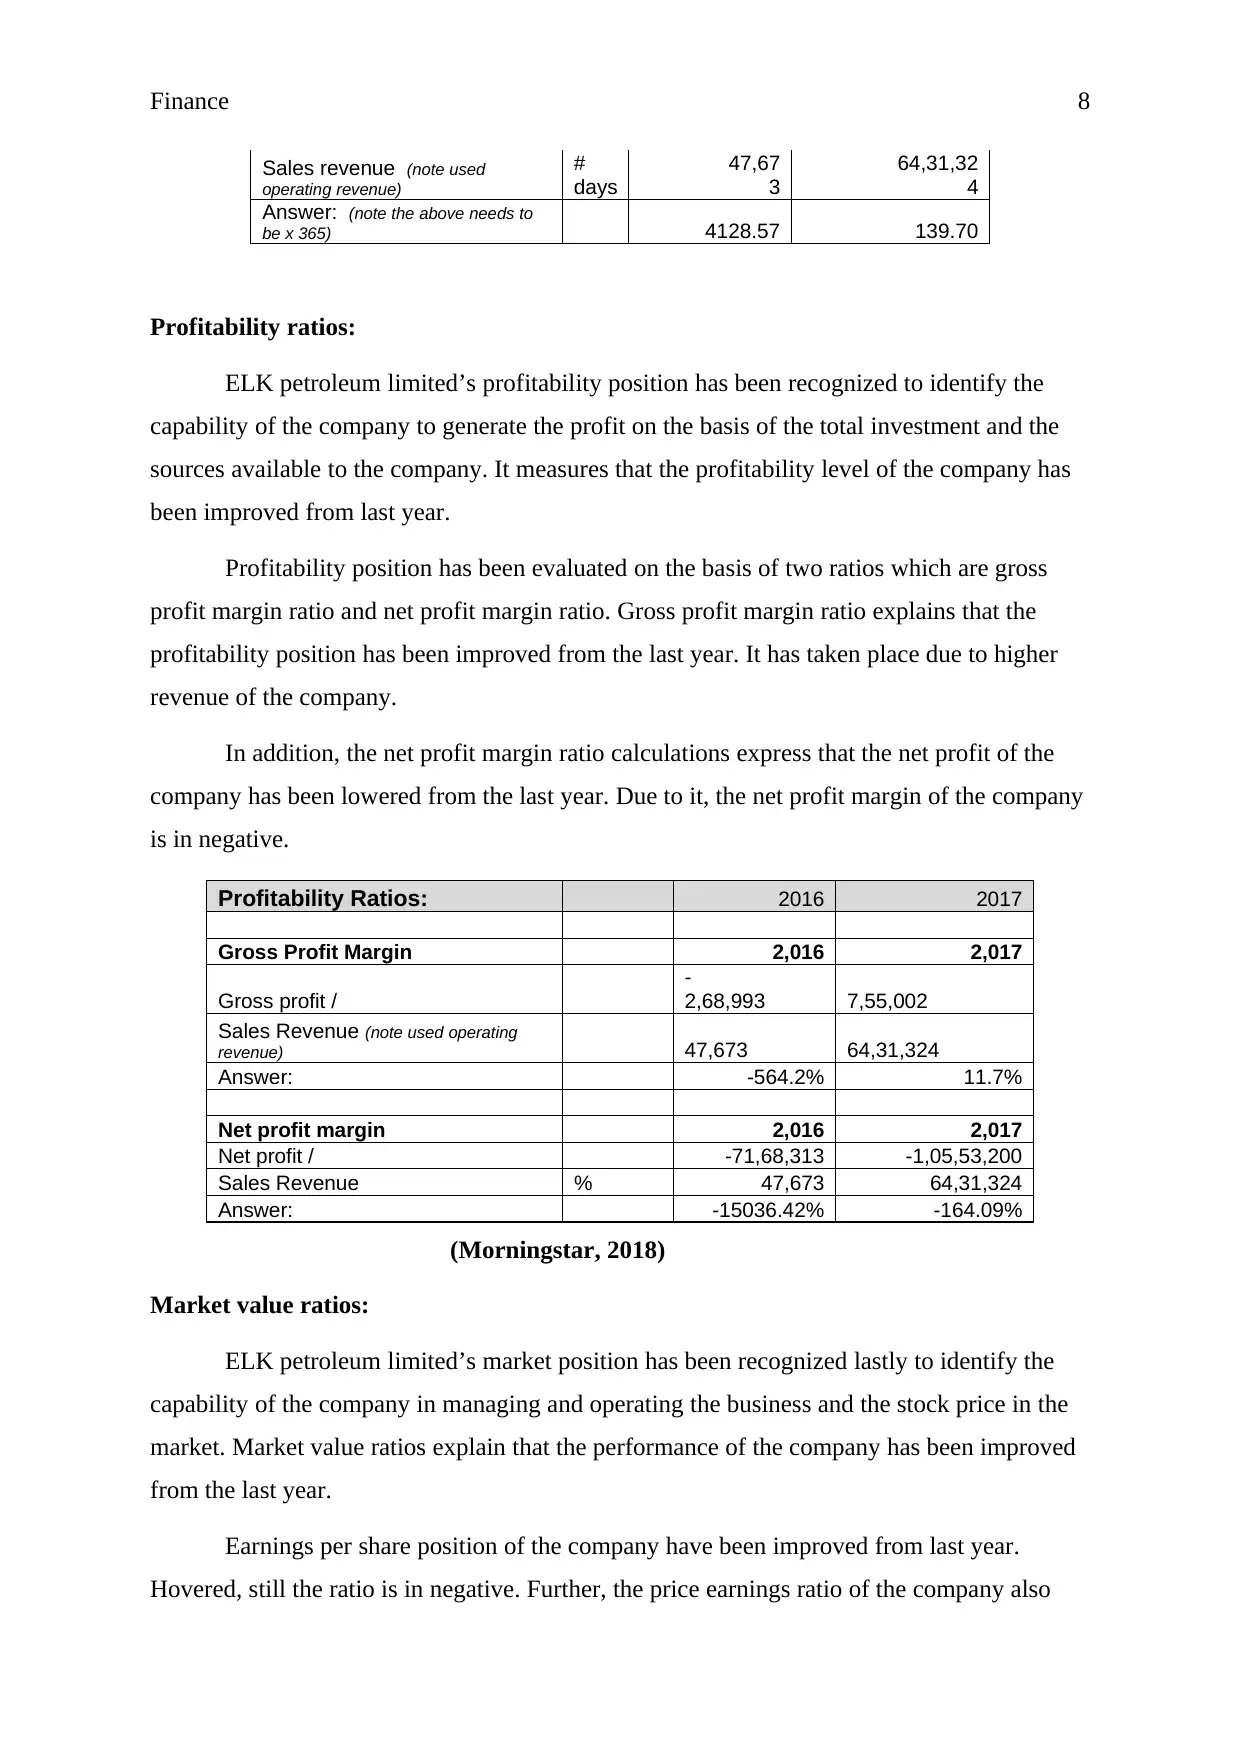
Profitability ratios:
ELK petroleum limited’s profitability position has been recognized to identify the
capability of the company to generate the profit on the basis of the total investment and the
sources available to the company. It measures that the profitability level of the company has
been improved from last year.
Profitability position has been evaluated on the basis of two ratios which are gross
profit margin ratio and net profit margin ratio. Gross profit margin ratio explains that the
profitability position has been improved from the last year. It has taken place due to higher
revenue of the company.
In addition, the net profit margin ratio calculations express that the net profit of the
company has been lowered from the last year. Due to it, the net profit margin of the company
is in negative.
Profitability Ratios: 2016 2017
Gross Profit Margin 2,016 2,017
Gross profit /
-
2,68,993 7,55,002
Sales Revenue (note used operating
revenue) 47,673 64,31,324
Answer: -564.2% 11.7%
Net profit margin 2,016 2,017
Net profit / -71,68,313 -1,05,53,200
Sales Revenue % 47,673 64,31,324
Answer: -15036.42% -164.09%
(Morningstar, 2018)
Market value ratios:
ELK petroleum limited’s market position has been recognized lastly to identify the
capability of the company in managing and operating the business and the stock price in the
market. Market value ratios explain that the performance of the company has been improved
from the last year.
Earnings per share position of the company have been improved from last year.
Hovered, still the ratio is in negative. Further, the price earnings ratio of the company also
Sales revenue (note used
operating revenue)
#
days
47,67
3
64,31,32
4
Answer: (note the above needs to
be x 365) 4128.57 139.70
Profitability ratios:
ELK petroleum limited’s profitability position has been recognized to identify the
capability of the company to generate the profit on the basis of the total investment and the
sources available to the company. It measures that the profitability level of the company has
been improved from last year.
Profitability position has been evaluated on the basis of two ratios which are gross
profit margin ratio and net profit margin ratio. Gross profit margin ratio explains that the
profitability position has been improved from the last year. It has taken place due to higher
revenue of the company.
In addition, the net profit margin ratio calculations express that the net profit of the
company has been lowered from the last year. Due to it, the net profit margin of the company
is in negative.
Profitability Ratios: 2016 2017
Gross Profit Margin 2,016 2,017
Gross profit /
-
2,68,993 7,55,002
Sales Revenue (note used operating
revenue) 47,673 64,31,324
Answer: -564.2% 11.7%
Net profit margin 2,016 2,017
Net profit / -71,68,313 -1,05,53,200
Sales Revenue % 47,673 64,31,324
Answer: -15036.42% -164.09%
(Morningstar, 2018)
Market value ratios:
ELK petroleum limited’s market position has been recognized lastly to identify the
capability of the company in managing and operating the business and the stock price in the
market. Market value ratios explain that the performance of the company has been improved
from the last year.
Earnings per share position of the company have been improved from last year.
Hovered, still the ratio is in negative. Further, the price earnings ratio of the company also
Finance 9
explains about the negative amount and shows about the bad performance of the company in
the market.
Market value Ratios 2016 2017
Earnings per share 2,016 2,017
Net income -71,68,313 -1,05,53,200
Weighted average shares
outstanding 26,31,76,566 81,98,95,342
Answer: -0.027 -0.013
Price earnings ratio 2,016 2,017
Price per share / -0.01
Earnings per share 0.75
Answer: -0.017
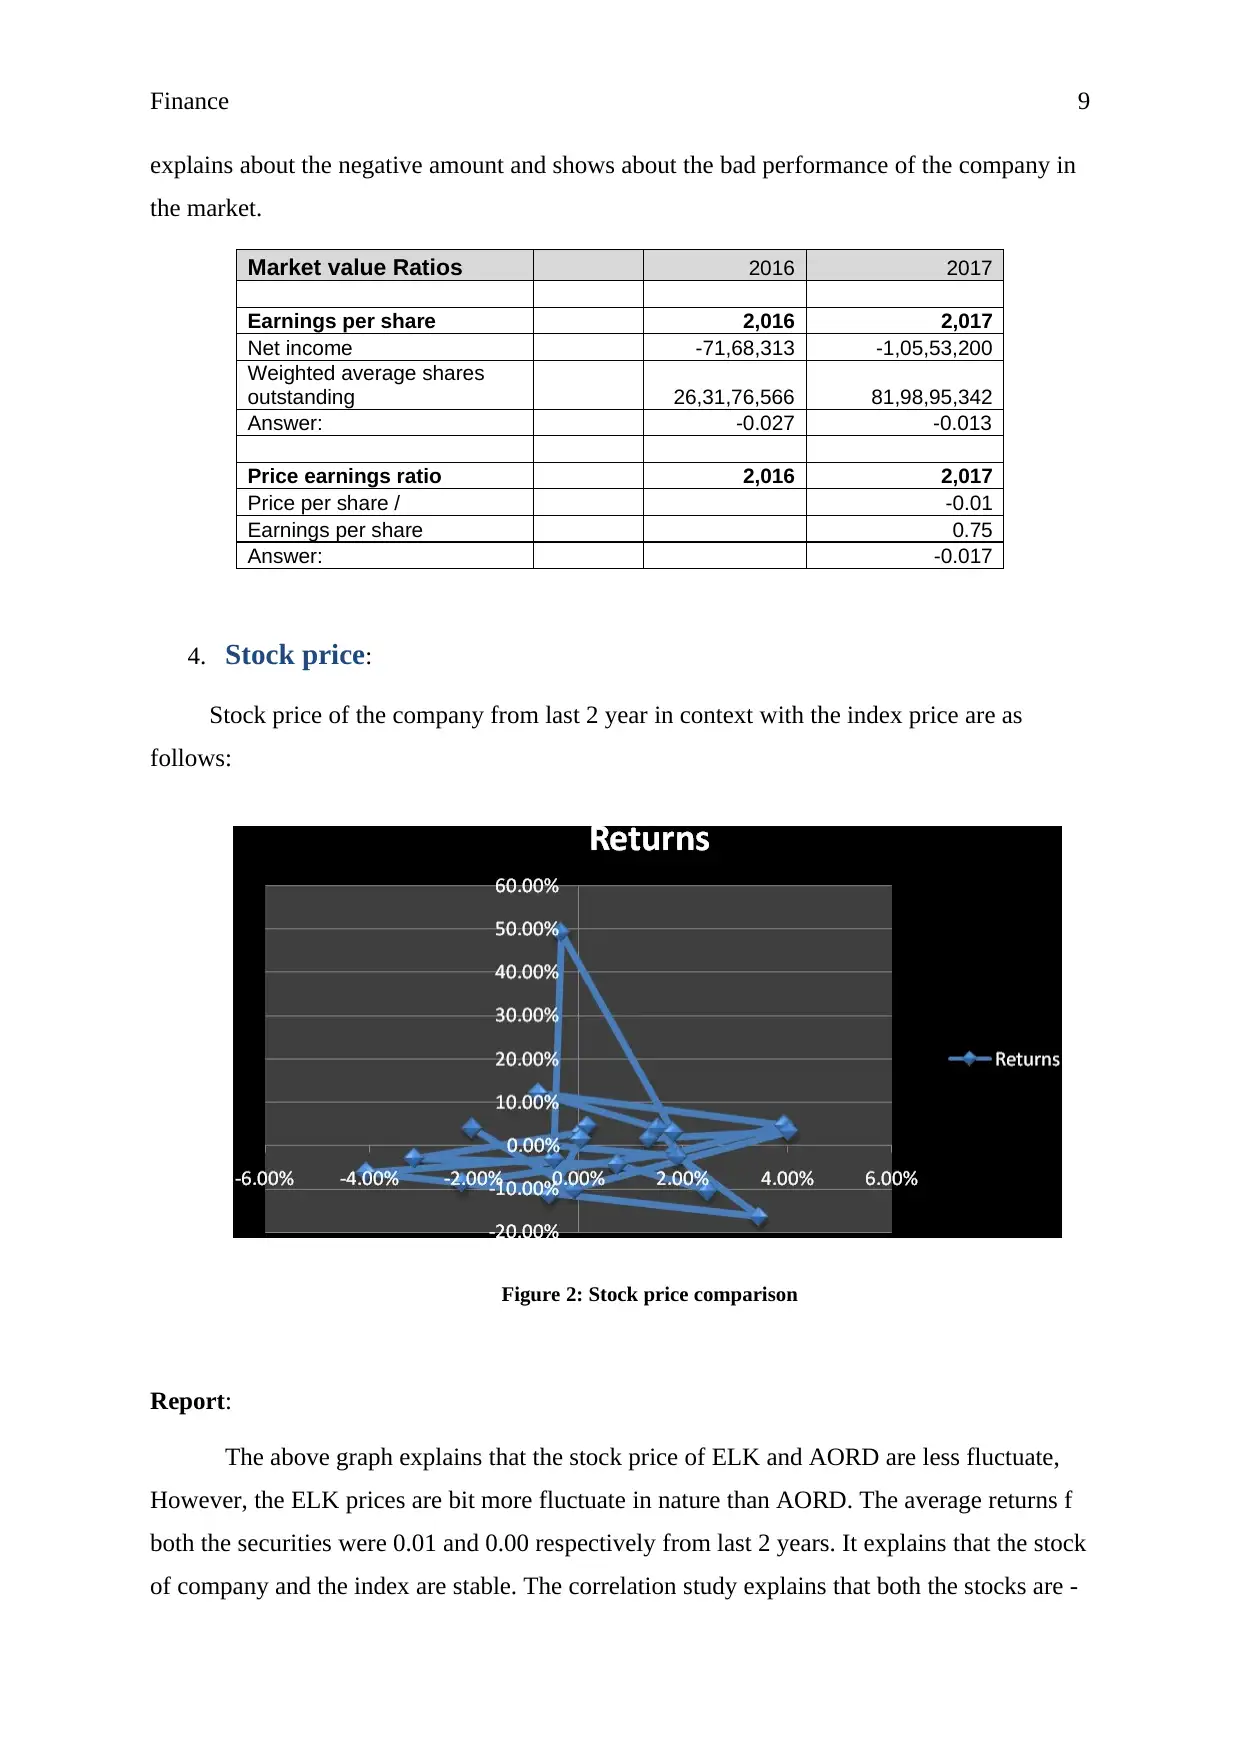
4. Stock price:
Stock price of the company from last 2 year in context with the index price are as
follows:
Figure 2: Stock price comparison
Report:
The above graph explains that the stock price of ELK and AORD are less fluctuate,
However, the ELK prices are bit more fluctuate in nature than AORD. The average returns f
both the securities were 0.01 and 0.00 respectively from last 2 years. It explains that the stock
of company and the index are stable. The correlation study explains that both the stocks are -
explains about the negative amount and shows about the bad performance of the company in
the market.
Market value Ratios 2016 2017
Earnings per share 2,016 2,017
Net income -71,68,313 -1,05,53,200
Weighted average shares
outstanding 26,31,76,566 81,98,95,342
Answer: -0.027 -0.013
Price earnings ratio 2,016 2,017
Price per share / -0.01
Earnings per share 0.75
Answer: -0.017
4. Stock price:
Stock price of the company from last 2 year in context with the index price are as
follows:
Figure 2: Stock price comparison
Report:
The above graph explains that the stock price of ELK and AORD are less fluctuate,
However, the ELK prices are bit more fluctuate in nature than AORD. The average returns f
both the securities were 0.01 and 0.00 respectively from last 2 years. It explains that the stock
of company and the index are stable. The correlation study explains that both the stocks are -
⊘ This is a preview!⊘
Do you want full access?
Subscribe today to unlock all pages.
Trusted by 1+ million students worldwide
Finance 10
0.04 correlated to each other which explain about the negative relationship of both the stock
(Brigham and Ehrhardt, 2013).
Further, it has been measured that the stock price of Elk is not driven the stock price f
AORD. AORD stocks are driven by one of the largest company of stock exchange only. It
leads to the conclusion that the stocks are not related to each other.
5. Changes into the stock price:
On the basis of stock price of last 2 years of the company, it has been measured that the
company has faced various sudden changes into the last 2 years (Yahoo finance, 2018). The
changes have occurred because of various reasons which are internal as well as external
factors. Such as, on 31-8-2016 and 30-9-2016, the company has faced huge decrement in the
stock price of the company. Financial times (2018) explains that these changes have occurred
due to loss of the company in its new project.
Further, on 31-8-2017, the stock price of the company has again lowered due to
dividend announcement of the company. The company has announced fewer amounts than
expected (AFR, 2018). However, on 31-12-2017, stock price has been improved by 449.25%
because of new project announcement and industry changes (Bloomberg, 2018). It also
explains that the current stock price of the company is quite better from last 2 years and
explains about the average performance of the company.
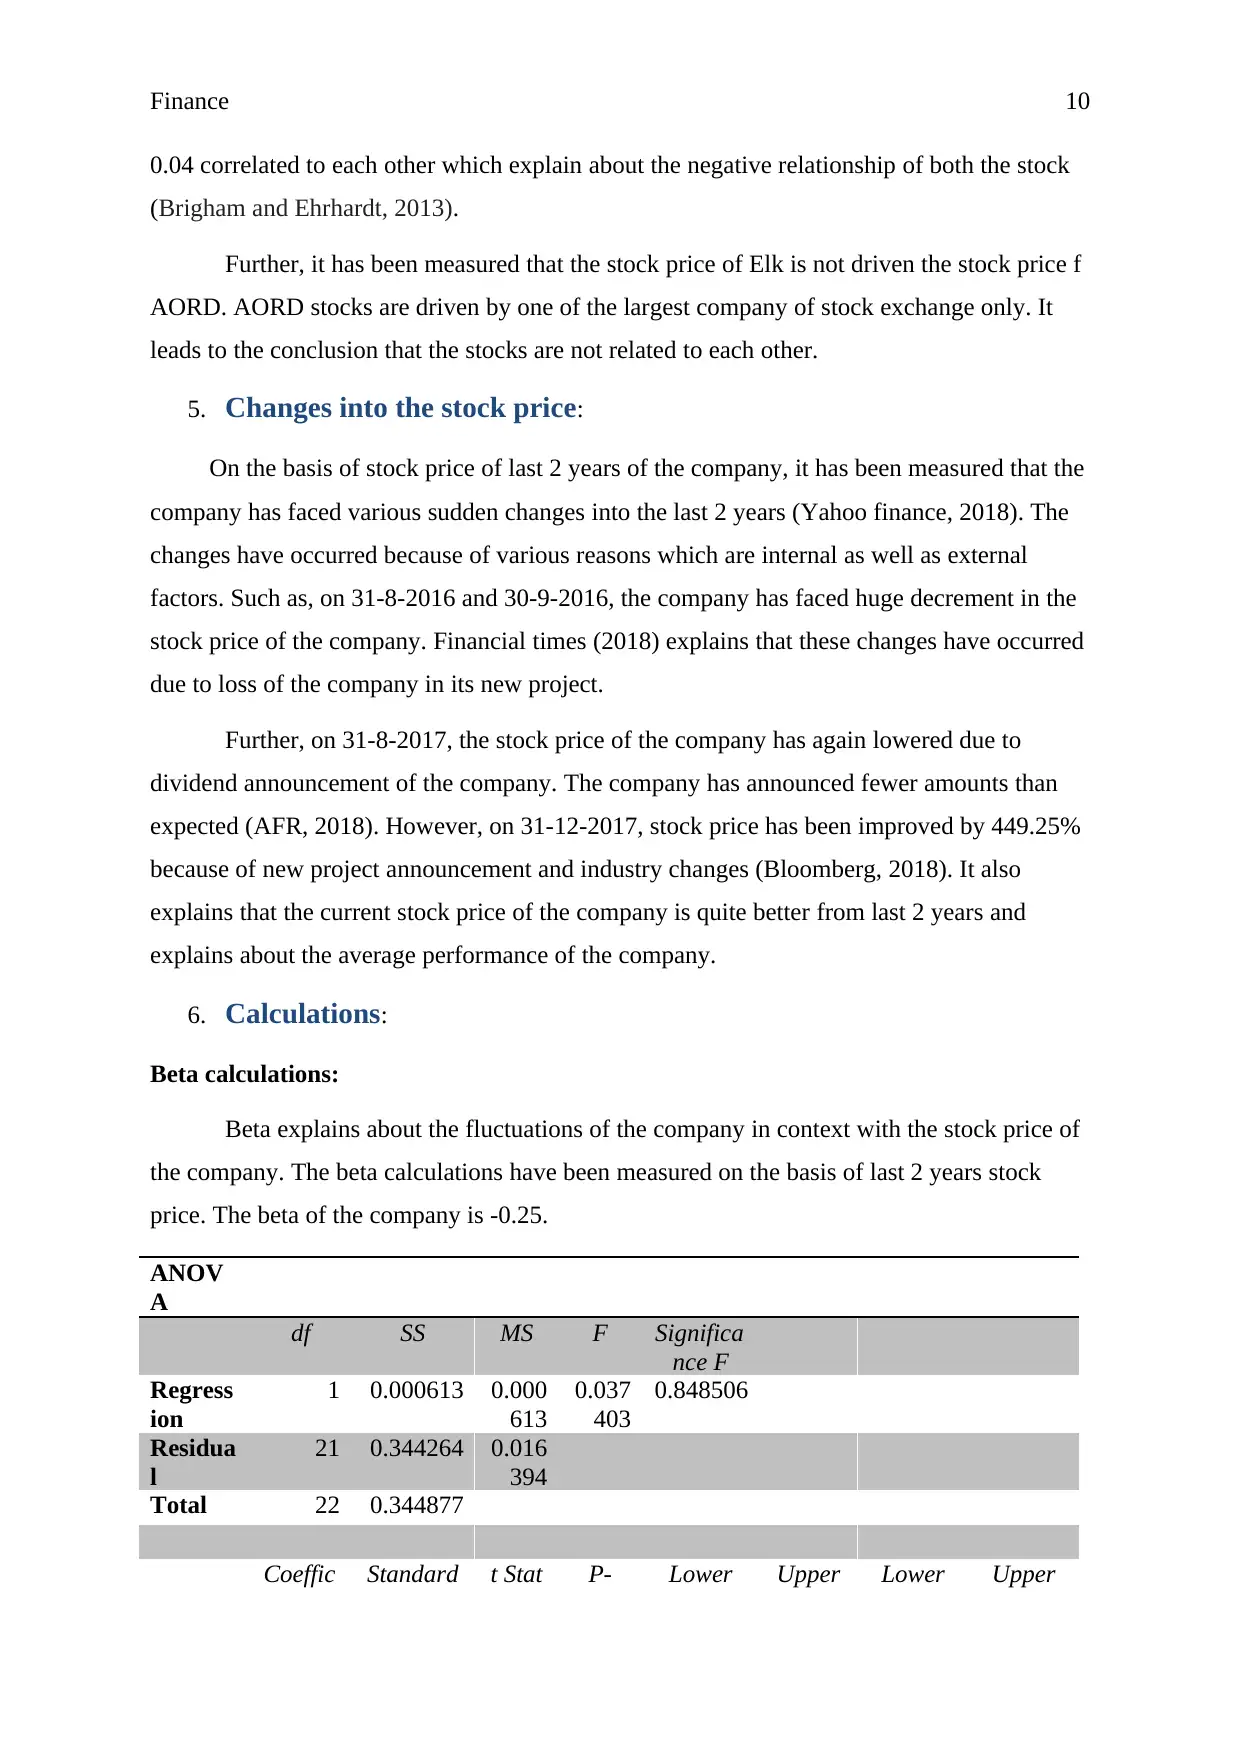
6. Calculations:
Beta calculations:
Beta explains about the fluctuations of the company in context with the stock price of
the company. The beta calculations have been measured on the basis of last 2 years stock
price. The beta of the company is -0.25.
ANOV
A
df SS MS F Significa
nce F
Regress
ion
1 0.000613 0.000
613
0.037
403
0.848506
Residua
l
21 0.344264 0.016
394
Total 22 0.344877
Coeffic Standard t Stat P- Lower Upper Lower Upper
0.04 correlated to each other which explain about the negative relationship of both the stock
(Brigham and Ehrhardt, 2013).
Further, it has been measured that the stock price of Elk is not driven the stock price f
AORD. AORD stocks are driven by one of the largest company of stock exchange only. It
leads to the conclusion that the stocks are not related to each other.
5. Changes into the stock price:
On the basis of stock price of last 2 years of the company, it has been measured that the
company has faced various sudden changes into the last 2 years (Yahoo finance, 2018). The
changes have occurred because of various reasons which are internal as well as external
factors. Such as, on 31-8-2016 and 30-9-2016, the company has faced huge decrement in the
stock price of the company. Financial times (2018) explains that these changes have occurred
due to loss of the company in its new project.
Further, on 31-8-2017, the stock price of the company has again lowered due to
dividend announcement of the company. The company has announced fewer amounts than
expected (AFR, 2018). However, on 31-12-2017, stock price has been improved by 449.25%
because of new project announcement and industry changes (Bloomberg, 2018). It also
explains that the current stock price of the company is quite better from last 2 years and
explains about the average performance of the company.
6. Calculations:
Beta calculations:
Beta explains about the fluctuations of the company in context with the stock price of
the company. The beta calculations have been measured on the basis of last 2 years stock
price. The beta of the company is -0.25.
ANOV
A
df SS MS F Significa
nce F
Regress
ion
1 0.000613 0.000
613
0.037
403
0.848506
Residua
l
21 0.344264 0.016
394
Total 22 0.344877
Coeffic Standard t Stat P- Lower Upper Lower Upper
Paraphrase This Document
Need a fresh take? Get an instant paraphrase of this document with our AI Paraphraser
Finance 11
ients Error value 95% 95% 95.0% 95.0%
Interce
pt
0.0067
76
0.027192 0.249
179
0.805
643
-0.04977 0.0633
24
-
0.04977
0.06332
4
X
Variabl
e 1
-
0.2500
5
1.292927 -
0.193
4
0.848
506
-2.93884 2.4387
39
-
2.93884
2.43873
9
CAPM:
In addition, the CAPM of the company has been evaluated which explains about the
3.5% return from the equity of the company.
Calculation of cost of equity (CAPM)
Risk free rate = 4.00%
RM = 6.00%
Beta = -0.250
Required rate of return = 4% + (6%-4%) * -0.25
3.50%
Conservative company:
The evaluation explains that the beta of the company is lower and explains about the
less fluctuation of the company whereas the cost of equity of the company is also lesser and
explains that the risk and the return from the equity of the company is average and thus the
company is a conservative one to make investments (Gibson, 2011).
7. WACC:
WACC of the company has been calculated to measure the total cost of the company
and the discount factor of the company. The WACC has been calculated on the basis of the
cost of debt and cost of equity of the company. Above calculations explains that the cost of
equity of the company is 3.5% and the cost of debt of the company is as follows:
Calculation of cost of debt
Outstanding debt = 7,25,87,986
interest rate = 6.50%
Finance 12
Tax rate = 30.0%
Kd = 6.5%*(1-30%)
= 4.55%
It explains that the cost of debt of the company is 4.55%. Further, it explains that the
weighted average cost of capital of the company is as follows:
WACC = rD (1- Tc )*( D / V )+ rE *( E / V )
WACC = 6.5%*(1-30%) * (72587896/99245804) + 3.5% * (26657818/ 99245804)
= 4.555 * 73.14% + 3.5% * 26.86%
= 4.27% (Halili, Saleh and Zeitun, 2015)
It explains that the weighted average cost of capital of the company is 4.27%.
Implications:
The WACC of the company is 4.27% which explains that the company has to pay to
the debt holder and the shareholders of the company 4.27%. It explains that it becomes
important for the company to generate 4.27% of total capital to pay the entire interest and
dividend amount to the revenant party. Thus, before making an investment, company should
evaluate the project and identify that whether the company would be able to generate profit
more than 4.27% or not. If the company is able to make profit more than 4.27% then only the
company should invest into the project.
8. Debt ratio:
Optimal capital structure:
Optimal capital structure is the point of capital structure of the company where the
risk and the cost of the company are balanced. The current capital structure of the company
has been improved from last year and explains about 66% of long term liabilities against the
total assets of the company. The capital structure of the company is not stable. It explains that
the company is required to make the debt ratio 55% so that the risk and cost of the company
could be managed.
Debt ratios 2,016 2,017
Long term liabilities / 2,54,76,159 9,57,64,550
Total assets 6,18,29,898 14,52,13,261
Answer: 0.41 0.66
(Monringstar, 2018)
⊘ This is a preview!⊘
Do you want full access?
Subscribe today to unlock all pages.
Trusted by 1+ million students worldwide
1 out of 19
Related Documents


Your All-in-One AI-Powered Toolkit for Academic Success.
+13062052269
info@desklib.com
Available 24*7 on WhatsApp / Email
![[object Object]](/_next/static/media/star-bottom.7253800d.svg)
Unlock your academic potential
Copyright © 2020–2026 A2Z Services. All Rights Reserved. Developed and managed by ZUCOL.