HI5002 Finance for Business: AMP Limited Financial Case Study 2018
VerifiedAdded on 2023/06/11
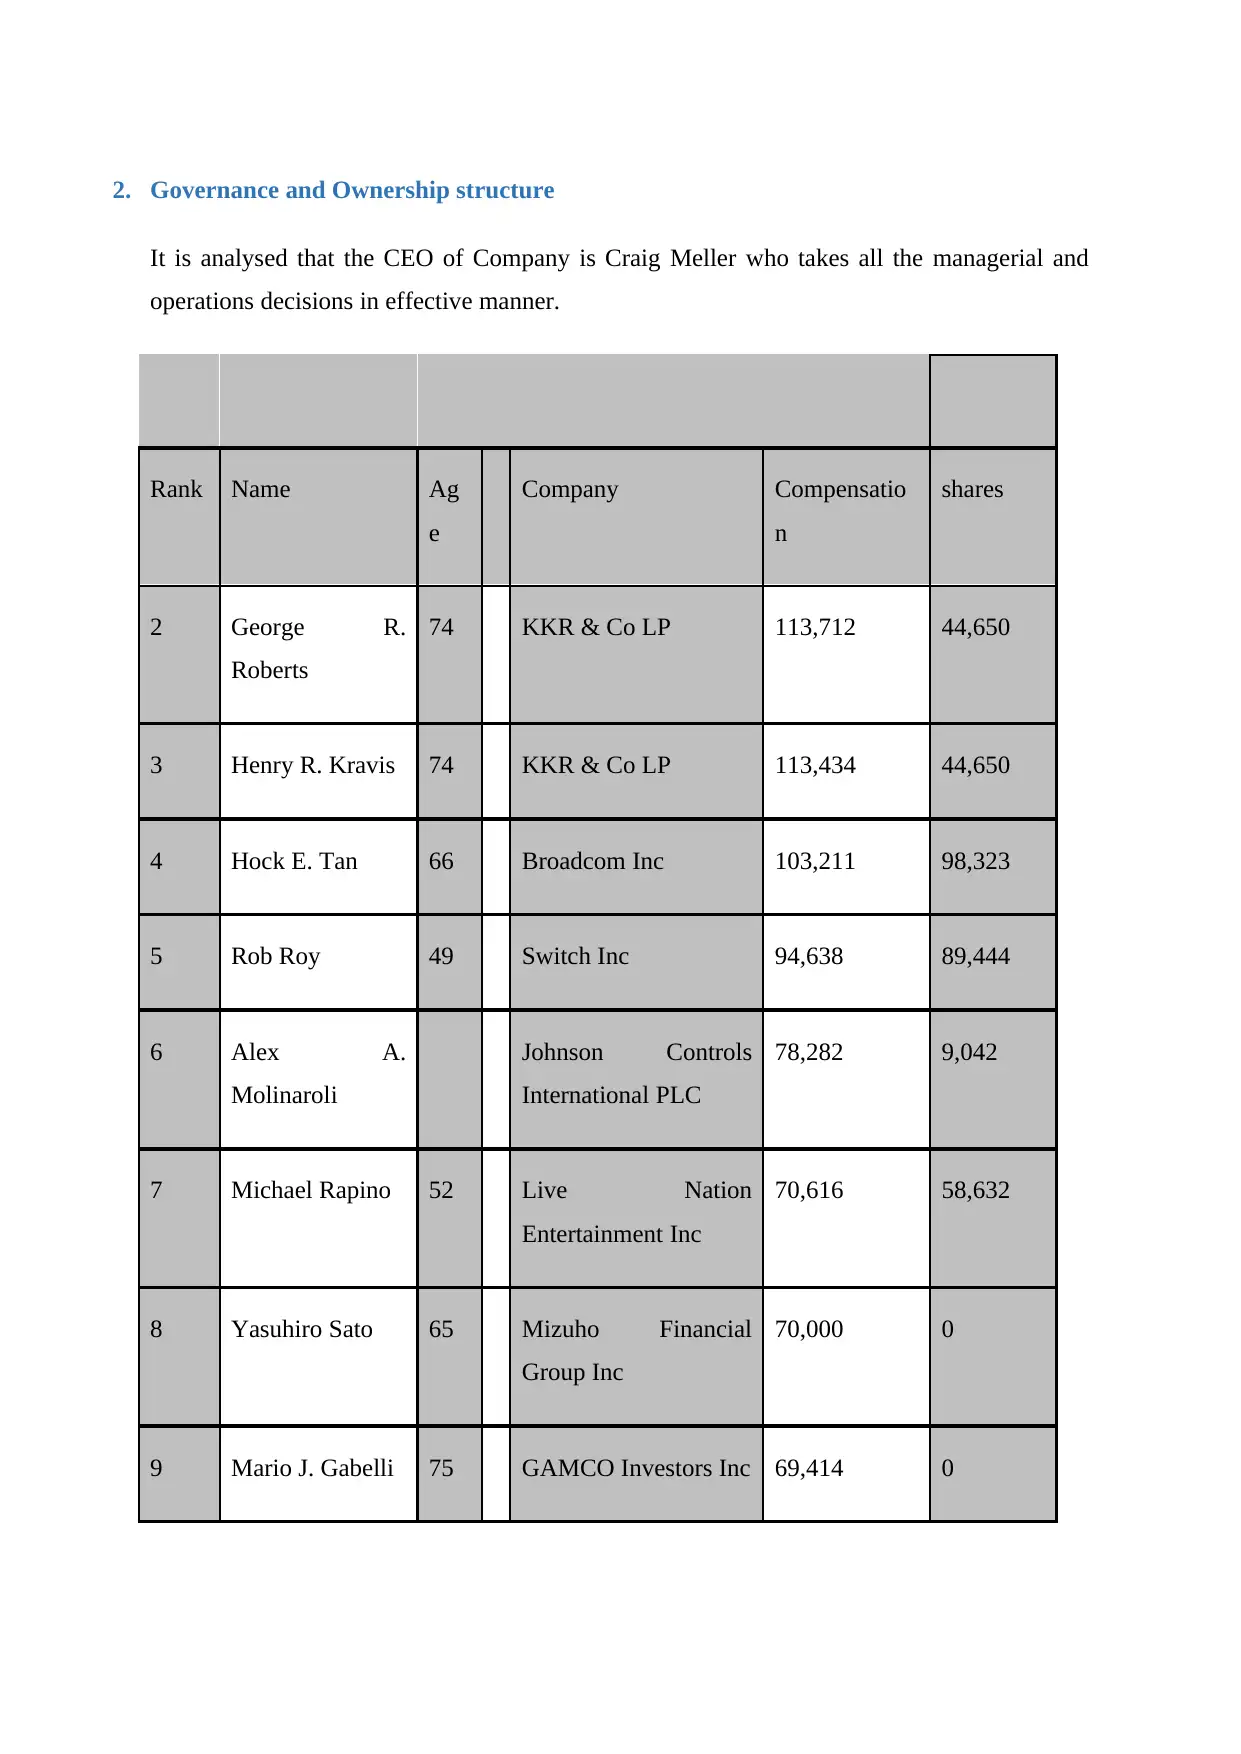
|26
|4410
|157
Case Study
AI Summary
This document presents a financial analysis of AMP Limited, an Australian financial services company, using various financial tools and techniques. It includes a description of the company, its governance and ownership structure, and a detailed performance ratio analysis covering short-term solvency, long-term solvency, asset utilization, profitability, and market value ratios. The analysis incorporates share price graphs, announcements affecting share price, beta calculation, required rate of return computation using CAPM, investment method determination, and weighted average cost of capital calculation. The report also considers the company's debt ratio and dividend policies, concluding with a letter of recommendation based on the findings. The analysis indicates areas for improvement in AMP Limited's financial management.
1 out of 26
Related Documents


Your All-in-One AI-Powered Toolkit for Academic Success.
+13062052269
info@desklib.com
Available 24*7 on WhatsApp / Email
![[object Object]](/_next/static/media/star-bottom.7253800d.svg)
Copyright © 2020–2026 A2Z Services. All Rights Reserved. Developed and managed by ZUCOL.