Financial Performance Analysis of Green Power Energy Ltd - HI5002
VerifiedAdded on 2023/06/12
|21
|4243
|466
Case Study
AI Summary
This report analyzes the financial performance of Green Power Energy Limited using various financial tools such as ratio analysis, DuPont analysis, capital budgeting, and WACC. The analysis covers governance and ownership structure, short-term and long-term solvency ratios, asset utilization, profitability ratios, and market value ratios. The report also includes a share price graph, announcements affecting the share price, beta calculation, computation of the required rate of return using the CAPM method, investment strategy, and computation of the weighted average cost of capital. The findings indicate that Green Power Energy Limited has been facing challenges, with negative business outcomes and a declining share price, suggesting potential business destruction in the long run.
RUNNING HEAD: Financial accounting of Green Power Energy Limited
1
Name of the student
Topic- a Financial accounting of Green Power Energy Limited
University name
1
Name of the student
Topic- a Financial accounting of Green Power Energy Limited
University name
Paraphrase This Document
Need a fresh take? Get an instant paraphrase of this document with our AI Paraphraser
Table of Contents
Introduction...........................................................................................................................................3
1. Description of Green Power Energy Limited.............................................................................3
2. Governance and Ownership structure............................................................................................4
3. Performance ratio analysis of Green Power Energy Limited.........................................................5
Short term solvency ratio...................................................................................................................5
Proving the equation.........................................................................................................................6
Long term Solvency ratios.................................................................................................................6
Asset utilization.................................................................................................................................7
Profitability ratios..............................................................................................................................8
Market value ratios..........................................................................................................................10
4. Share price graph of the Green Power Energy Limited................................................................11
4.1 Graph reflecting the share price movement of Green Power Energy Limited and All ordinary
share price index.............................................................................................................................11
4.2 The comparison between the Share price movement of Green Power Energy Limited and share
price movement of all ordinary stock exchange...............................................................................11
5. Announcements...........................................................................................................................13
6. Research via internet....................................................................................................................13
6.1 Beta calculation...................................................................................................................13
6.2 Computation of required rate of return by using CAPM method...............................................14
6.3 Determining the investment method (Conservative investment)................................................15
7. Computation of the weighted average cost of capital...................................................................15
7.1 Computed Cost of Capital through Capital Assets Pricing model........................................15
7.2 Implications that a higher WACC on investment decision........................................................16
8. Debt ratio consideration of Green Power Energy Limited...........................................................16
8.1 Stable Debt to equity ratio of company..........................................................................................16
Dividend policies of company..............................................................................................................17
Letter of recommendation..................................................................................................................18
Conclusion...........................................................................................................................................18
9. References...................................................................................................................................19
10. Appendix.................................................................................................................................20
Financial accounting of Green Power Energy Limited 3
Introduction
There are several internal and external factors which affect the present and future condition of
the corporate. In this report, several financial tools such as ratio analysis, du Pont analysis,
capital budgeting, and WACC methods have been used to identify whether the company has
been performing well in market or not. In this report, financial analysis tools have been used
to gauge the financial performance of financial accounting of Green Power Energy Limited.
The main outcome of this report is that Green Power Energy Limited has destructed its
business in the long run and resulted in the negative business throughout the time.
⊘ This is a preview!⊘
Do you want full access?
Subscribe today to unlock all pages.
Trusted by 1+ million students worldwide
1. Description of Green Power Energy Limited
Green Power Energy Limited is an Australian company which is indulged in providing
energy and search and development of coal to liquid project in Australia. It has several other
subsidies which are engaged in providing energy support program to other corporations on a
commercial level (Green Power Energy Limited (2018).
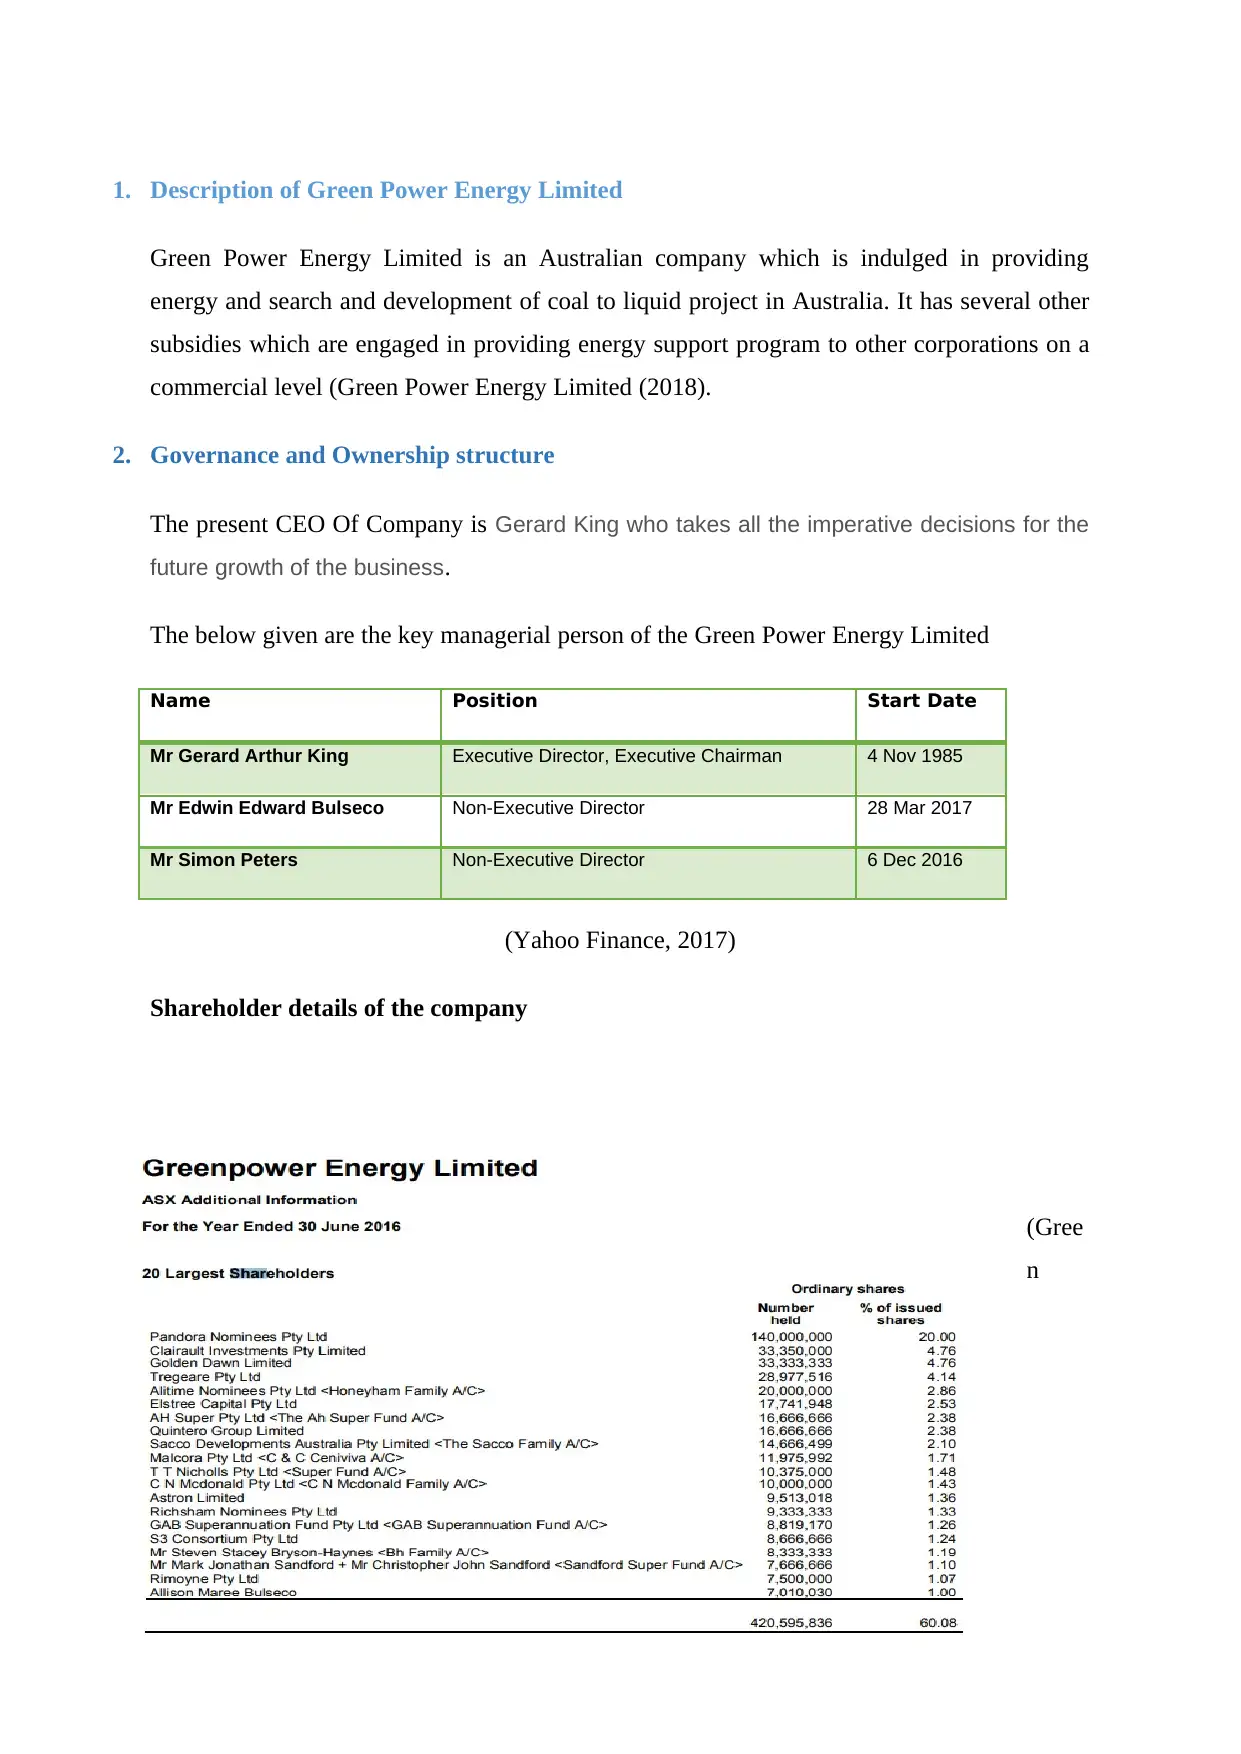
2. Governance and Ownership structure
The present CEO Of Company is Gerard King who takes all the imperative decisions for the
future growth of the business.
The below given are the key managerial person of the Green Power Energy Limited
Name Position Start Date
Mr Gerard Arthur King Executive Director, Executive Chairman 4 Nov 1985
Mr Edwin Edward Bulseco Non-Executive Director 28 Mar 2017
Mr Simon Peters Non-Executive Director 6 Dec 2016
(Yahoo Finance, 2017)
Shareholder details of the company
(Gree
n
Green Power Energy Limited is an Australian company which is indulged in providing
energy and search and development of coal to liquid project in Australia. It has several other
subsidies which are engaged in providing energy support program to other corporations on a
commercial level (Green Power Energy Limited (2018).
2. Governance and Ownership structure
The present CEO Of Company is Gerard King who takes all the imperative decisions for the
future growth of the business.
The below given are the key managerial person of the Green Power Energy Limited
Name Position Start Date
Mr Gerard Arthur King Executive Director, Executive Chairman 4 Nov 1985
Mr Edwin Edward Bulseco Non-Executive Director 28 Mar 2017
Mr Simon Peters Non-Executive Director 6 Dec 2016
(Yahoo Finance, 2017)
Shareholder details of the company
(Gree
n
Paraphrase This Document
Need a fresh take? Get an instant paraphrase of this document with our AI Paraphraser
Financial accounting of Green Power Energy Limited 5
Power Energy Limited, 2017)
3. Performance ratio analysis of Green Power Energy Limited
The ratio analysis tools are used to set the relation between two financial factors of the
business and identify whether Green Power Energy Limited has been performing well or not
Throughout the time (Green Power Energy Limited, 2015).
Short-term solvency ratio
1. Current ratio
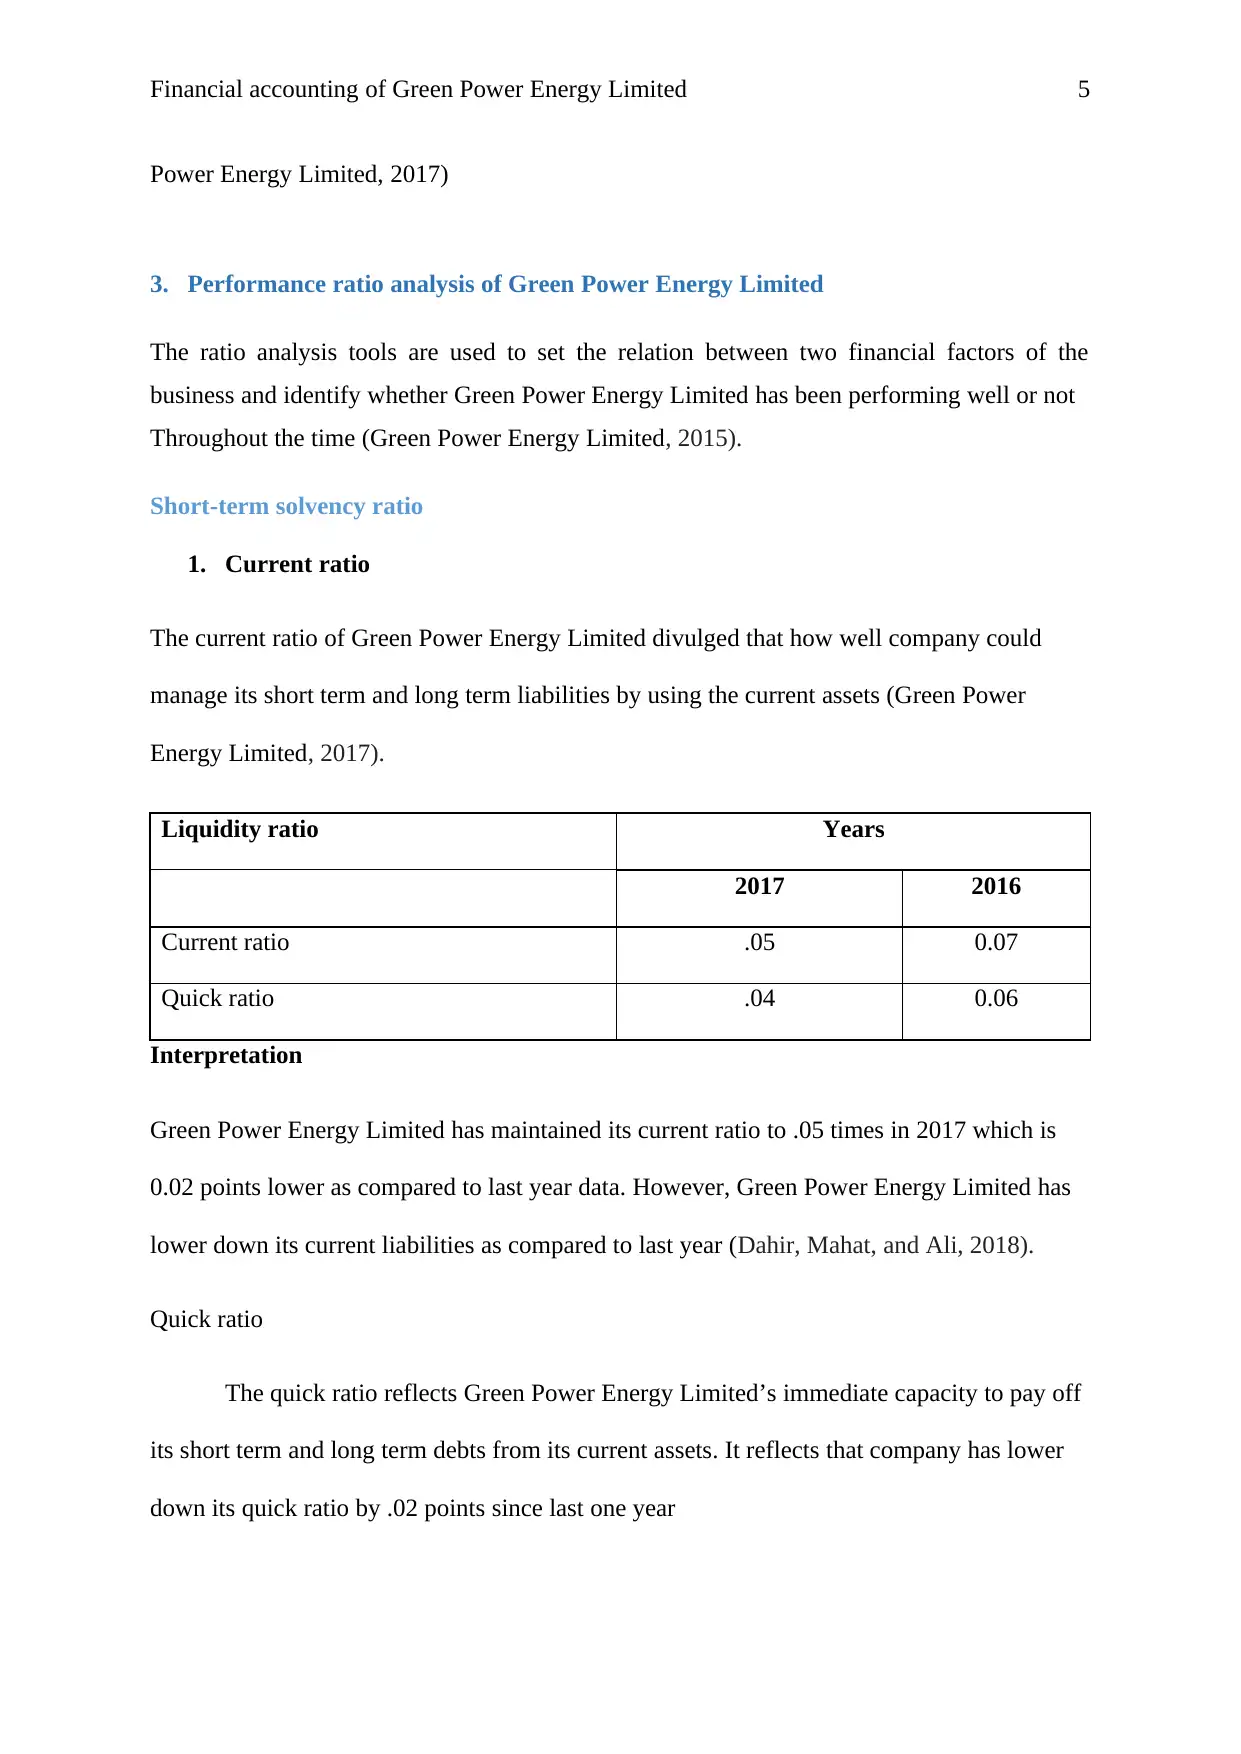
The current ratio of Green Power Energy Limited divulged that how well company could
manage its short term and long term liabilities by using the current assets (Green Power
Energy Limited, 2017).
Liquidity ratio Years
2017 2016
Current ratio .05 0.07
Quick ratio .04 0.06
Interpretation
Green Power Energy Limited has maintained its current ratio to .05 times in 2017 which is
0.02 points lower as compared to last year data. However, Green Power Energy Limited has
lower down its current liabilities as compared to last year (Dahir, Mahat, and Ali, 2018).
Quick ratio
The quick ratio reflects Green Power Energy Limited’s immediate capacity to pay off
its short term and long term debts from its current assets. It reflects that company has lower
down its quick ratio by .02 points since last one year
Power Energy Limited, 2017)
3. Performance ratio analysis of Green Power Energy Limited
The ratio analysis tools are used to set the relation between two financial factors of the
business and identify whether Green Power Energy Limited has been performing well or not
Throughout the time (Green Power Energy Limited, 2015).
Short-term solvency ratio
1. Current ratio
The current ratio of Green Power Energy Limited divulged that how well company could
manage its short term and long term liabilities by using the current assets (Green Power
Energy Limited, 2017).
Liquidity ratio Years
2017 2016
Current ratio .05 0.07
Quick ratio .04 0.06
Interpretation
Green Power Energy Limited has maintained its current ratio to .05 times in 2017 which is
0.02 points lower as compared to last year data. However, Green Power Energy Limited has
lower down its current liabilities as compared to last year (Dahir, Mahat, and Ali, 2018).
Quick ratio
The quick ratio reflects Green Power Energy Limited’s immediate capacity to pay off
its short term and long term debts from its current assets. It reflects that company has lower
down its quick ratio by .02 points since last one year
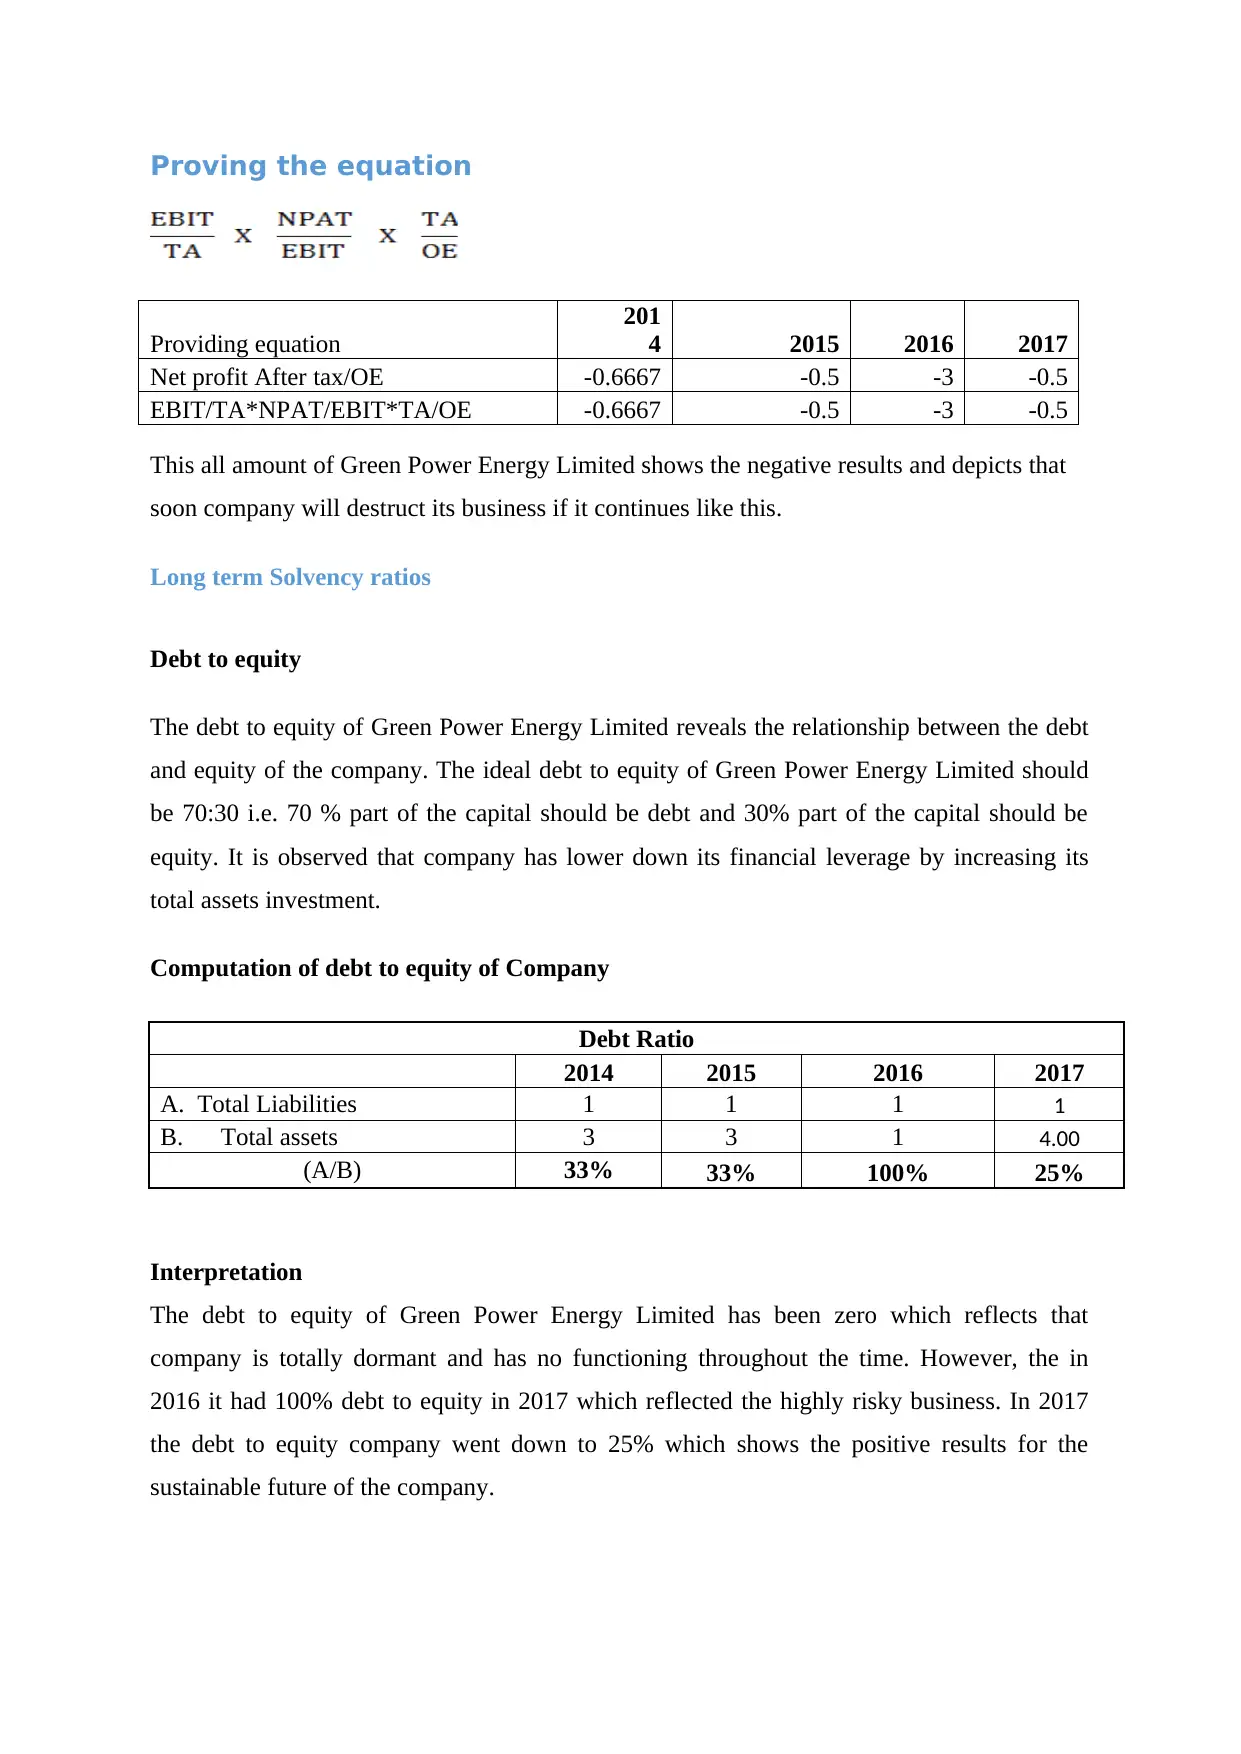
Proving the equation
Providing equation
201
4 2015 2016 2017
Net profit After tax/OE -0.6667 -0.5 -3 -0.5
EBIT/TA*NPAT/EBIT*TA/OE -0.6667 -0.5 -3 -0.5
This all amount of Green Power Energy Limited shows the negative results and depicts that
soon company will destruct its business if it continues like this.
Long term Solvency ratios
Debt to equity
The debt to equity of Green Power Energy Limited reveals the relationship between the debt
and equity of the company. The ideal debt to equity of Green Power Energy Limited should
be 70:30 i.e. 70 % part of the capital should be debt and 30% part of the capital should be
equity. It is observed that company has lower down its financial leverage by increasing its
total assets investment.
Computation of debt to equity of Company
Debt Ratio
2014 2015 2016 2017
A. Total Liabilities 1 1 1 1
B. Total assets 3 3 1 4.00
(A/B) 33% 33% 100% 25%
Interpretation
The debt to equity of Green Power Energy Limited has been zero which reflects that
company is totally dormant and has no functioning throughout the time. However, the in
2016 it had 100% debt to equity in 2017 which reflected the highly risky business. In 2017
the debt to equity company went down to 25% which shows the positive results for the
sustainable future of the company.
⊘ This is a preview!⊘
Do you want full access?
Subscribe today to unlock all pages.
Trusted by 1+ million students worldwide
Financial accounting of Green Power Energy Limited 7
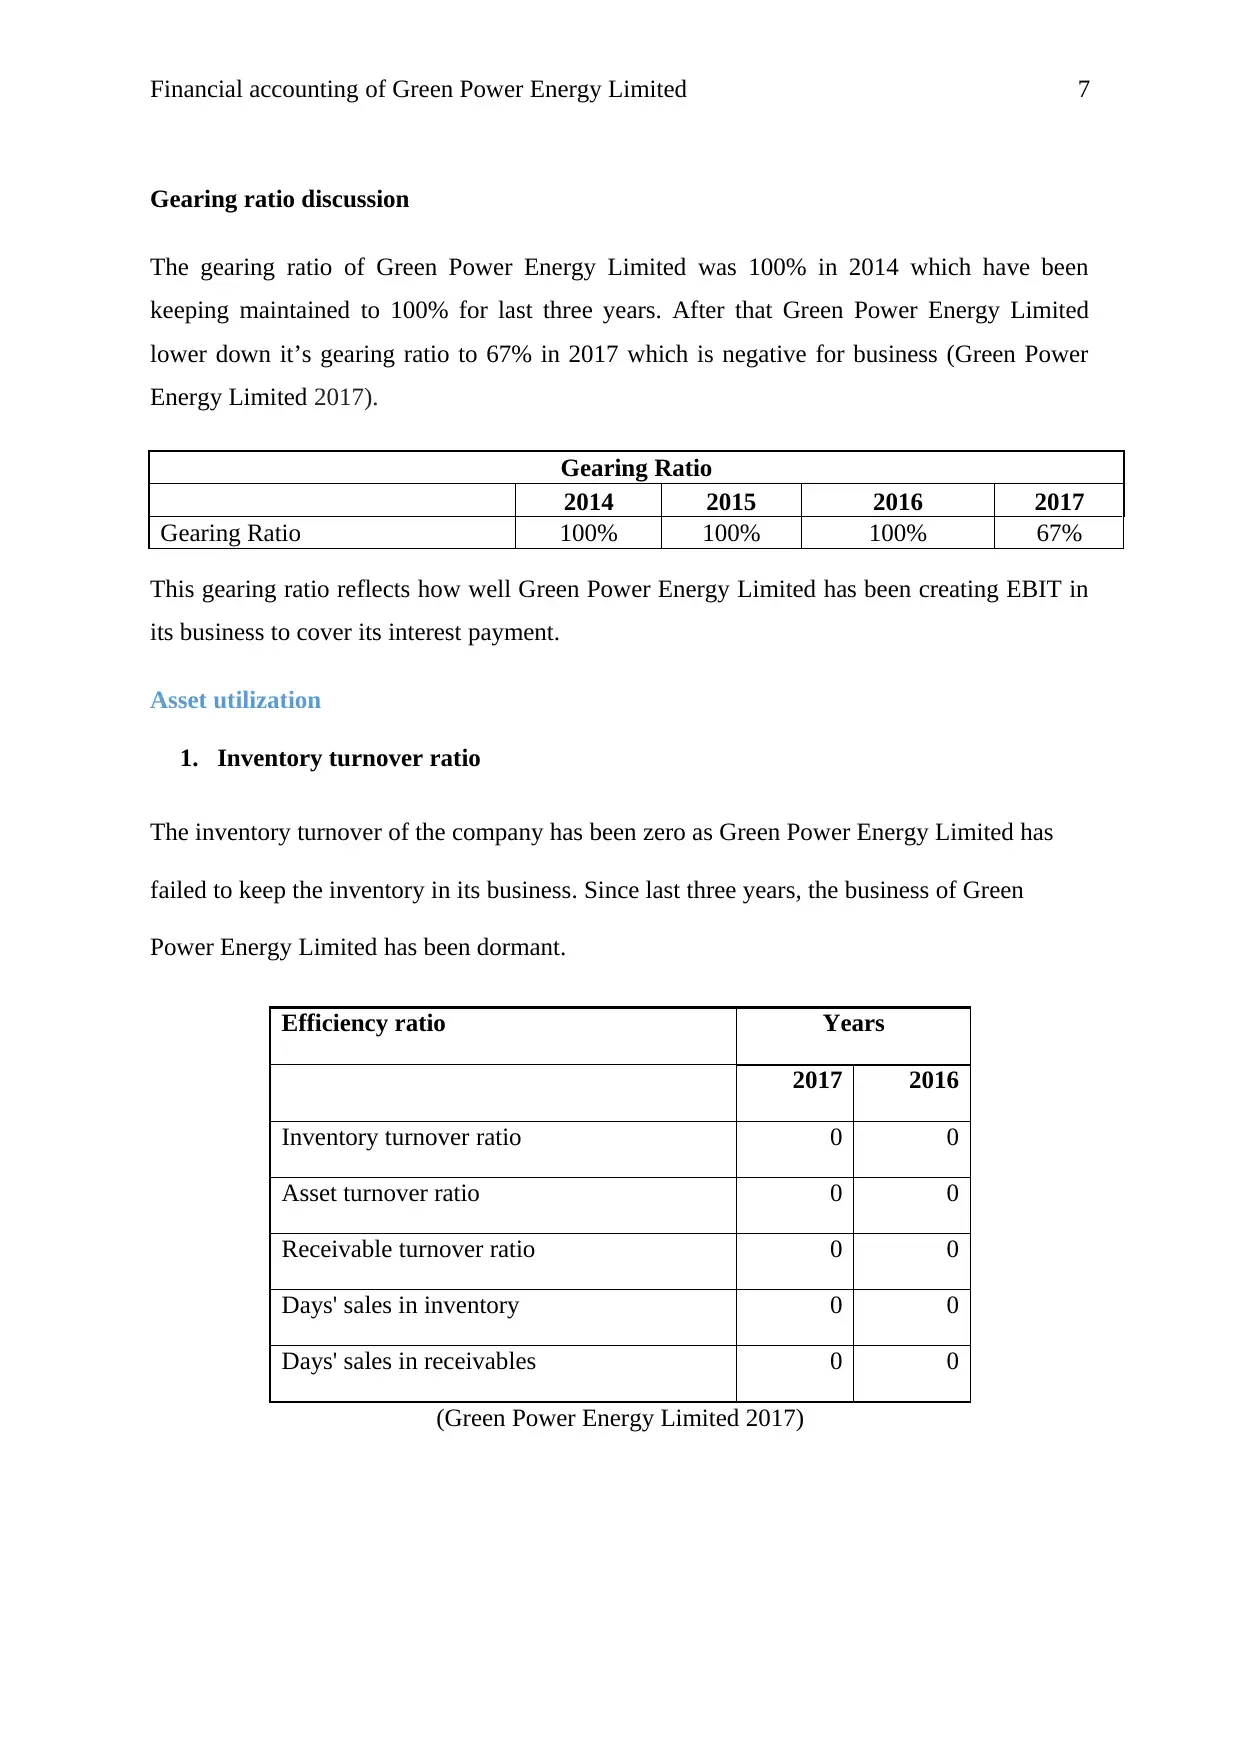
Gearing ratio discussion
The gearing ratio of Green Power Energy Limited was 100% in 2014 which have been
keeping maintained to 100% for last three years. After that Green Power Energy Limited
lower down it’s gearing ratio to 67% in 2017 which is negative for business (Green Power
Energy Limited 2017).
Gearing Ratio
2014 2015 2016 2017
Gearing Ratio 100% 100% 100% 67%
This gearing ratio reflects how well Green Power Energy Limited has been creating EBIT in
its business to cover its interest payment.
Asset utilization
1. Inventory turnover ratio
The inventory turnover of the company has been zero as Green Power Energy Limited has
failed to keep the inventory in its business. Since last three years, the business of Green
Power Energy Limited has been dormant.
Efficiency ratio Years
2017 2016
Inventory turnover ratio 0 0
Asset turnover ratio 0 0
Receivable turnover ratio 0 0
Days' sales in inventory 0 0
Days' sales in receivables 0 0
(Green Power Energy Limited 2017)
Paraphrase This Document
Need a fresh take? Get an instant paraphrase of this document with our AI Paraphraser
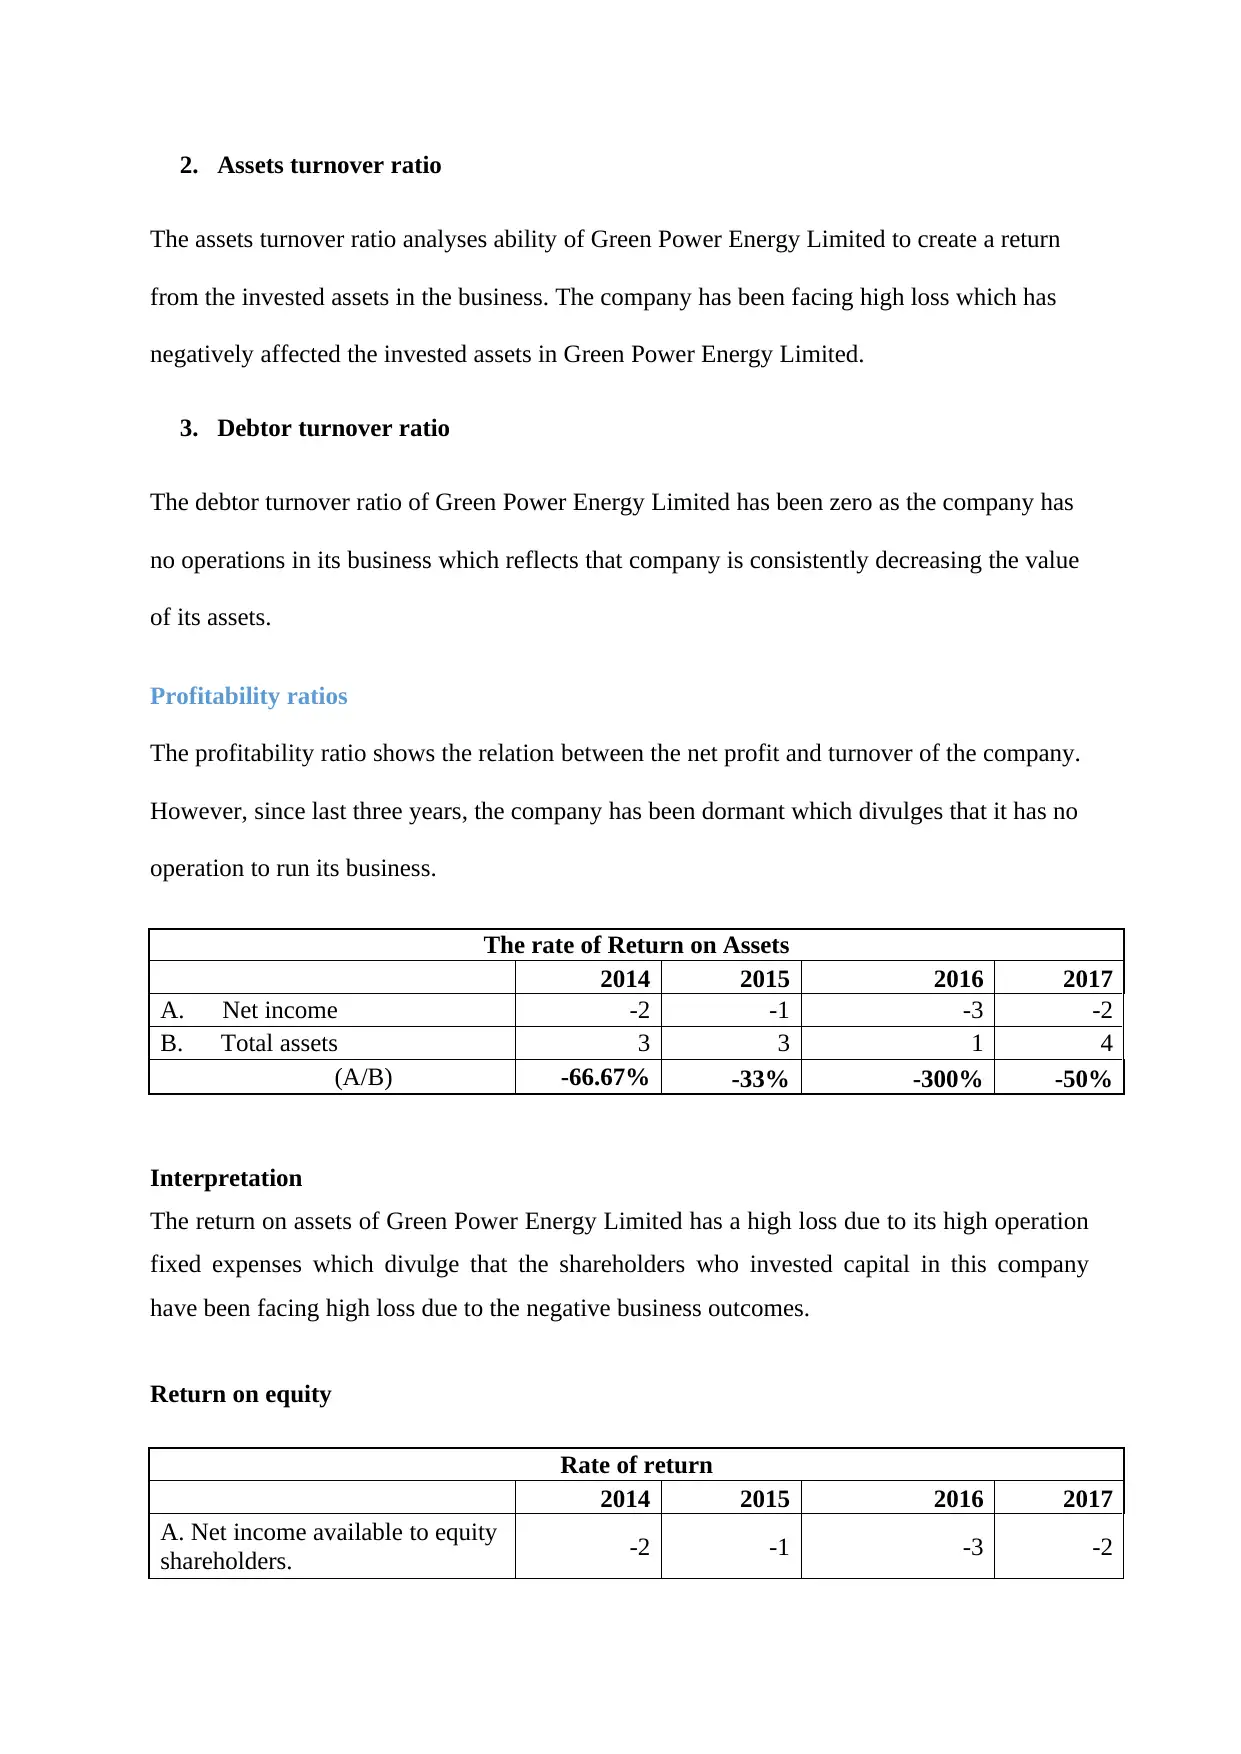
2. Assets turnover ratio
The assets turnover ratio analyses ability of Green Power Energy Limited to create a return
from the invested assets in the business. The company has been facing high loss which has
negatively affected the invested assets in Green Power Energy Limited.
3. Debtor turnover ratio
The debtor turnover ratio of Green Power Energy Limited has been zero as the company has
no operations in its business which reflects that company is consistently decreasing the value
of its assets.
Profitability ratios
The profitability ratio shows the relation between the net profit and turnover of the company.
However, since last three years, the company has been dormant which divulges that it has no
operation to run its business.
The rate of Return on Assets
2014 2015 2016 2017
A. Net income -2 -1 -3 -2
B. Total assets 3 3 1 4
(A/B) -66.67% -33% -300% -50%
Interpretation
The return on assets of Green Power Energy Limited has a high loss due to its high operation
fixed expenses which divulge that the shareholders who invested capital in this company
have been facing high loss due to the negative business outcomes.
Return on equity
Rate of return
2014 2015 2016 2017
A. Net income available to equity
shareholders. -2 -1 -3 -2
Financial accounting of Green Power Energy Limited 9
B. Shareholder’s Equity 3 17,981 1 4.00
(A/B) -66.67% -0.01% -300.00% -50.00%
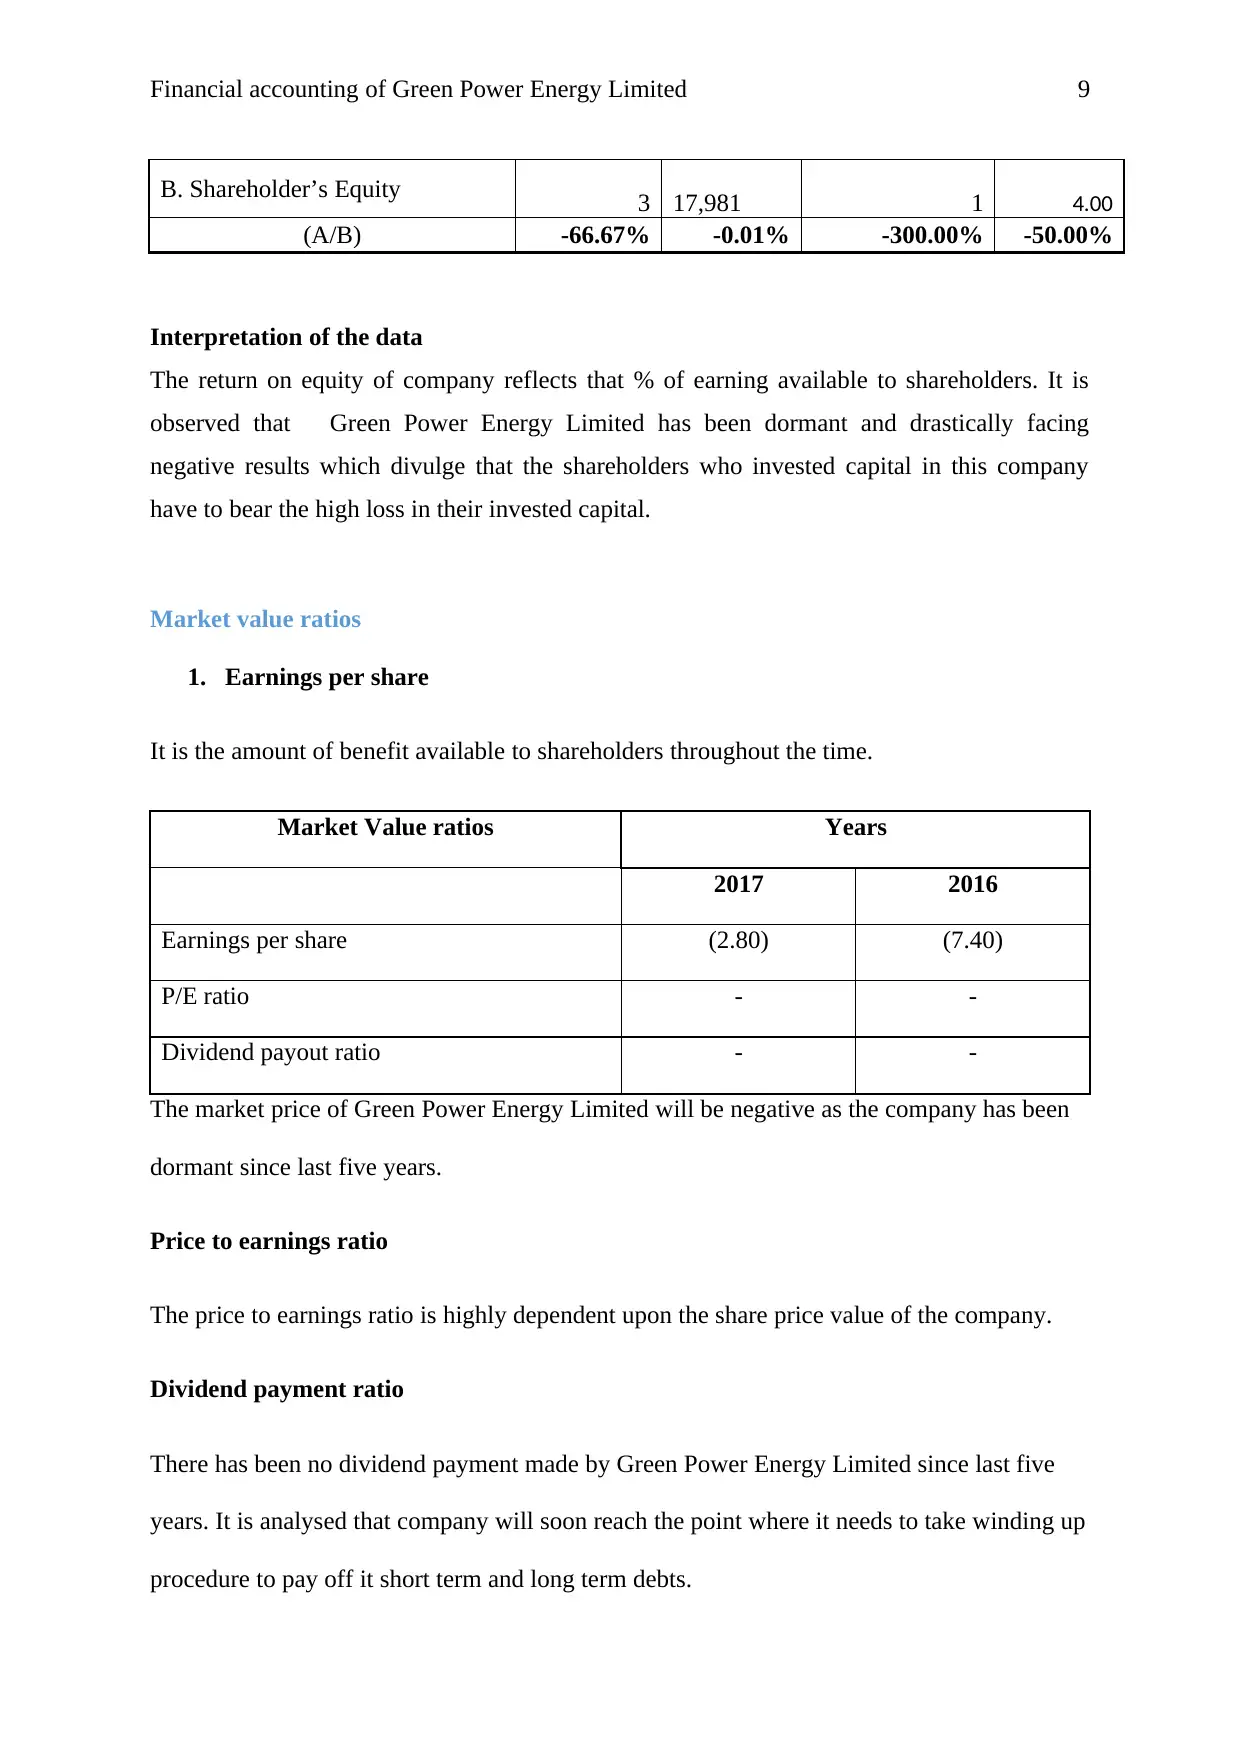
Interpretation of the data
The return on equity of company reflects that % of earning available to shareholders. It is
observed that Green Power Energy Limited has been dormant and drastically facing
negative results which divulge that the shareholders who invested capital in this company
have to bear the high loss in their invested capital.
Market value ratios
1. Earnings per share
It is the amount of benefit available to shareholders throughout the time.
Market Value ratios Years
2017 2016
Earnings per share (2.80) (7.40)
P/E ratio - -
Dividend payout ratio - -
The market price of Green Power Energy Limited will be negative as the company has been
dormant since last five years.
Price to earnings ratio
The price to earnings ratio is highly dependent upon the share price value of the company.
Dividend payment ratio
There has been no dividend payment made by Green Power Energy Limited since last five
years. It is analysed that company will soon reach the point where it needs to take winding up
procedure to pay off it short term and long term debts.
B. Shareholder’s Equity 3 17,981 1 4.00
(A/B) -66.67% -0.01% -300.00% -50.00%
Interpretation of the data
The return on equity of company reflects that % of earning available to shareholders. It is
observed that Green Power Energy Limited has been dormant and drastically facing
negative results which divulge that the shareholders who invested capital in this company
have to bear the high loss in their invested capital.
Market value ratios
1. Earnings per share
It is the amount of benefit available to shareholders throughout the time.
Market Value ratios Years
2017 2016
Earnings per share (2.80) (7.40)
P/E ratio - -
Dividend payout ratio - -
The market price of Green Power Energy Limited will be negative as the company has been
dormant since last five years.
Price to earnings ratio
The price to earnings ratio is highly dependent upon the share price value of the company.
Dividend payment ratio
There has been no dividend payment made by Green Power Energy Limited since last five
years. It is analysed that company will soon reach the point where it needs to take winding up
procedure to pay off it short term and long term debts.
⊘ This is a preview!⊘
Do you want full access?
Subscribe today to unlock all pages.
Trusted by 1+ million students worldwide
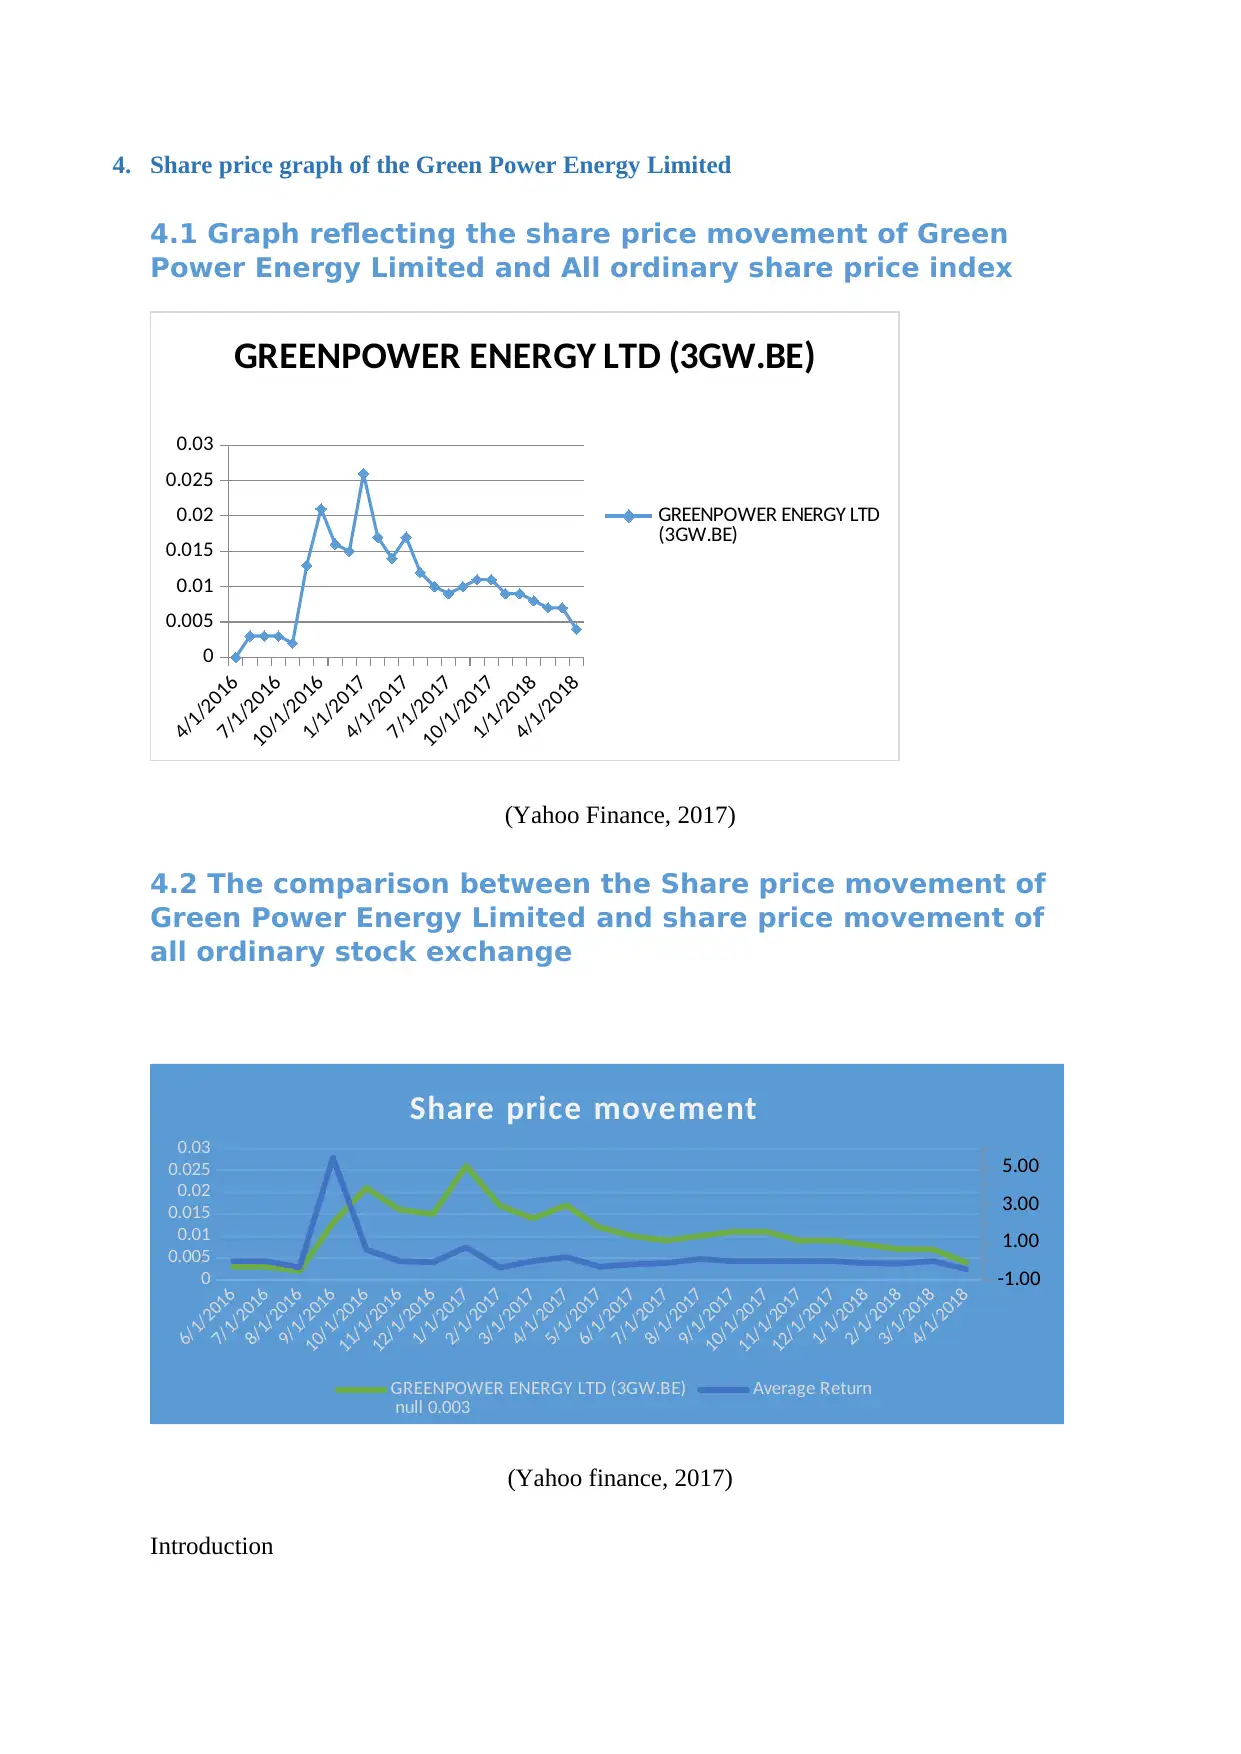
4. Share price graph of the Green Power Energy Limited
4.1 Graph reflecting the share price movement of Green
Power Energy Limited and All ordinary share price index
4/1/2016
7/1/2016
10/1/2016
1/1/2017
4/1/2017
7/1/2017
10/1/2017
1/1/2018
4/1/2018
0
0.005
0.01
0.015
0.02
0.025
0.03
GREENPOWER ENERGY LTD (3GW.BE)
GREENPOWER ENERGY LTD
(3GW.BE)
(Yahoo Finance, 2017)
4.2 The comparison between the Share price movement of
Green Power Energy Limited and share price movement of
all ordinary stock exchange
6/1/2016
7/1/2016
8/1/2016
9/1/2016
10/1/2016
11/1/2016
12/1/2016
1/1/2017
2/1/2017
3/1/2017
4/1/2017
5/1/2017
6/1/2017
7/1/2017
8/1/2017
9/1/2017
10/1/2017
11/1/2017
12/1/2017
1/1/2018
2/1/2018
3/1/2018
4/1/2018
0
0.005
0.01
0.015
0.02
0.025
0.03
-1.00
1.00
3.00
5.00
Share price movement
GREENPOWER ENERGY LTD (3GW.BE)
null 0.003 Average Return
(Yahoo finance, 2017)
Introduction
Paraphrase This Document
Need a fresh take? Get an instant paraphrase of this document with our AI Paraphraser
Financial accounting of Green Power Energy Limited 11
The share price movement of the company is highly based on the investment opportunity
available to the investors, profitability of the company and financial leverage. The share price
of Green Power Energy Limited will be negative in future for sure.
Analysis
Green Power Energy Limited has been dormant and failed to run its business effusively. The
loss in the company has been occurred due to the zero sales and increased operating fixed
expenses. The share price trend of the company has been showing that the share price of
Green Power Energy Limited will be negative soon.
Conclusion
If Green Power Energy Limited fails to take the revival strategies program then it will
negatively impact the share price and will result to the destruction of the business of Green Power
Energy Limited.
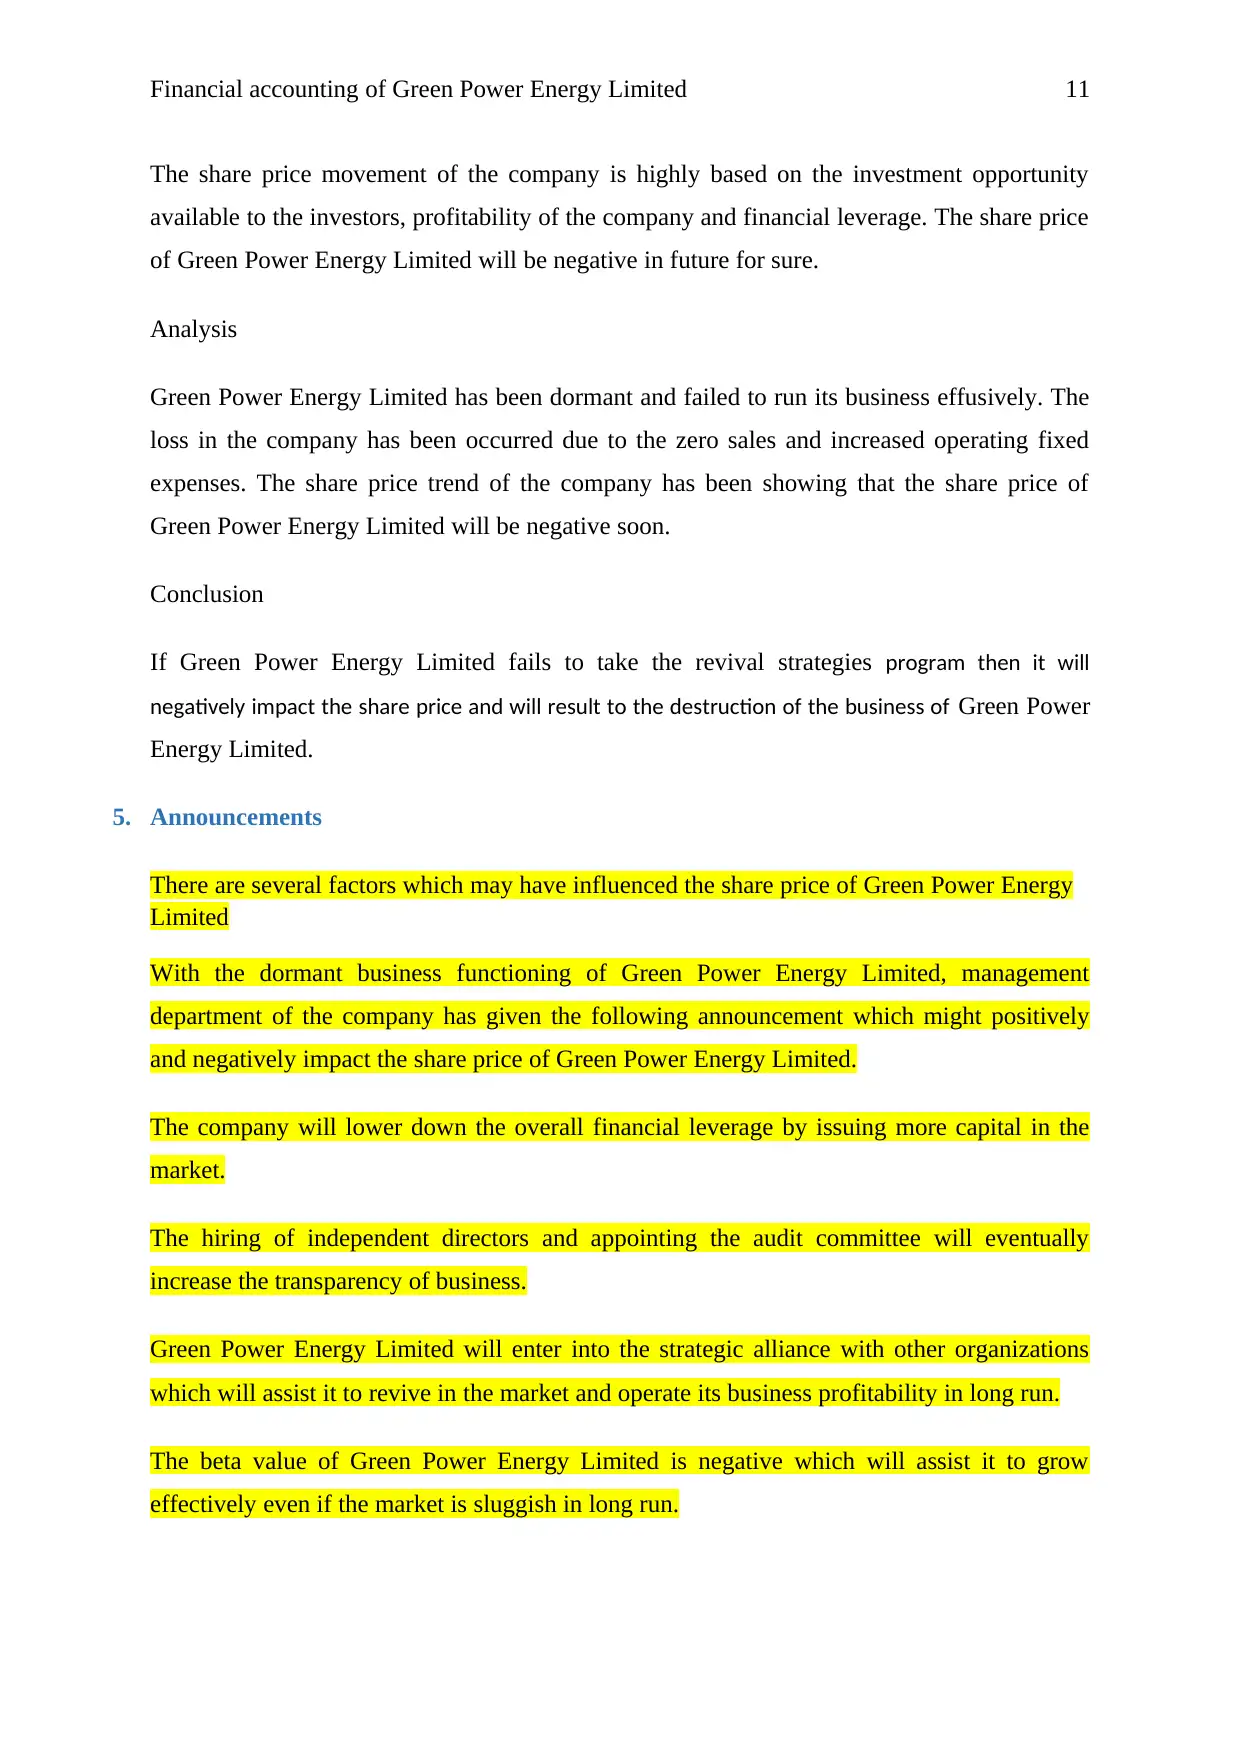
5. Announcements
There are several factors which may have influenced the share price of Green Power Energy
Limited
With the dormant business functioning of Green Power Energy Limited, management
department of the company has given the following announcement which might positively
and negatively impact the share price of Green Power Energy Limited.
The company will lower down the overall financial leverage by issuing more capital in the
market.
The hiring of independent directors and appointing the audit committee will eventually
increase the transparency of business.
Green Power Energy Limited will enter into the strategic alliance with other organizations
which will assist it to revive in the market and operate its business profitability in long run.
The beta value of Green Power Energy Limited is negative which will assist it to grow
effectively even if the market is sluggish in long run.
The share price movement of the company is highly based on the investment opportunity
available to the investors, profitability of the company and financial leverage. The share price
of Green Power Energy Limited will be negative in future for sure.
Analysis
Green Power Energy Limited has been dormant and failed to run its business effusively. The
loss in the company has been occurred due to the zero sales and increased operating fixed
expenses. The share price trend of the company has been showing that the share price of
Green Power Energy Limited will be negative soon.
Conclusion
If Green Power Energy Limited fails to take the revival strategies program then it will
negatively impact the share price and will result to the destruction of the business of Green Power
Energy Limited.
5. Announcements
There are several factors which may have influenced the share price of Green Power Energy
Limited
With the dormant business functioning of Green Power Energy Limited, management
department of the company has given the following announcement which might positively
and negatively impact the share price of Green Power Energy Limited.
The company will lower down the overall financial leverage by issuing more capital in the
market.
The hiring of independent directors and appointing the audit committee will eventually
increase the transparency of business.
Green Power Energy Limited will enter into the strategic alliance with other organizations
which will assist it to revive in the market and operate its business profitability in long run.
The beta value of Green Power Energy Limited is negative which will assist it to grow
effectively even if the market is sluggish in long run.
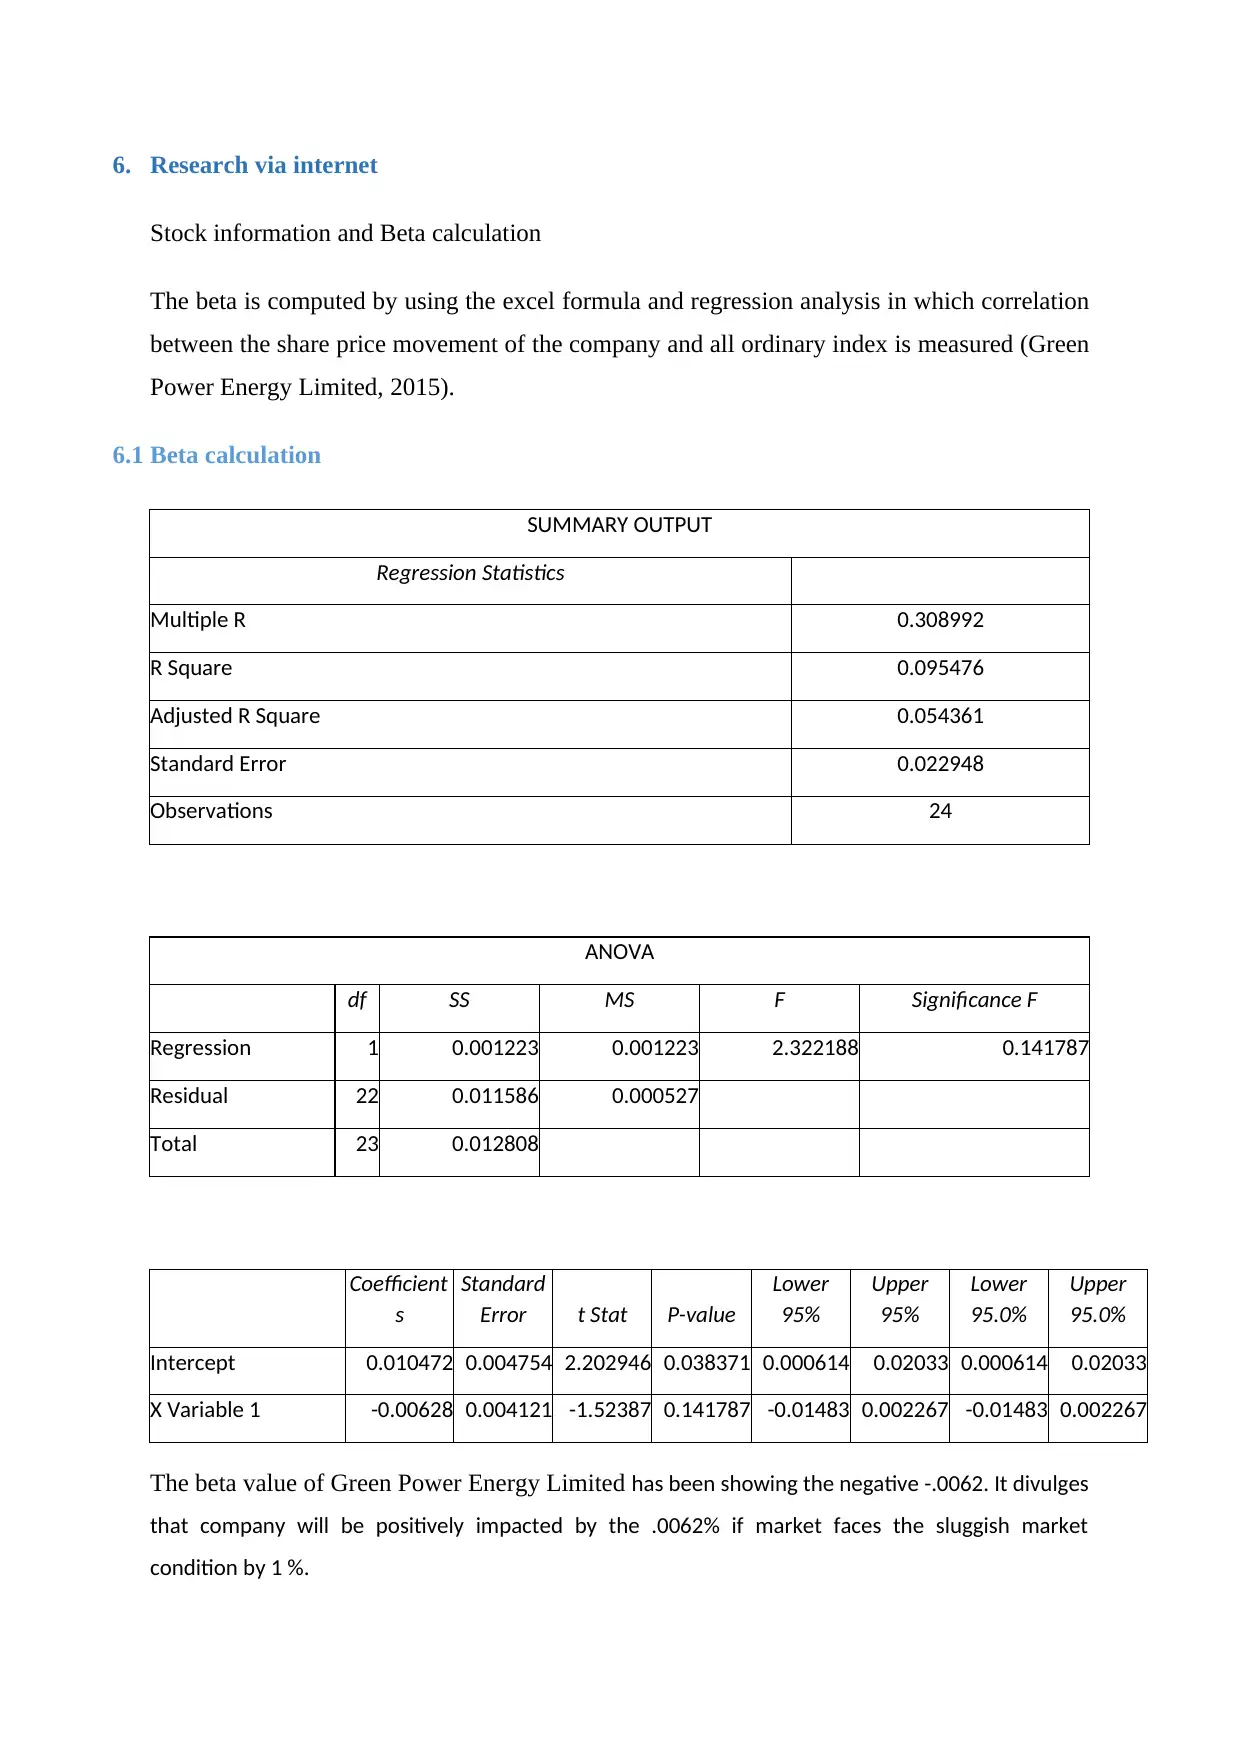
6. Research via internet
Stock information and Beta calculation
The beta is computed by using the excel formula and regression analysis in which correlation
between the share price movement of the company and all ordinary index is measured (Green
Power Energy Limited, 2015).
6.1 Beta calculation
SUMMARY OUTPUT
Regression Statistics
Multiple R 0.308992
R Square 0.095476
Adjusted R Square 0.054361
Standard Error 0.022948
Observations 24
ANOVA
df SS MS F Significance F
Regression 1 0.001223 0.001223 2.322188 0.141787
Residual 22 0.011586 0.000527
Total 23 0.012808
Coefficient
s
Standard
Error t Stat P-value
Lower
95%
Upper
95%
Lower
95.0%
Upper
95.0%
Intercept 0.010472 0.004754 2.202946 0.038371 0.000614 0.02033 0.000614 0.02033
X Variable 1 -0.00628 0.004121 -1.52387 0.141787 -0.01483 0.002267 -0.01483 0.002267
The beta value of Green Power Energy Limited has been showing the negative -.0062. It divulges
that company will be positively impacted by the .0062% if market faces the sluggish market
condition by 1 %.
⊘ This is a preview!⊘
Do you want full access?
Subscribe today to unlock all pages.
Trusted by 1+ million students worldwide
1 out of 21
Related Documents


Your All-in-One AI-Powered Toolkit for Academic Success.
+13062052269
info@desklib.com
Available 24*7 on WhatsApp / Email
![[object Object]](/_next/static/media/star-bottom.7253800d.svg)
Unlock your academic potential
Copyright © 2020–2026 A2Z Services. All Rights Reserved. Developed and managed by ZUCOL.