HI5002 Finance: Comprehensive Financial Analysis of Mako Gold Limited
VerifiedAdded on 2023/06/11
|23
|4246
|475
Case Study
AI Summary
This report provides a comprehensive financial analysis of Mako Gold Limited, an exploration company focused on gold deposits. The analysis includes a review of the company's governance and ownership structure, performance ratio analysis (short-term solvency, long-term solvency, asset utilization, profitability, and market value), and share price movement in comparison to the All Ordinaries Index. It also covers announcements impacting share price, beta calculation using regression analysis, computation of the required rate of return using the CAPM method, and the weighted average cost of capital. The report further discusses the company's debt ratio, gearing ratio, and dividend policies, ultimately offering insights into the company's financial health and providing recommendations for potential investors. The analysis uses data from Mako Gold Limited's annual reports and other financial sources to assess the company's financial performance and future prospects.
RUNNING HEAD: Financial analysis of Mako Gold Limited
1
Name of the student
Topic- Financial analysis of Mako Gold Limited
University name
1
Name of the student
Topic- Financial analysis of Mako Gold Limited
University name
Paraphrase This Document
Need a fresh take? Get an instant paraphrase of this document with our AI Paraphraser
Table of Contents
Introduction...........................................................................................................................................3
1. Description of Mako Gold Limited............................................................................................3
2. Governance and Ownership structure............................................................................................4
3. Performance ratio analysis of Mako Gold Limited........................................................................5
Short term solvency ratio...................................................................................................................5
Proving the equation.........................................................................................................................7
Long term Solvency ratios.................................................................................................................7
Asset utilization.................................................................................................................................8
Profitability ratios..............................................................................................................................9
Market value ratios..........................................................................................................................11
4. Share price graph of the Mako Gold Limited...............................................................................12
4.1 Graph reflecting the share price movement of Mako Gold Limited and All ordinary share
price index.......................................................................................................................................12
4.2 The comparison between the Share price movement of Mako Gold Limited and share price
movement of all ordinary stock exchange.......................................................................................12
5. Announcements...........................................................................................................................14
6. Research via internet....................................................................................................................14
6.1 Beta calculation...................................................................................................................15
6.2 Computation of required rate of return by using CAPM method...............................................15
6.3 Determining the investment method (Conservative investment)................................................16
7. Computation of the weighted average cost of capital...................................................................16
7.1 Computed Cost of Capital through Capital Assets Pricing model........................................16
7.2 Implications that a higher WACC on investment decision........................................................17
8. Debt ratio consideration of Mako Gold Limited..........................................................................17
8.1 Stable Debt to equity ratio of company..........................................................................................17
8.2 Gearing ratio discussion.............................................................................................................18
9. Divided policies of company.......................................................................................................18
Letter of recommendation....................................................................................................................19
10. Conclusion...............................................................................................................................20
11. References...............................................................................................................................21
12. Appendix.................................................................................................................................23
Financial analysis of Mako Gold Limited 3
Introduction
There are several financial tools which could be used by the management of the Mako
Gold Limited to implement the effective strategic program. Ratio analysis, top-down
analysis, bottom-up analysis and Du Pont analysis are the some of the financial tools which
could be used by investors and management to make the effective financial planning. The
ratio analysis and CAPM methods are used to evaluate the capital structure and financial
performance of the company. In this report, financial analysis of Mako Gold Limited has
been taken into consideration to identify the future performance of the company.
.
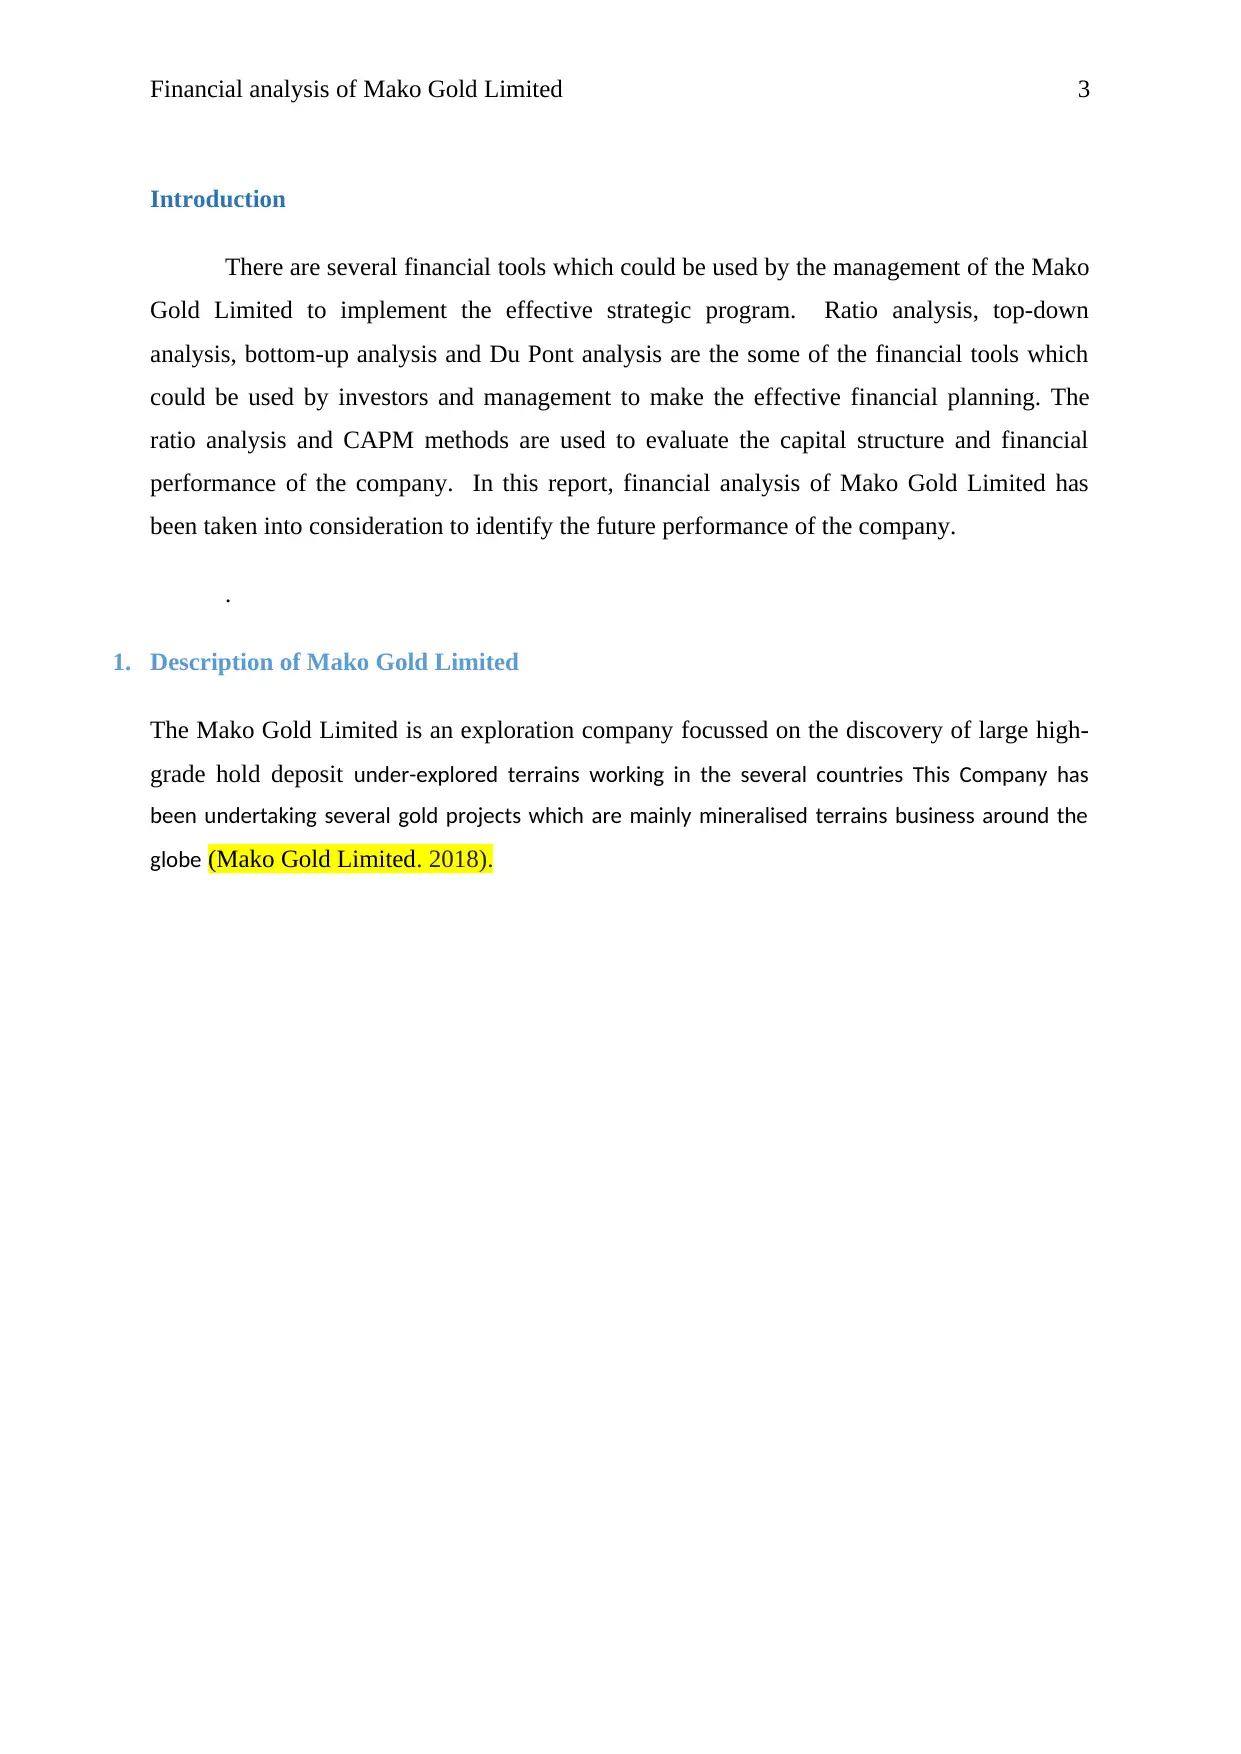
1. Description of Mako Gold Limited
The Mako Gold Limited is an exploration company focussed on the discovery of large high-
grade hold deposit under-explored terrains working in the several countries This Company has
been undertaking several gold projects which are mainly mineralised terrains business around the
globe (Mako Gold Limited. 2018).
Introduction
There are several financial tools which could be used by the management of the Mako
Gold Limited to implement the effective strategic program. Ratio analysis, top-down
analysis, bottom-up analysis and Du Pont analysis are the some of the financial tools which
could be used by investors and management to make the effective financial planning. The
ratio analysis and CAPM methods are used to evaluate the capital structure and financial
performance of the company. In this report, financial analysis of Mako Gold Limited has
been taken into consideration to identify the future performance of the company.
.
1. Description of Mako Gold Limited
The Mako Gold Limited is an exploration company focussed on the discovery of large high-
grade hold deposit under-explored terrains working in the several countries This Company has
been undertaking several gold projects which are mainly mineralised terrains business around the
globe (Mako Gold Limited. 2018).
⊘ This is a preview!⊘
Do you want full access?
Subscribe today to unlock all pages.
Trusted by 1+ million students worldwide
2. Governance and Ownership structure
The CEO of the company is M Elliott who takes all the imperative decisions in an effective
manner. Mako Gold Limited established harmonization in its reporting frameworks by complying
with the IFRS rules and regulations.
The governance structure of Mako Gold Limited is accompanied by the following key
managerial person who takes all the imperative decisions.
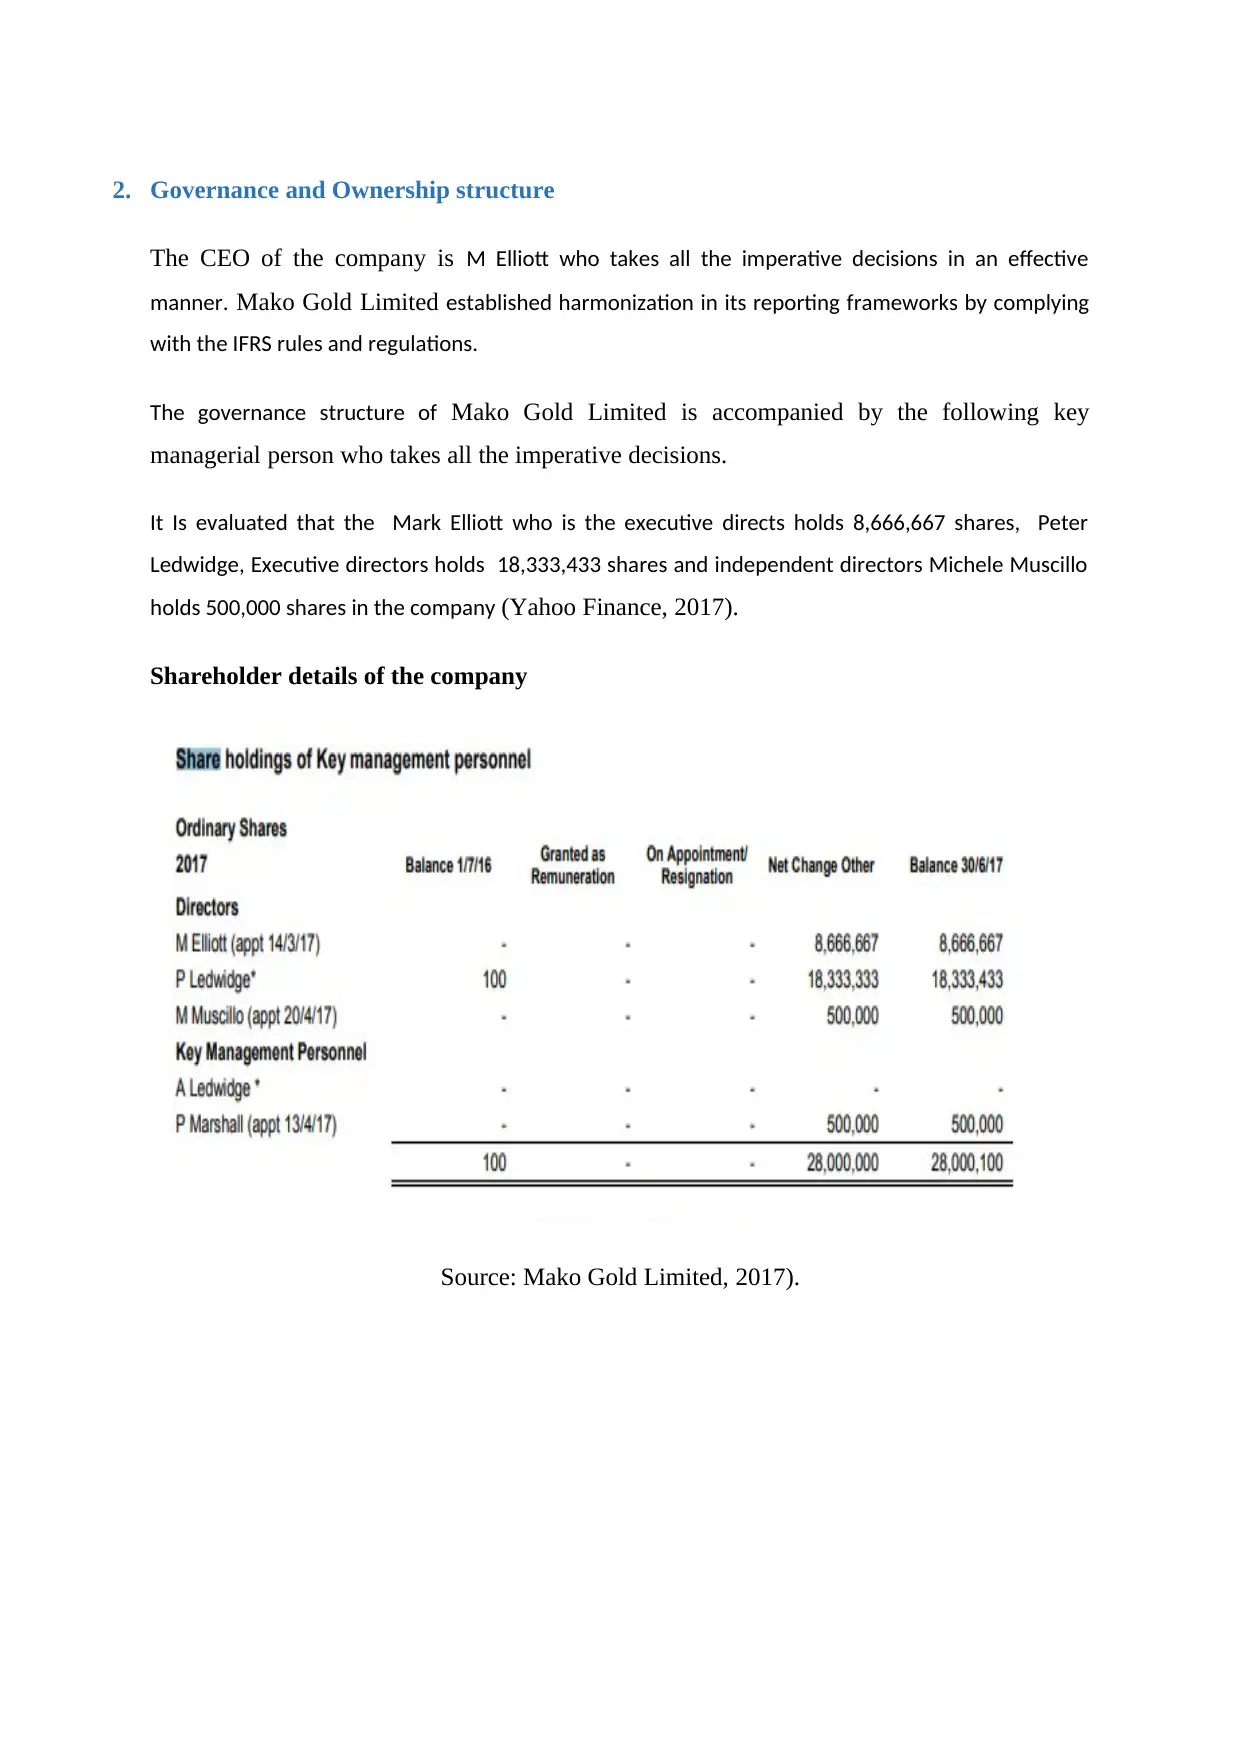
It Is evaluated that the Mark Elliott who is the executive directs holds 8,666,667 shares, Peter
Ledwidge, Executive directors holds 18,333,433 shares and independent directors Michele Muscillo
holds 500,000 shares in the company (Yahoo Finance, 2017).
Shareholder details of the company
Source: Mako Gold Limited, 2017).
The CEO of the company is M Elliott who takes all the imperative decisions in an effective
manner. Mako Gold Limited established harmonization in its reporting frameworks by complying
with the IFRS rules and regulations.
The governance structure of Mako Gold Limited is accompanied by the following key
managerial person who takes all the imperative decisions.
It Is evaluated that the Mark Elliott who is the executive directs holds 8,666,667 shares, Peter
Ledwidge, Executive directors holds 18,333,433 shares and independent directors Michele Muscillo
holds 500,000 shares in the company (Yahoo Finance, 2017).
Shareholder details of the company
Source: Mako Gold Limited, 2017).
Paraphrase This Document
Need a fresh take? Get an instant paraphrase of this document with our AI Paraphraser
Financial analysis of Mako Gold Limited 5
3. Performance ratio analysis of Mako Gold Limited
By using the ratio analysis, financial performance and trend of Mako Gold Limited could be
analyzed (Mako Gold Limited, 2015).
Short-term solvency ratio
1. Current ratio
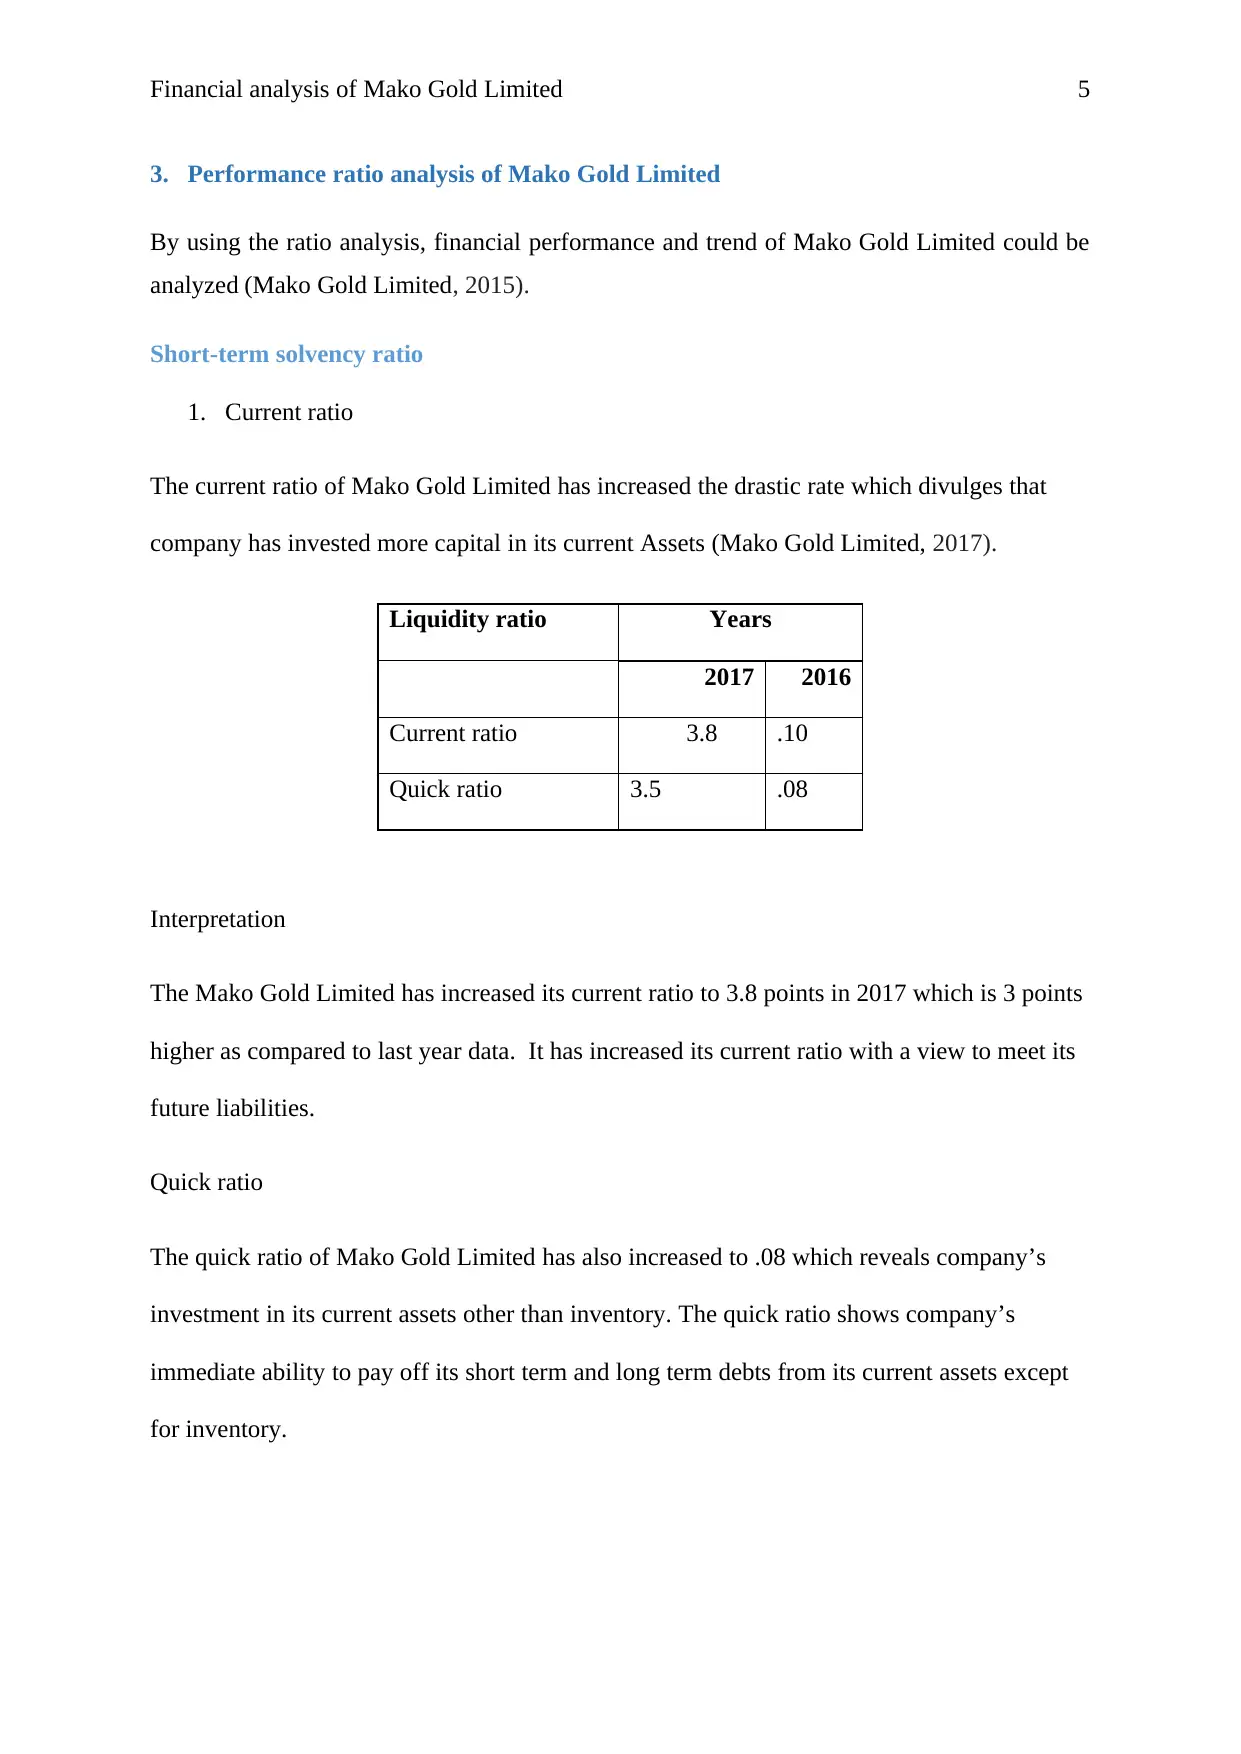
The current ratio of Mako Gold Limited has increased the drastic rate which divulges that
company has invested more capital in its current Assets (Mako Gold Limited, 2017).
Liquidity ratio Years
2017 2016
Current ratio 3.8 .10
Quick ratio 3.5 .08
Interpretation
The Mako Gold Limited has increased its current ratio to 3.8 points in 2017 which is 3 points
higher as compared to last year data. It has increased its current ratio with a view to meet its
future liabilities.
Quick ratio
The quick ratio of Mako Gold Limited has also increased to .08 which reveals company’s
investment in its current assets other than inventory. The quick ratio shows company’s
immediate ability to pay off its short term and long term debts from its current assets except
for inventory.
3. Performance ratio analysis of Mako Gold Limited
By using the ratio analysis, financial performance and trend of Mako Gold Limited could be
analyzed (Mako Gold Limited, 2015).
Short-term solvency ratio
1. Current ratio
The current ratio of Mako Gold Limited has increased the drastic rate which divulges that
company has invested more capital in its current Assets (Mako Gold Limited, 2017).
Liquidity ratio Years
2017 2016
Current ratio 3.8 .10
Quick ratio 3.5 .08
Interpretation
The Mako Gold Limited has increased its current ratio to 3.8 points in 2017 which is 3 points
higher as compared to last year data. It has increased its current ratio with a view to meet its
future liabilities.
Quick ratio
The quick ratio of Mako Gold Limited has also increased to .08 which reveals company’s
investment in its current assets other than inventory. The quick ratio shows company’s
immediate ability to pay off its short term and long term debts from its current assets except
for inventory.
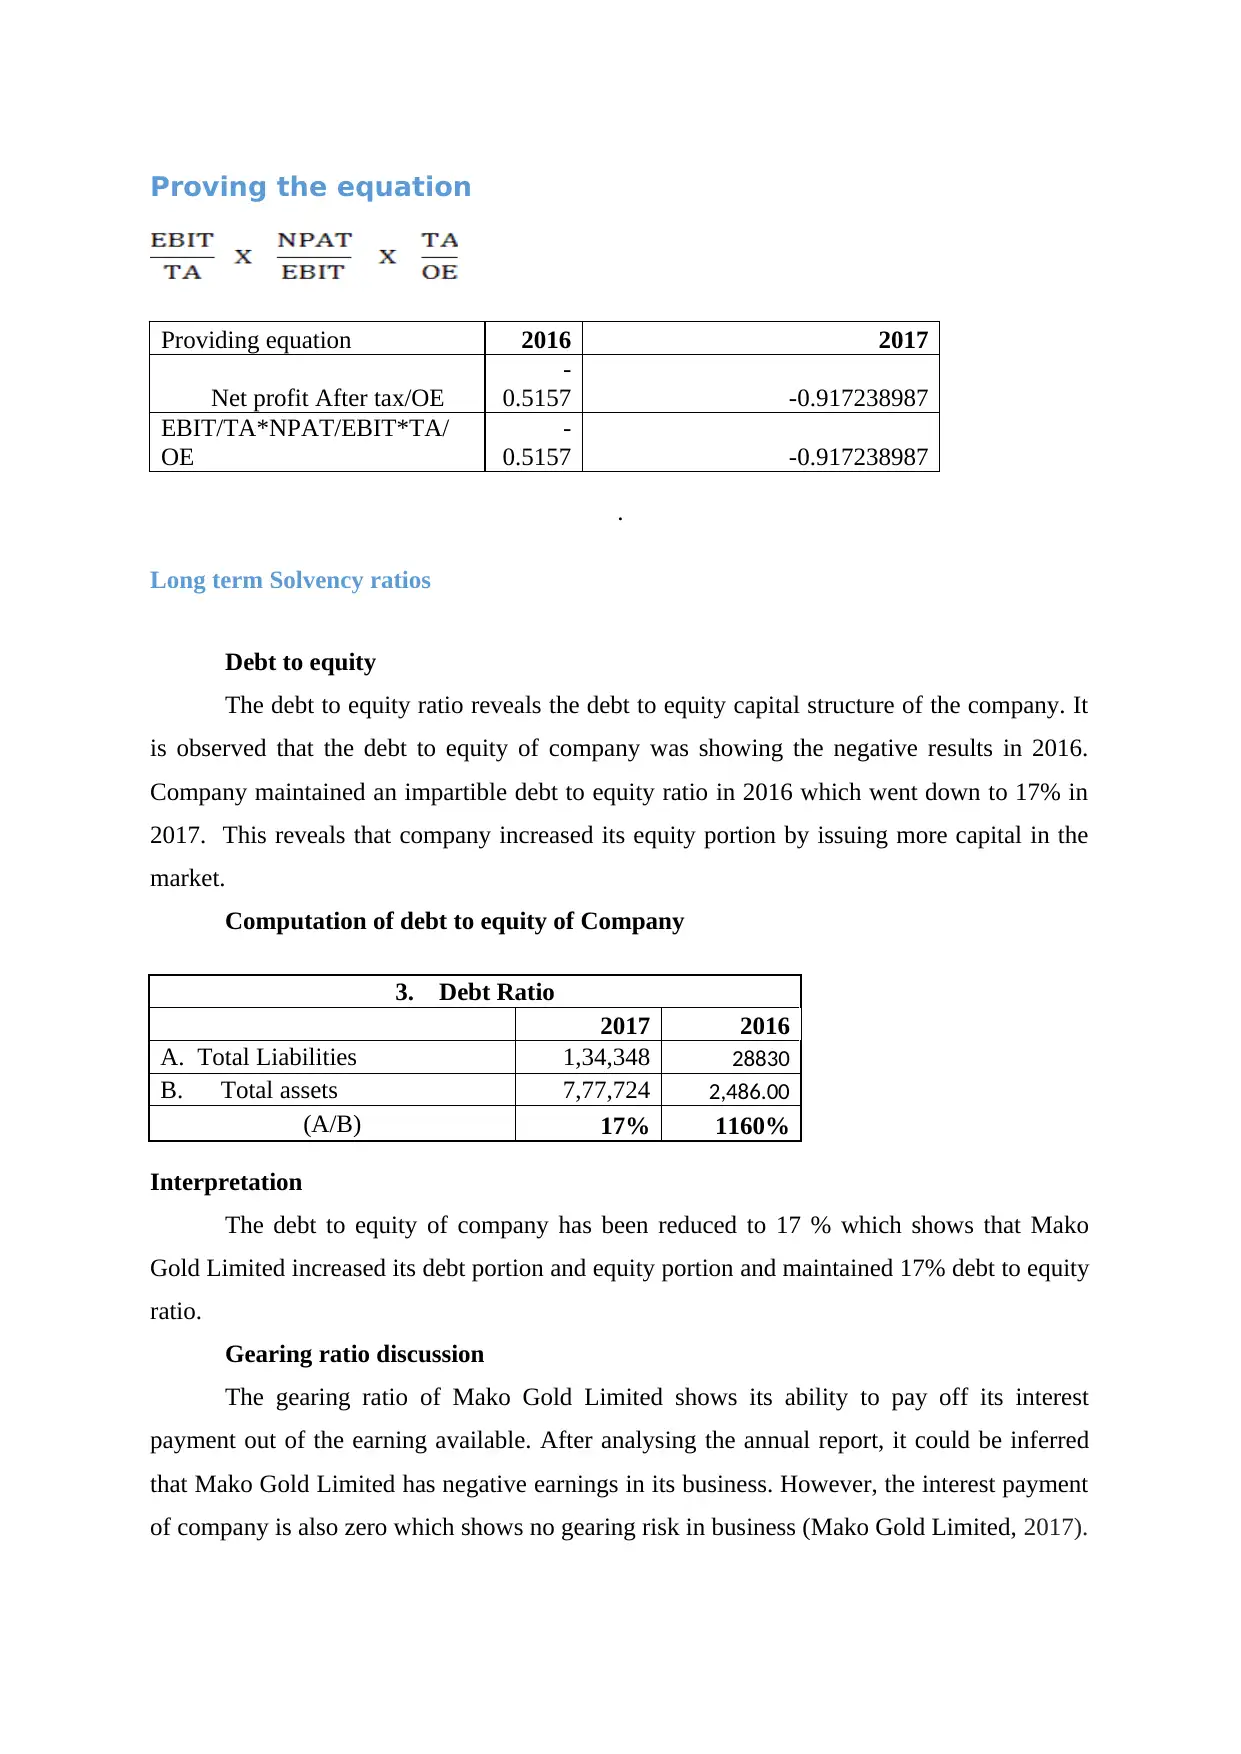
Proving the equation
Providing equation 2016 2017
Net profit After tax/OE
-
0.5157 -0.917238987
EBIT/TA*NPAT/EBIT*TA/
OE
-
0.5157 -0.917238987
.
Long term Solvency ratios
Debt to equity
The debt to equity ratio reveals the debt to equity capital structure of the company. It
is observed that the debt to equity of company was showing the negative results in 2016.
Company maintained an impartible debt to equity ratio in 2016 which went down to 17% in
2017. This reveals that company increased its equity portion by issuing more capital in the
market.
Computation of debt to equity of Company
3. Debt Ratio
2017 2016
A. Total Liabilities 1,34,348 28830
B. Total assets 7,77,724 2,486.00
(A/B) 17% 1160%
Interpretation
The debt to equity of company has been reduced to 17 % which shows that Mako
Gold Limited increased its debt portion and equity portion and maintained 17% debt to equity
ratio.
Gearing ratio discussion
The gearing ratio of Mako Gold Limited shows its ability to pay off its interest
payment out of the earning available. After analysing the annual report, it could be inferred
that Mako Gold Limited has negative earnings in its business. However, the interest payment
of company is also zero which shows no gearing risk in business (Mako Gold Limited, 2017).
⊘ This is a preview!⊘
Do you want full access?
Subscribe today to unlock all pages.
Trusted by 1+ million students worldwide
Financial analysis of Mako Gold Limited 7
Gearing Ratio
2016 2017
Gearing Ratio 0% 0%
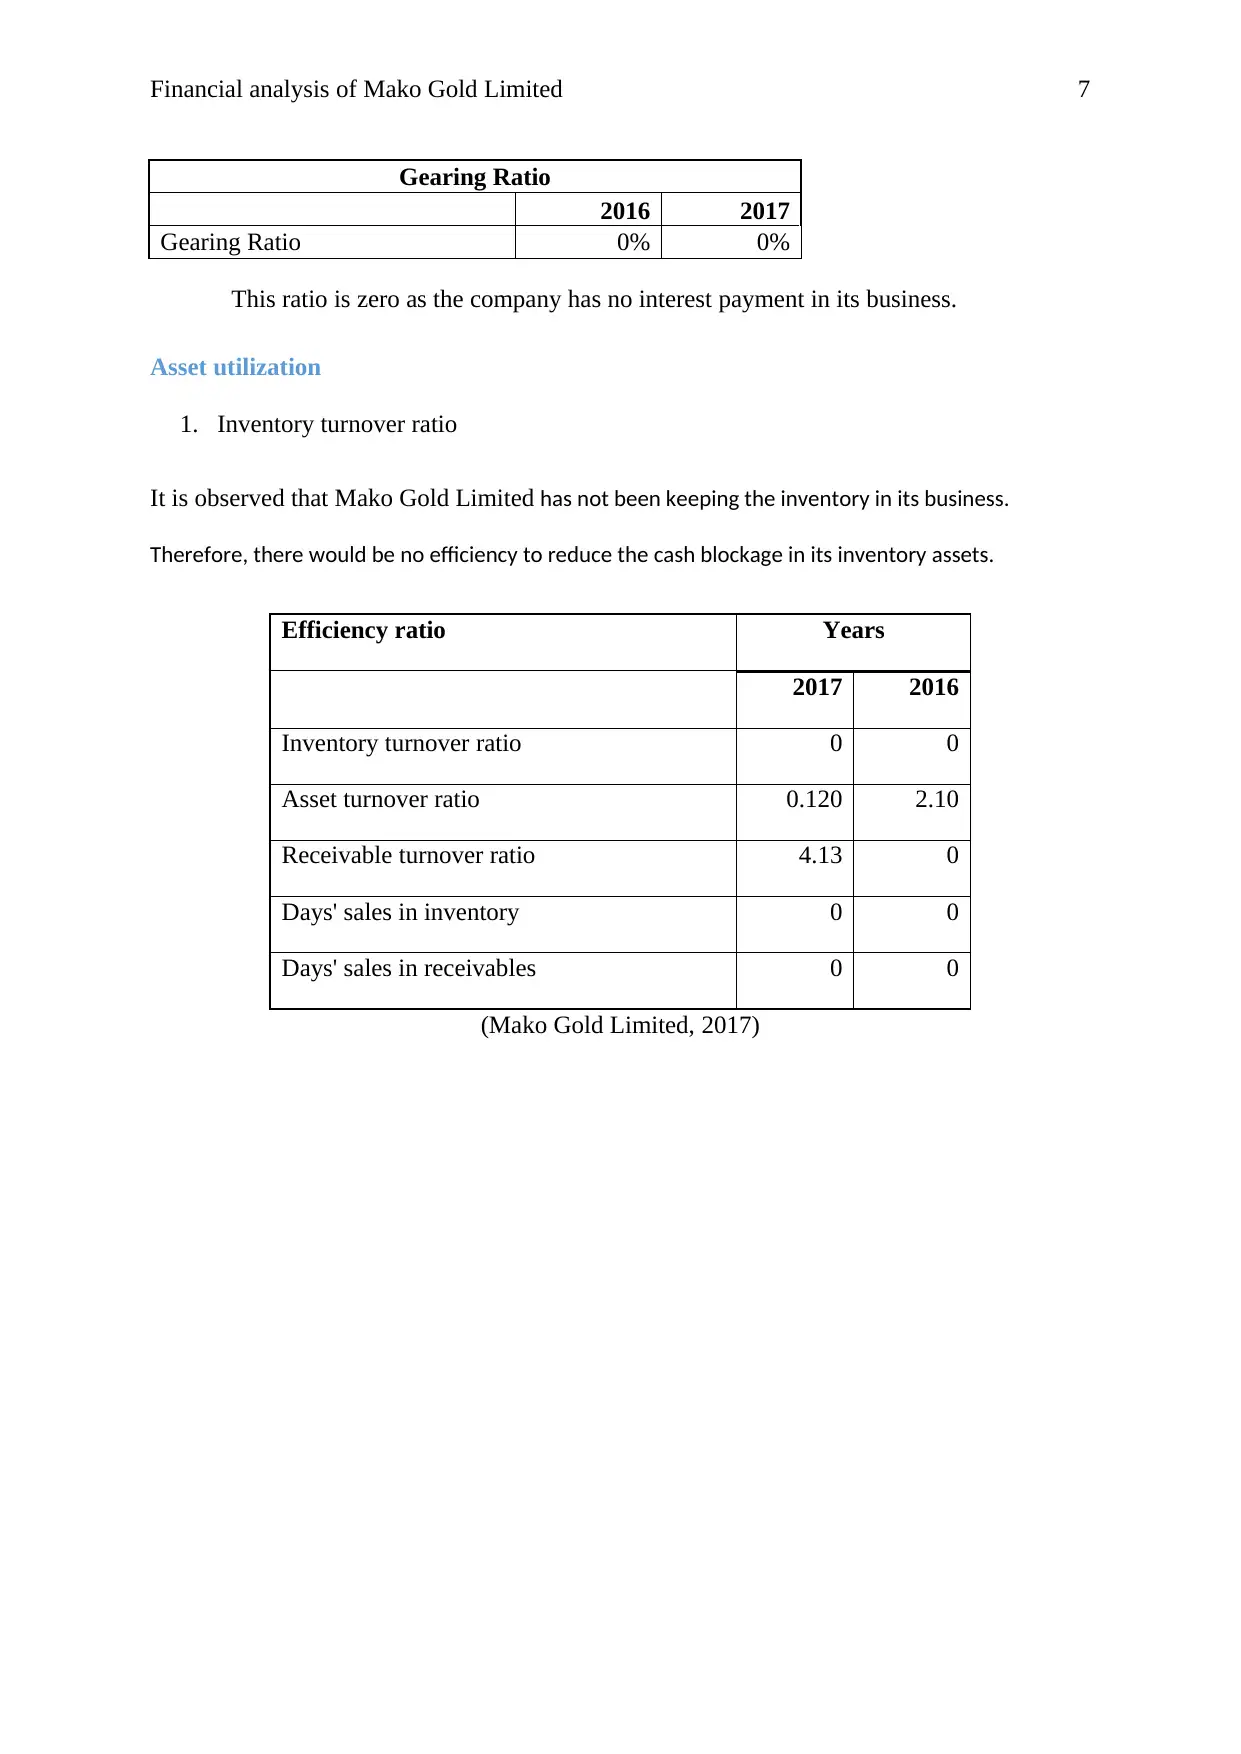
This ratio is zero as the company has no interest payment in its business.
Asset utilization
1. Inventory turnover ratio
It is observed that Mako Gold Limited has not been keeping the inventory in its business.
Therefore, there would be no efficiency to reduce the cash blockage in its inventory assets.
Efficiency ratio Years
2017 2016
Inventory turnover ratio 0 0
Asset turnover ratio 0.120 2.10
Receivable turnover ratio 4.13 0
Days' sales in inventory 0 0
Days' sales in receivables 0 0
(Mako Gold Limited, 2017)
Gearing Ratio
2016 2017
Gearing Ratio 0% 0%
This ratio is zero as the company has no interest payment in its business.
Asset utilization
1. Inventory turnover ratio
It is observed that Mako Gold Limited has not been keeping the inventory in its business.
Therefore, there would be no efficiency to reduce the cash blockage in its inventory assets.
Efficiency ratio Years
2017 2016
Inventory turnover ratio 0 0
Asset turnover ratio 0.120 2.10
Receivable turnover ratio 4.13 0
Days' sales in inventory 0 0
Days' sales in receivables 0 0
(Mako Gold Limited, 2017)
Paraphrase This Document
Need a fresh take? Get an instant paraphrase of this document with our AI Paraphraser
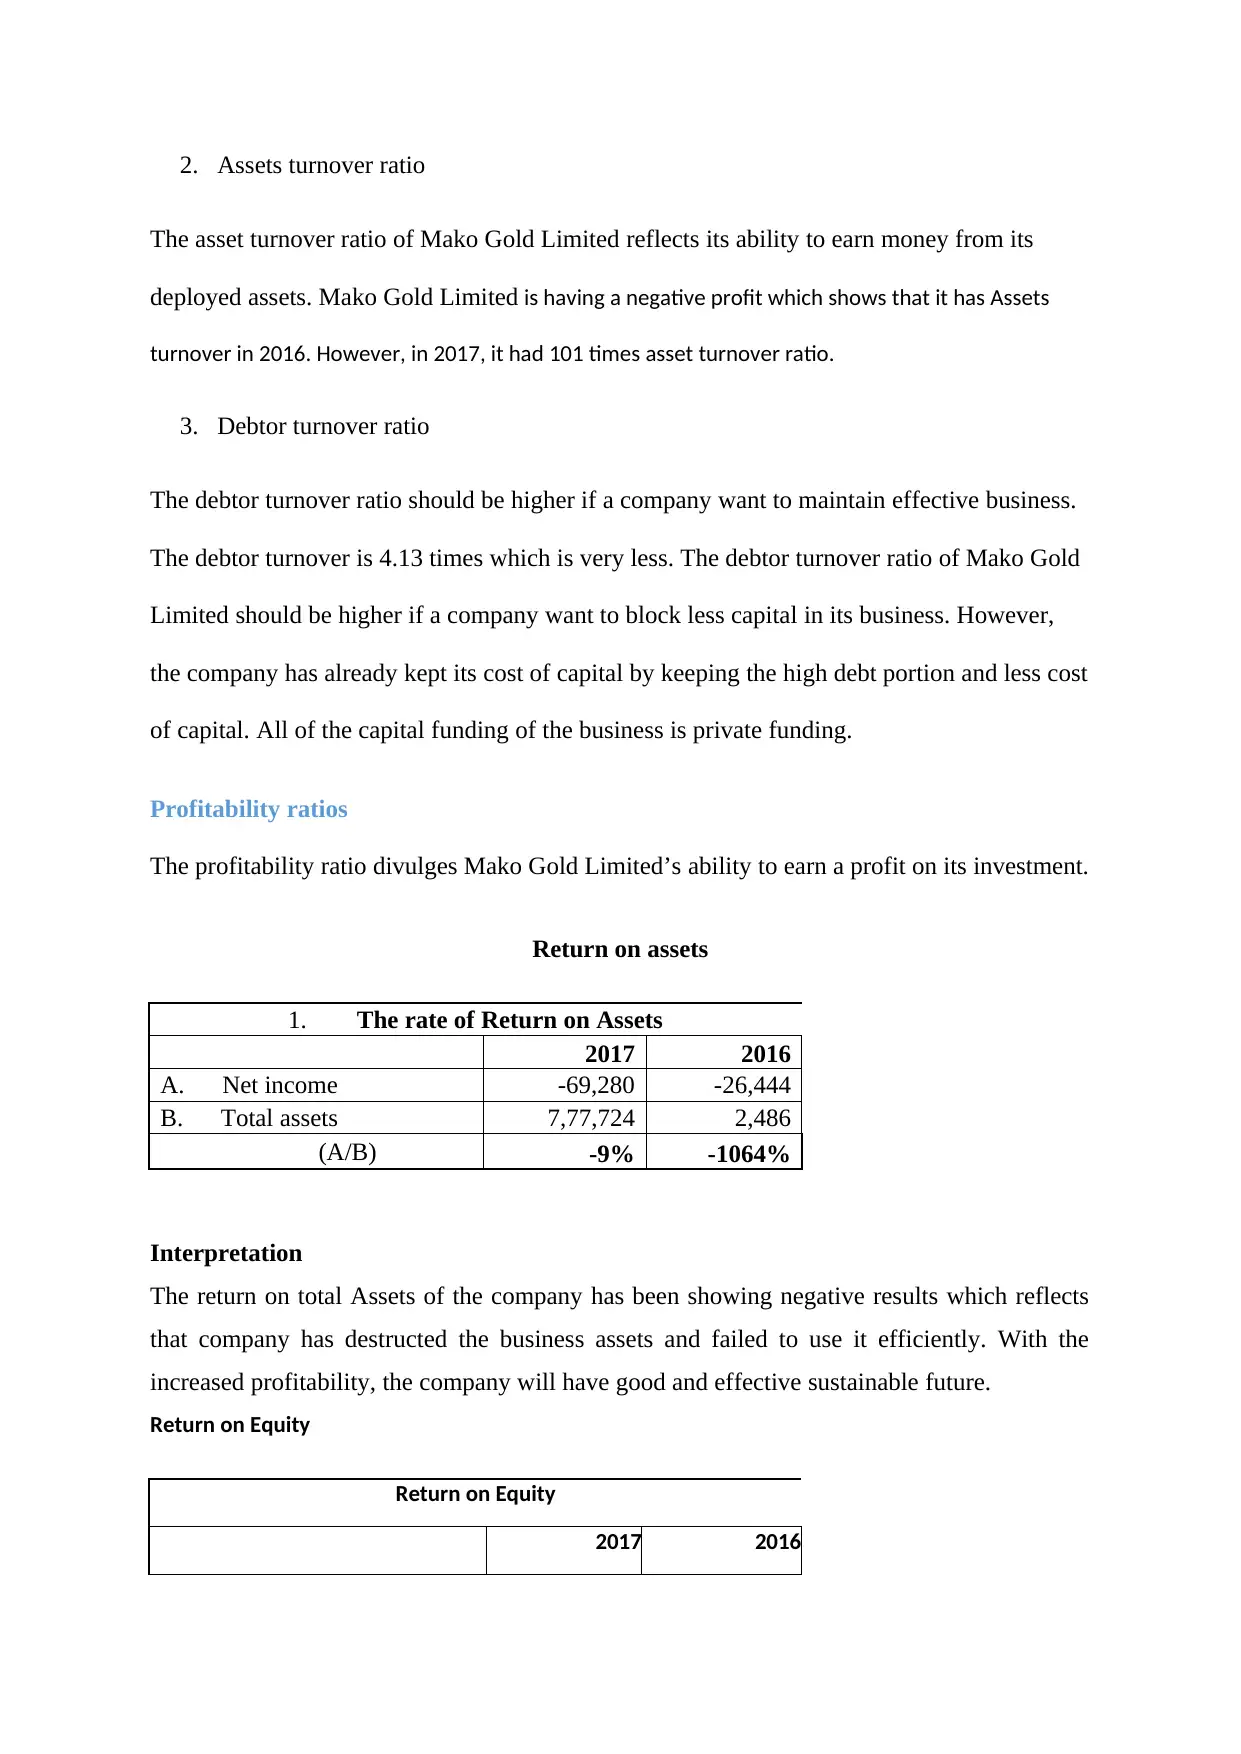
2. Assets turnover ratio
The asset turnover ratio of Mako Gold Limited reflects its ability to earn money from its
deployed assets. Mako Gold Limited is having a negative profit which shows that it has Assets
turnover in 2016. However, in 2017, it had 101 times asset turnover ratio.
3. Debtor turnover ratio
The debtor turnover ratio should be higher if a company want to maintain effective business.
The debtor turnover is 4.13 times which is very less. The debtor turnover ratio of Mako Gold
Limited should be higher if a company want to block less capital in its business. However,
the company has already kept its cost of capital by keeping the high debt portion and less cost
of capital. All of the capital funding of the business is private funding.
Profitability ratios
The profitability ratio divulges Mako Gold Limited’s ability to earn a profit on its investment.
Return on assets
1. The rate of Return on Assets
2017 2016
A. Net income -69,280 -26,444
B. Total assets 7,77,724 2,486
(A/B) -9% -1064%
Interpretation
The return on total Assets of the company has been showing negative results which reflects
that company has destructed the business assets and failed to use it efficiently. With the
increased profitability, the company will have good and effective sustainable future.
Return on Equity
Return on Equity
2017 2016
Financial analysis of Mako Gold Limited 9
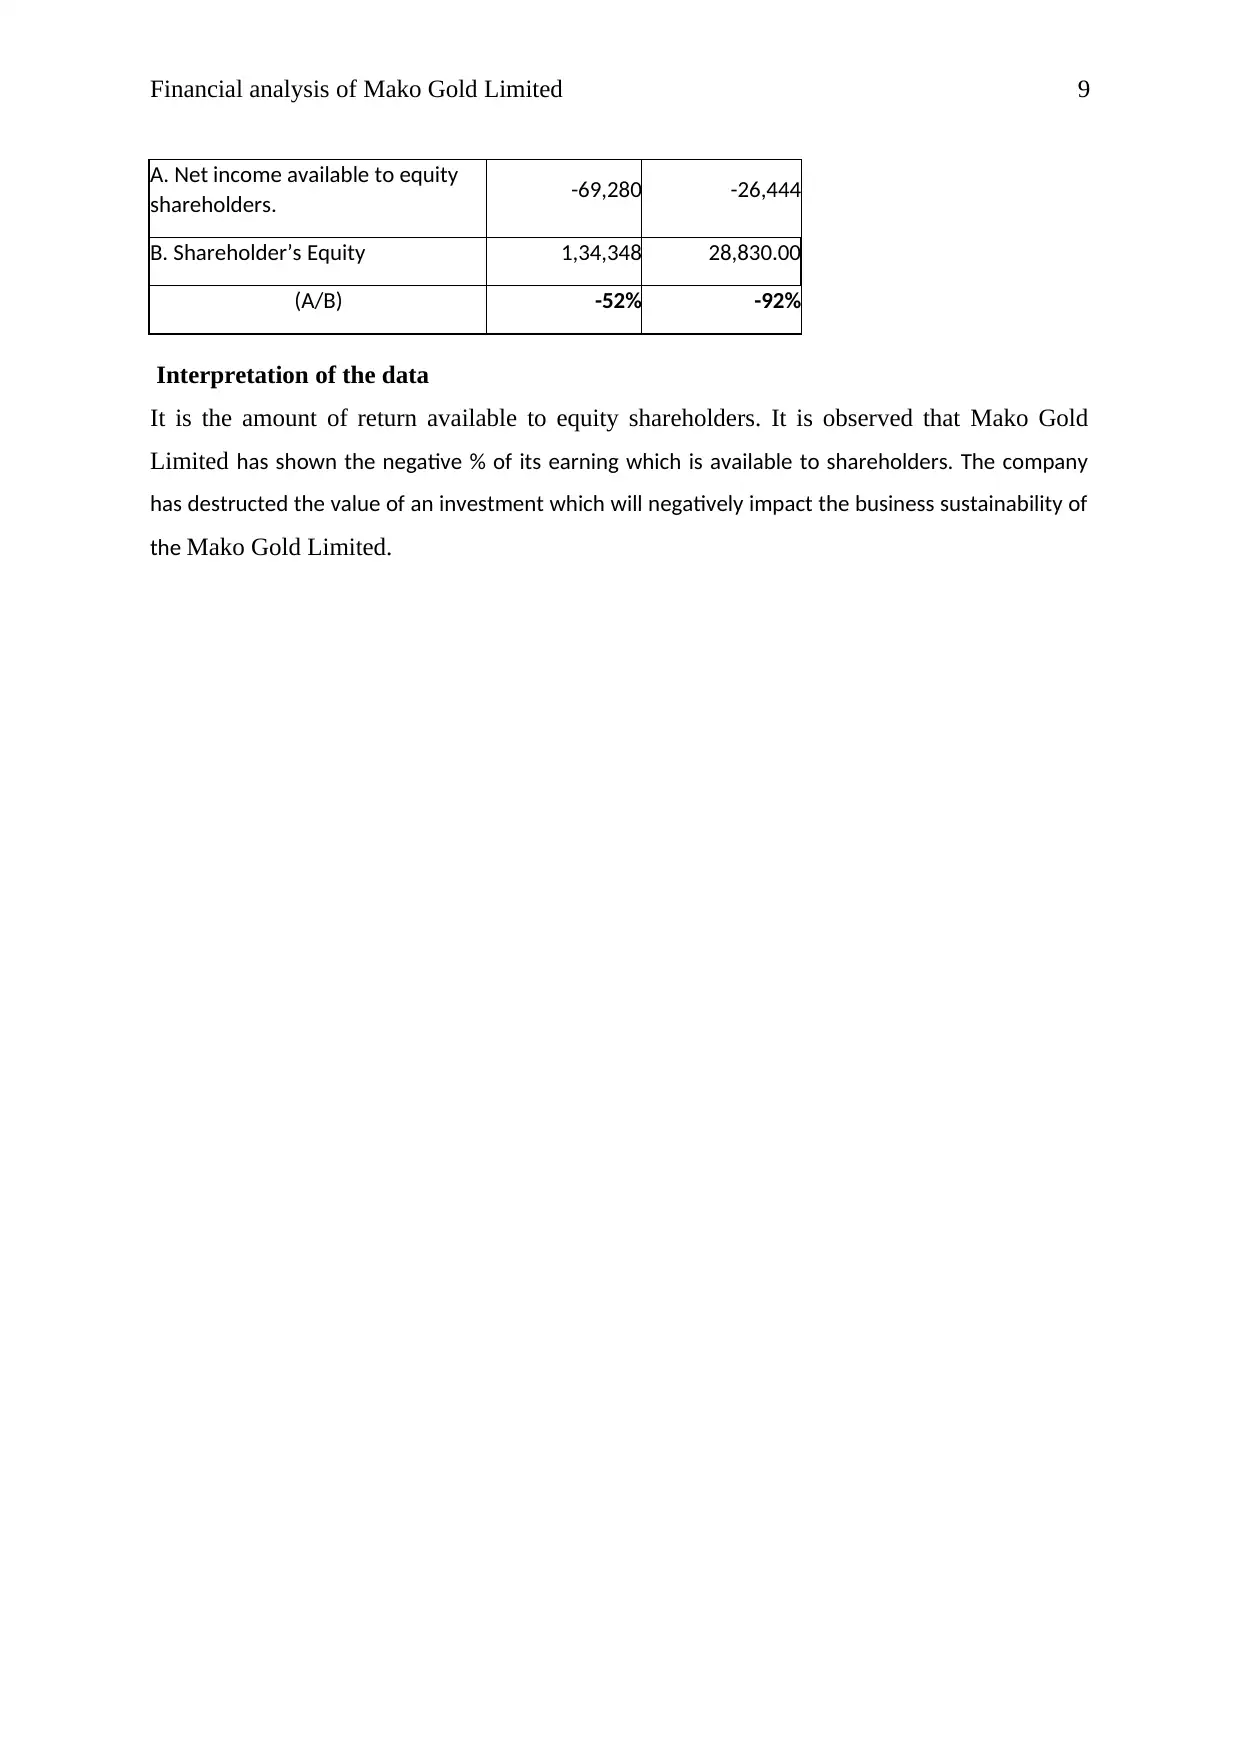
A. Net income available to equity
shareholders. -69,280 -26,444
B. Shareholder’s Equity 1,34,348 28,830.00
(A/B) -52% -92%
Interpretation of the data
It is the amount of return available to equity shareholders. It is observed that Mako Gold
Limited has shown the negative % of its earning which is available to shareholders. The company
has destructed the value of an investment which will negatively impact the business sustainability of
the Mako Gold Limited.
⊘ This is a preview!⊘
Do you want full access?
Subscribe today to unlock all pages.
Trusted by 1+ million students worldwide
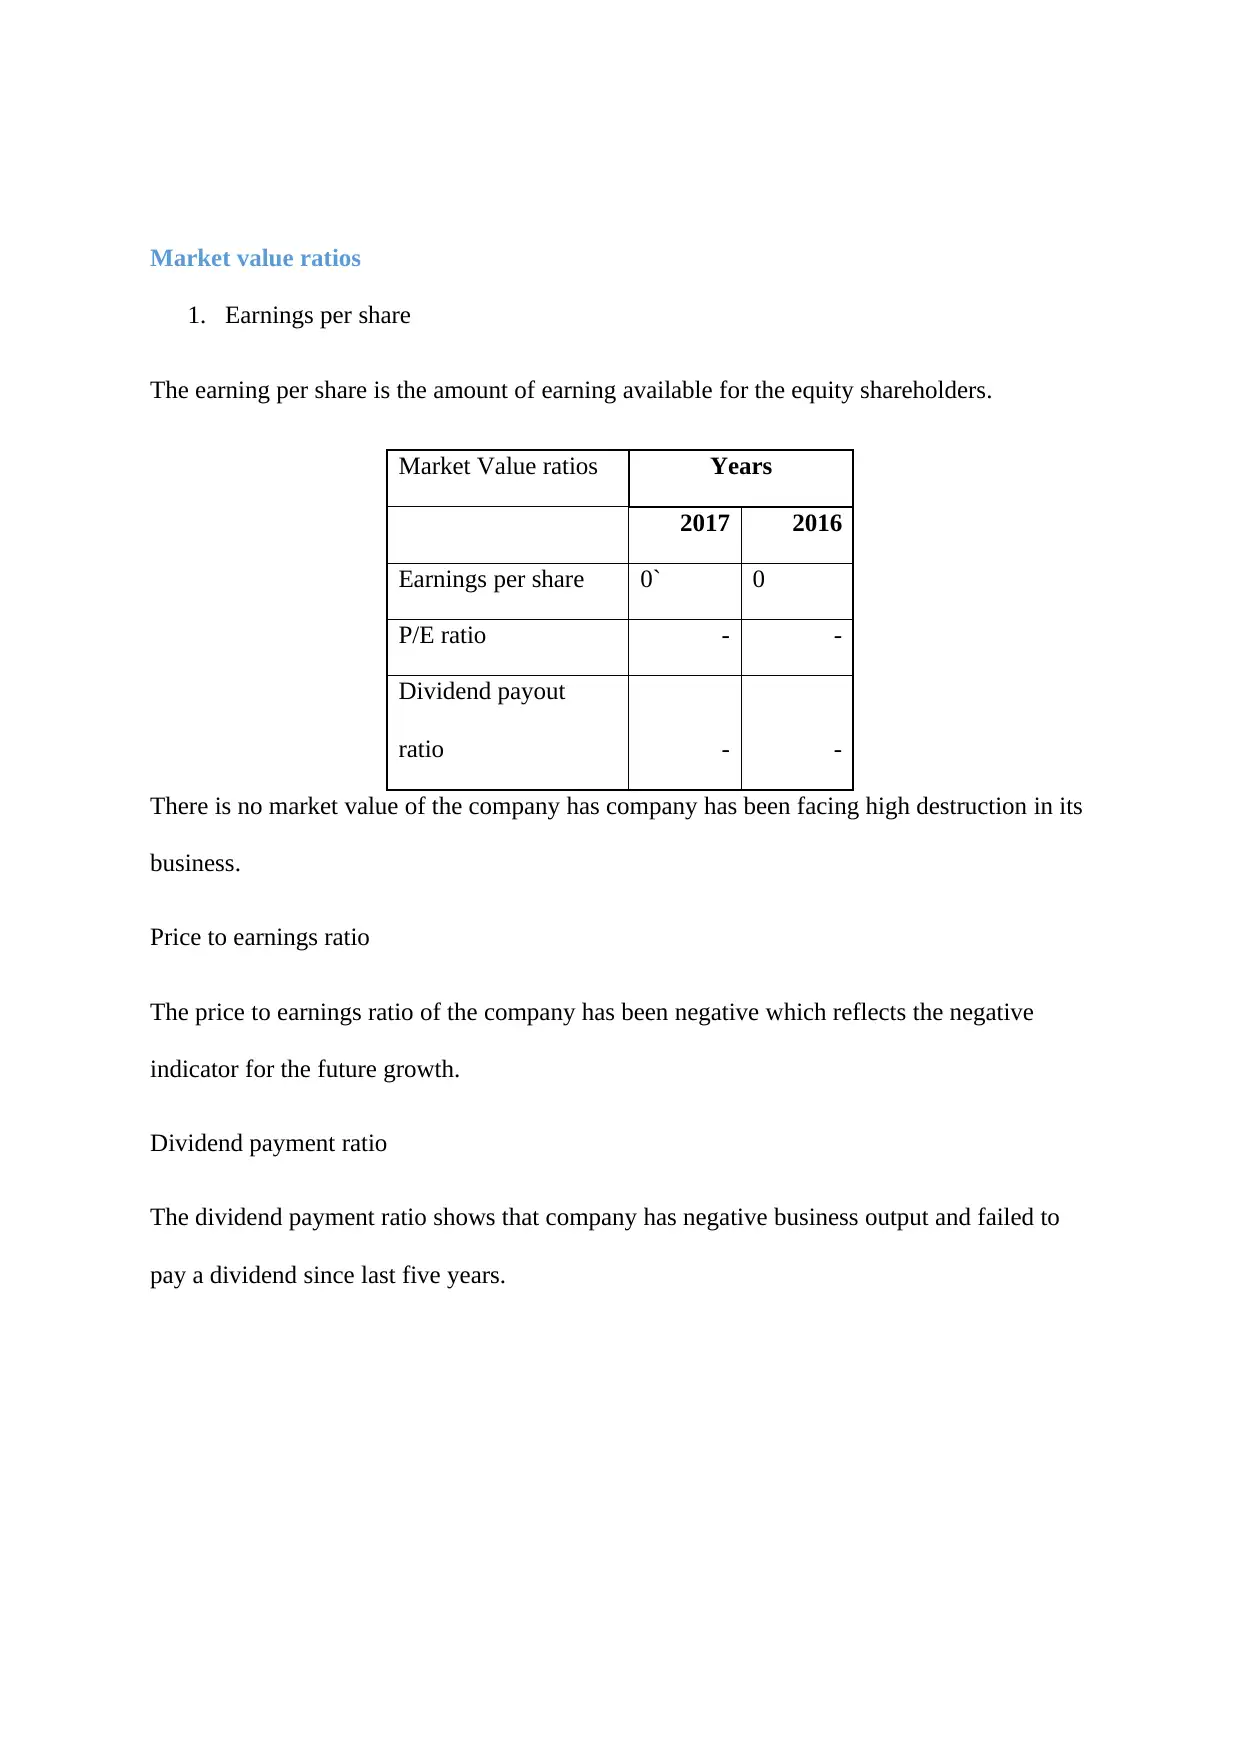
Market value ratios
1. Earnings per share
The earning per share is the amount of earning available for the equity shareholders.
Market Value ratios Years
2017 2016
Earnings per share 0` 0
P/E ratio - -
Dividend payout
ratio - -
There is no market value of the company has company has been facing high destruction in its
business.
Price to earnings ratio
The price to earnings ratio of the company has been negative which reflects the negative
indicator for the future growth.
Dividend payment ratio
The dividend payment ratio shows that company has negative business output and failed to
pay a dividend since last five years.
Paraphrase This Document
Need a fresh take? Get an instant paraphrase of this document with our AI Paraphraser
Financial analysis of Mako Gold Limited 11
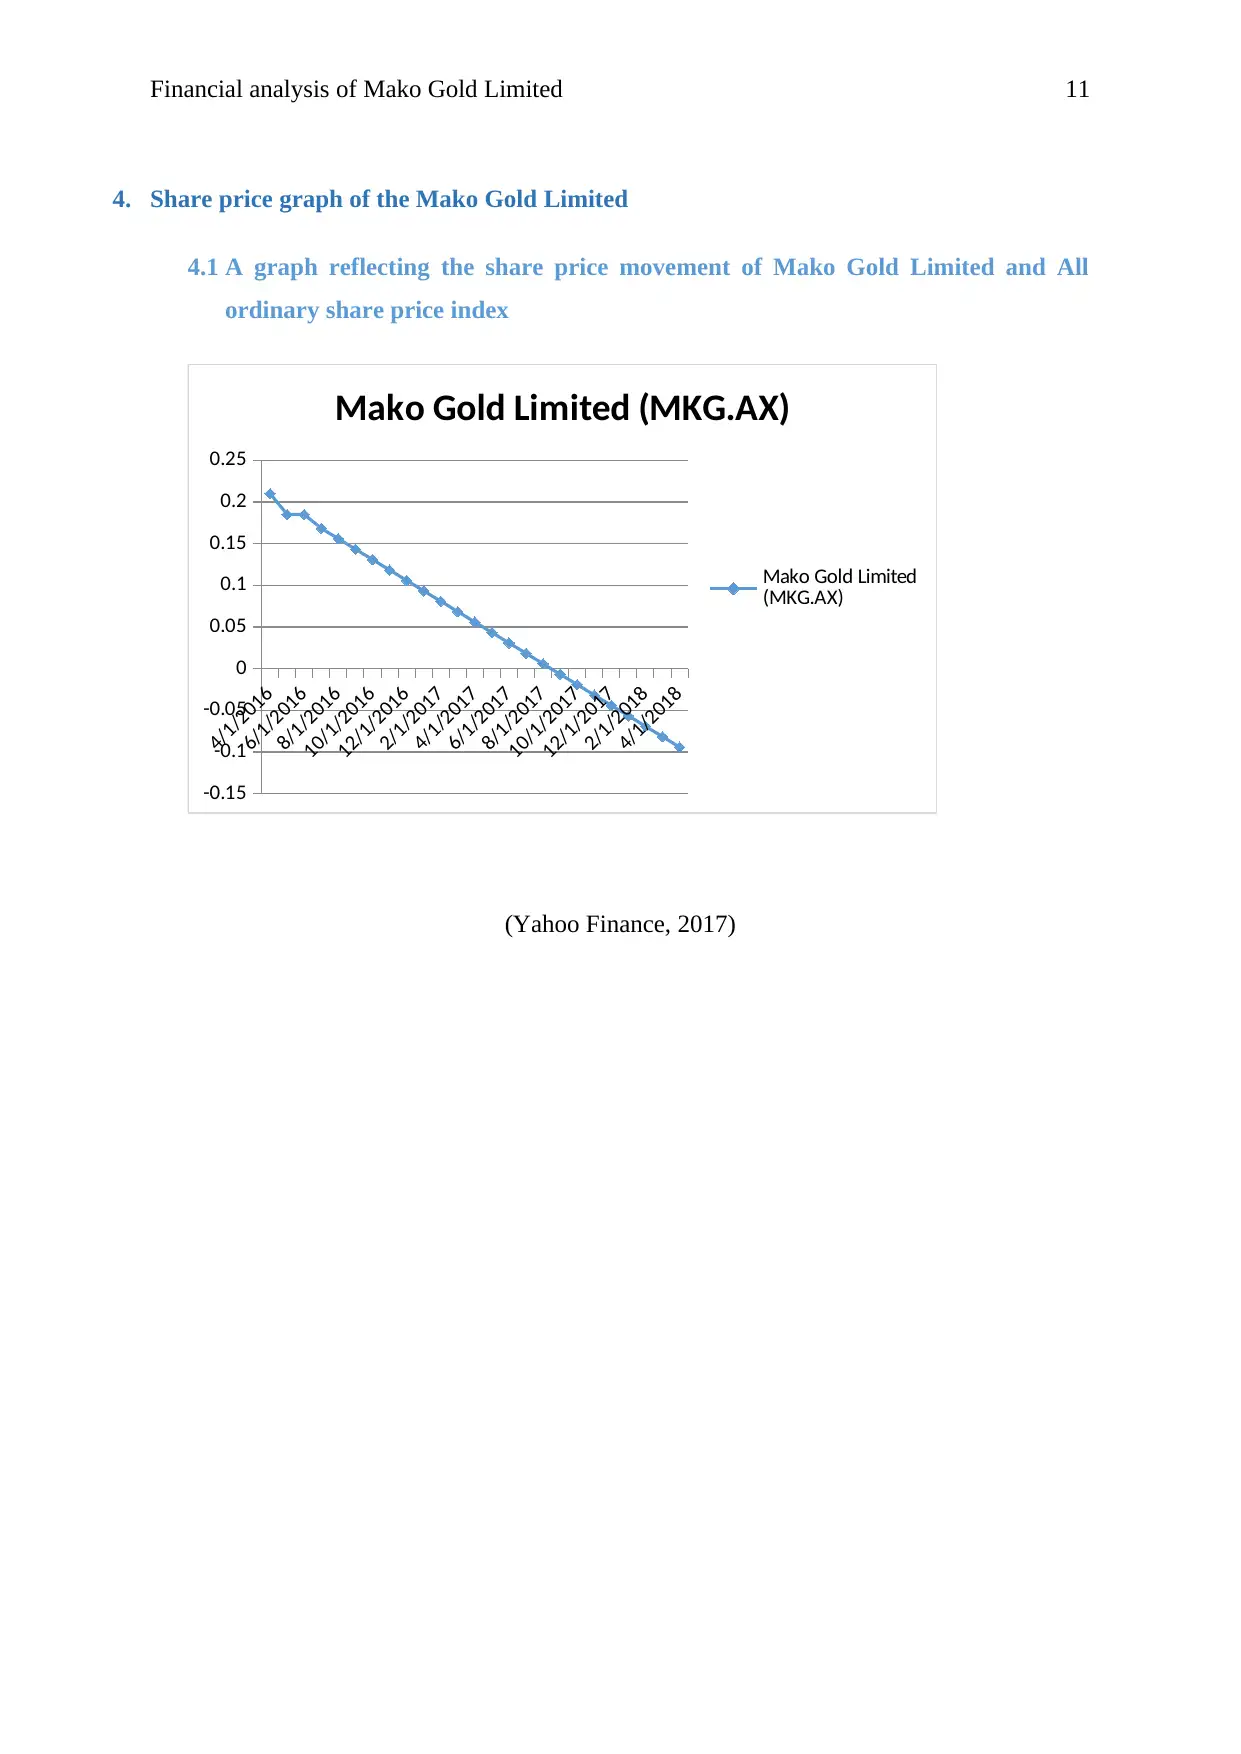
4. Share price graph of the Mako Gold Limited
4.1 A graph reflecting the share price movement of Mako Gold Limited and All
ordinary share price index
4/1/2016
6/1/2016
8/1/2016
10/1/2016
12/1/2016
2/1/2017
4/1/2017
6/1/2017
8/1/2017
10/1/2017
12/1/2017
2/1/2018
4/1/2018
-0.15
-0.1
-0.05
0
0.05
0.1
0.15
0.2
0.25
Mako Gold Limited (MKG.AX)
Mako Gold Limited
(MKG.AX)
(Yahoo Finance, 2017)
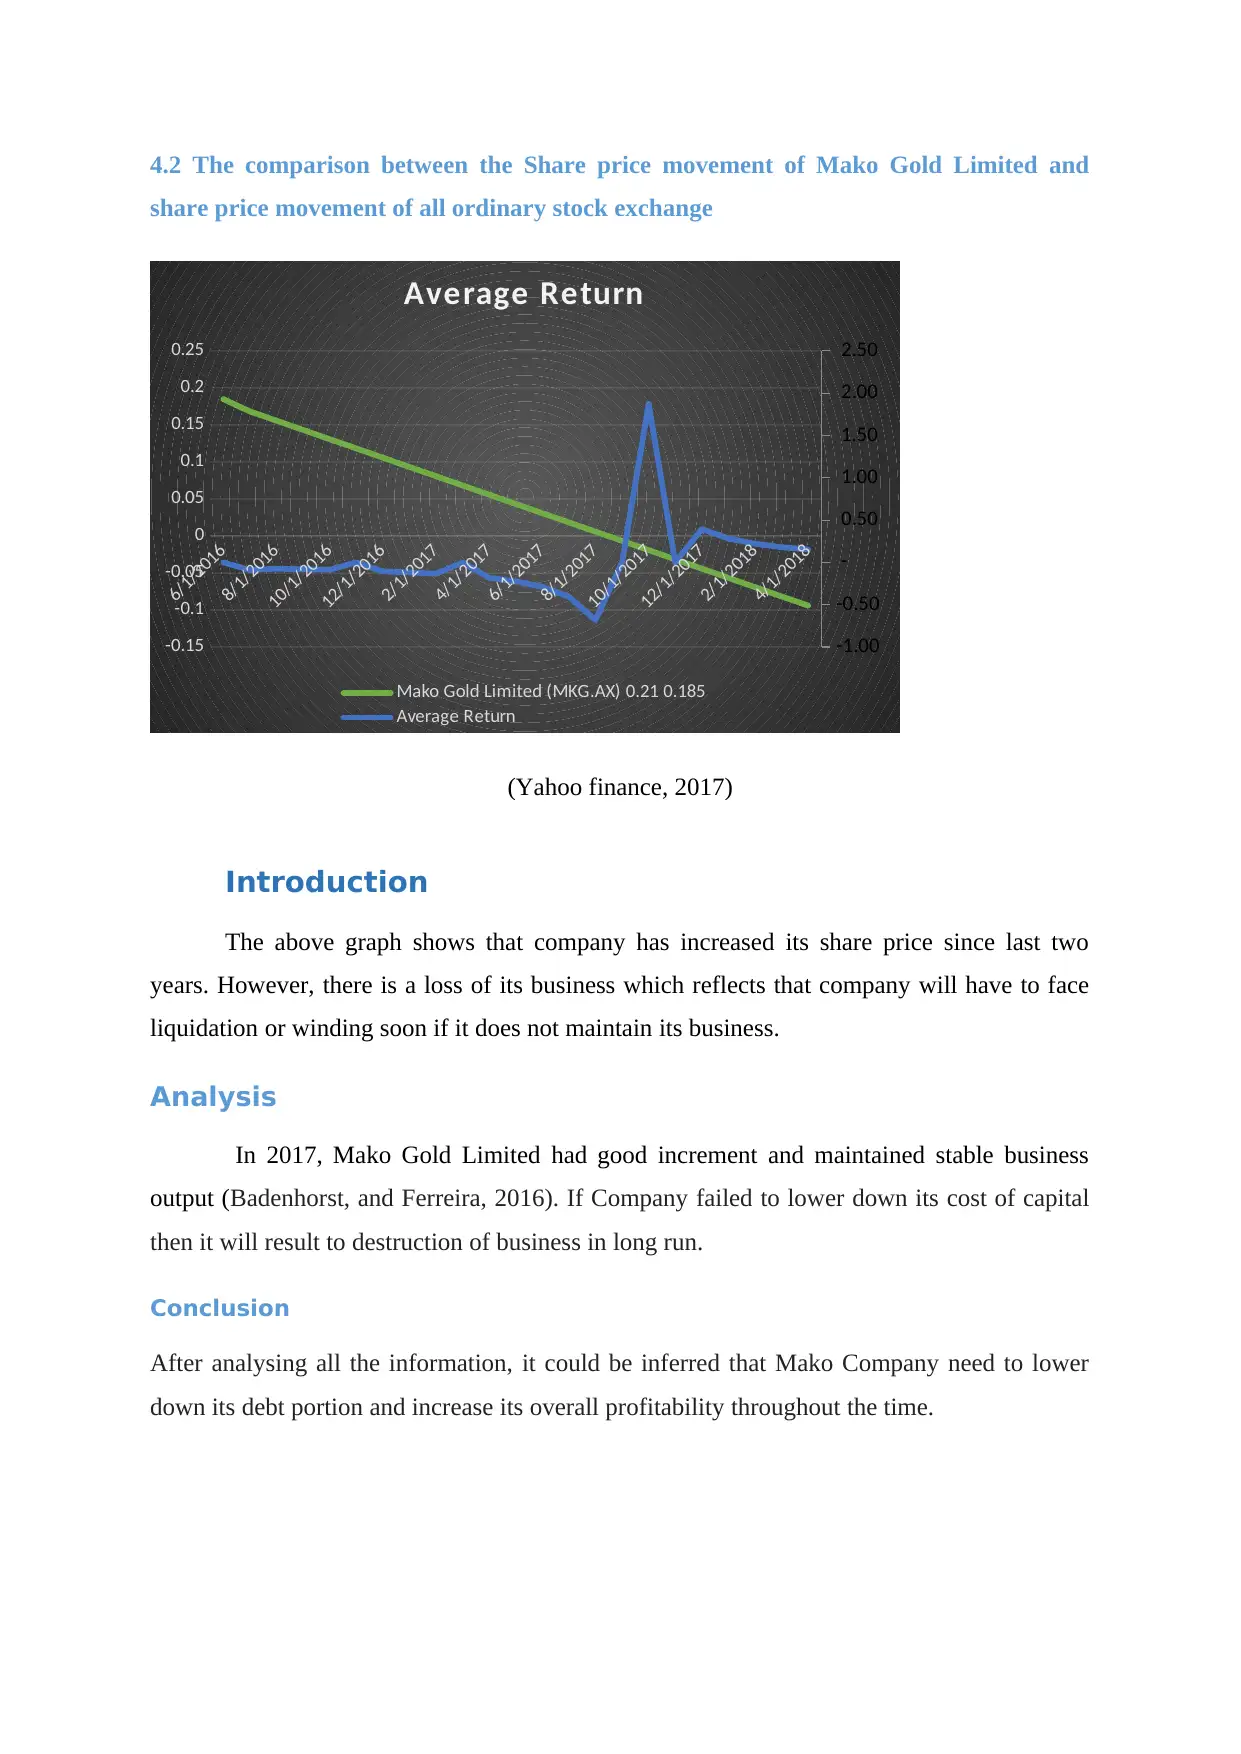
4.2 The comparison between the Share price movement of Mako Gold Limited and
share price movement of all ordinary stock exchange
6/1/2016
8/1/2016
10/1/2016
12/1/2016
2/1/2017
4/1/2017
6/1/2017
8/1/2017
10/1/2017
12/1/2017
2/1/2018
4/1/2018
-0.15
-0.1
-0.05
0
0.05
0.1
0.15
0.2
0.25
-1.00
-0.50
-
0.50
1.00
1.50
2.00
2.50
Average Return
Mako Gold Limited (MKG.AX) 0.21 0.185
Average Return
(Yahoo finance, 2017)
Introduction
The above graph shows that company has increased its share price since last two
years. However, there is a loss of its business which reflects that company will have to face
liquidation or winding soon if it does not maintain its business.
Analysis
In 2017, Mako Gold Limited had good increment and maintained stable business
output (Badenhorst, and Ferreira, 2016). If Company failed to lower down its cost of capital
then it will result to destruction of business in long run.
Conclusion
After analysing all the information, it could be inferred that Mako Company need to lower
down its debt portion and increase its overall profitability throughout the time.
⊘ This is a preview!⊘
Do you want full access?
Subscribe today to unlock all pages.
Trusted by 1+ million students worldwide
1 out of 23
Related Documents


Your All-in-One AI-Powered Toolkit for Academic Success.
+13062052269
info@desklib.com
Available 24*7 on WhatsApp / Email
![[object Object]](/_next/static/media/star-bottom.7253800d.svg)
Unlock your academic potential
Copyright © 2020–2026 A2Z Services. All Rights Reserved. Developed and managed by ZUCOL.