HI5002 Finance for Business: Qantas Airways Financial Analysis
VerifiedAdded on 2023/06/12
|20
|4178
|212
Report
AI Summary
This report provides a comprehensive financial analysis of Qantas Airways Ltd., utilizing ratio analysis, the Capital Asset Pricing Model (CAPM), and an examination of the company's dividend policy. It assesses the airline's liquidity, solvency, profitability, and market position. The report calculates the weighted average cost of capital to evaluate the effectiveness of the company's capital structure and uses the beta factor to determine the impact of market volatility on the price of Qantas securities. A correlation analysis is performed comparing Qantas's share price movement with the All Ordinaries index. The analysis culminates in a recommendation letter, advising investors to carefully monitor Qantas's future performance in light of its growth initiatives before making investment decisions. Desklib offers a range of resources for students, including past papers and solved assignments.
1
HI5002
Finance for Business
HI5002
Finance for Business
Paraphrase This Document
Need a fresh take? Get an instant paraphrase of this document with our AI Paraphraser
2
Executive Summary
The report has carried out analysis of the financial performance of Qantas Airways Ltd.
The financial performance is carried out with the use of ratio analysis, CAPM model and
calculation of cost of debt and cost of equity. The report has also discussed the dividend policy
of the airline as well to demonstrate its ability to provide return to shareholders. Lastly, the letter
of recommendations has suggested the investors to wait and analyze the future performance of
the airline. The airline has made strong announcements in relation to its future growth and
therefore investors need to wait and analyze the impact of potential growth opportunities son its
financial outcomes.
3
Contents
Executive Summary.........................................................................................................................2
Introduction......................................................................................................................................4
1. Description of the Company........................................................................................................4
2. Ownership-Governance Structure of Qantas Airlines.................................................................5
3: Calculation of fundamental ratio of Qantas Airlines...................................................................6
4: Share Price Movement OF Qantas Airways and All Ordinaries in last two years (1 Jan, 2016
to 31 Dec, 2017)..............................................................................................................................9
5. Research carries out in context of Financial or Business Publications.....................................13
6: Use of Capital assets pricing model to find out the required rate of return of Qantas Airways14
7: Application of Weighted Average cost of capital.....................................................................15
8: Discussion on the capital structure of the company..................................................................16
9: Dividend Policy of Qantas Airways..........................................................................................17
10: Recommendation Letter..........................................................................................................17
References......................................................................................................................................19
⊘ This is a preview!⊘
Do you want full access?
Subscribe today to unlock all pages.
Trusted by 1+ million students worldwide
4
Introduction
The report is developed for the purpose of facilitating the decision-making process of
investors seeking to invest in a company listed on ASX. The company selected in this regards is
Qantas Airways Ltd. The financial analysis is carried out for proving an insight into the present
and future growth prospects of the company. This will help in developing a solid base to the
investors for guiding their decision-making process related to investment. The financial
performance is carried out with the help of performance ratios that assesses the liquidity,
solvency, and profitability and market conditions of the company. Also, the report has calculated
the weighted verge cost of capital for analyzing the capital structure effectiveness of the
company. The debt ratios will provide an analysis relating to the use of debt by the company for
financing its business operations. The impact of market volatility on the price of its securities is
determined by the use of beta factor with the use of CAPM model. Also, the dividend policy of
the company is described to gain an analysis of its capability to create value for the shareholders.
At last, the letter of recommendations is developed for client to facilitate the investment related
decisions in support of the overall analysis carried out.
1. Description of the Company
Qantas Airways, a flag carrier and largest airline of Australia established in the year 1920
and operates both domestic and international airline. It is involved in carrying out both the
operations including domestic and international air transportation services. The airline after its
establishment has grown into one of the major long distance airline and recognized brands within
Australia. The airline has developed its reputation by gaining excellence in safety, operational
reliability, engineering, and maintenance and customer service. The main business operations of
the airline includes providing world class transportation services with its two brands, that are,
Qantas and Jetstar. It also carries out subsidiary businesses that include operations in specialist
markets such as Q Catering. The airline provides employment to about 30,000 people and the
majority of them constitute the local workforce. The company aims to achieve the position of
best airline in the world by carrying out its operations in a sustainable manner. The business
strategy of the company is to accomplish its aims and objectives by placing emphasis on safety,
Paraphrase This Document
Need a fresh take? Get an instant paraphrase of this document with our AI Paraphraser
5
sustainable operations, strong reputation and environmental responsibility (Qantas Airways Ltd,
2018).
2. Ownership-Governance Structure of Qantas Airlines
i. Major Shareholders
The major shareholders of the airline having more than 5% and 20% of the shareholdings
are HSBC Custody Nominees Ltd (40.21%), JP Morgan Nominees Australia Limited (17.93%)
and Citicorp Nominees Pty Ltd (9.19%). The airline is classified as a non-family company as its
shareholders does not have any role in its ownership and governance structure.
ii. Major People Involved in Firm Governance
The Chairman
Leigh Clifford is the chairman of the company appointed in the year 2007 and is
responsible for over-viewing the roles and responsibilities of the Board.
The Board Members
6
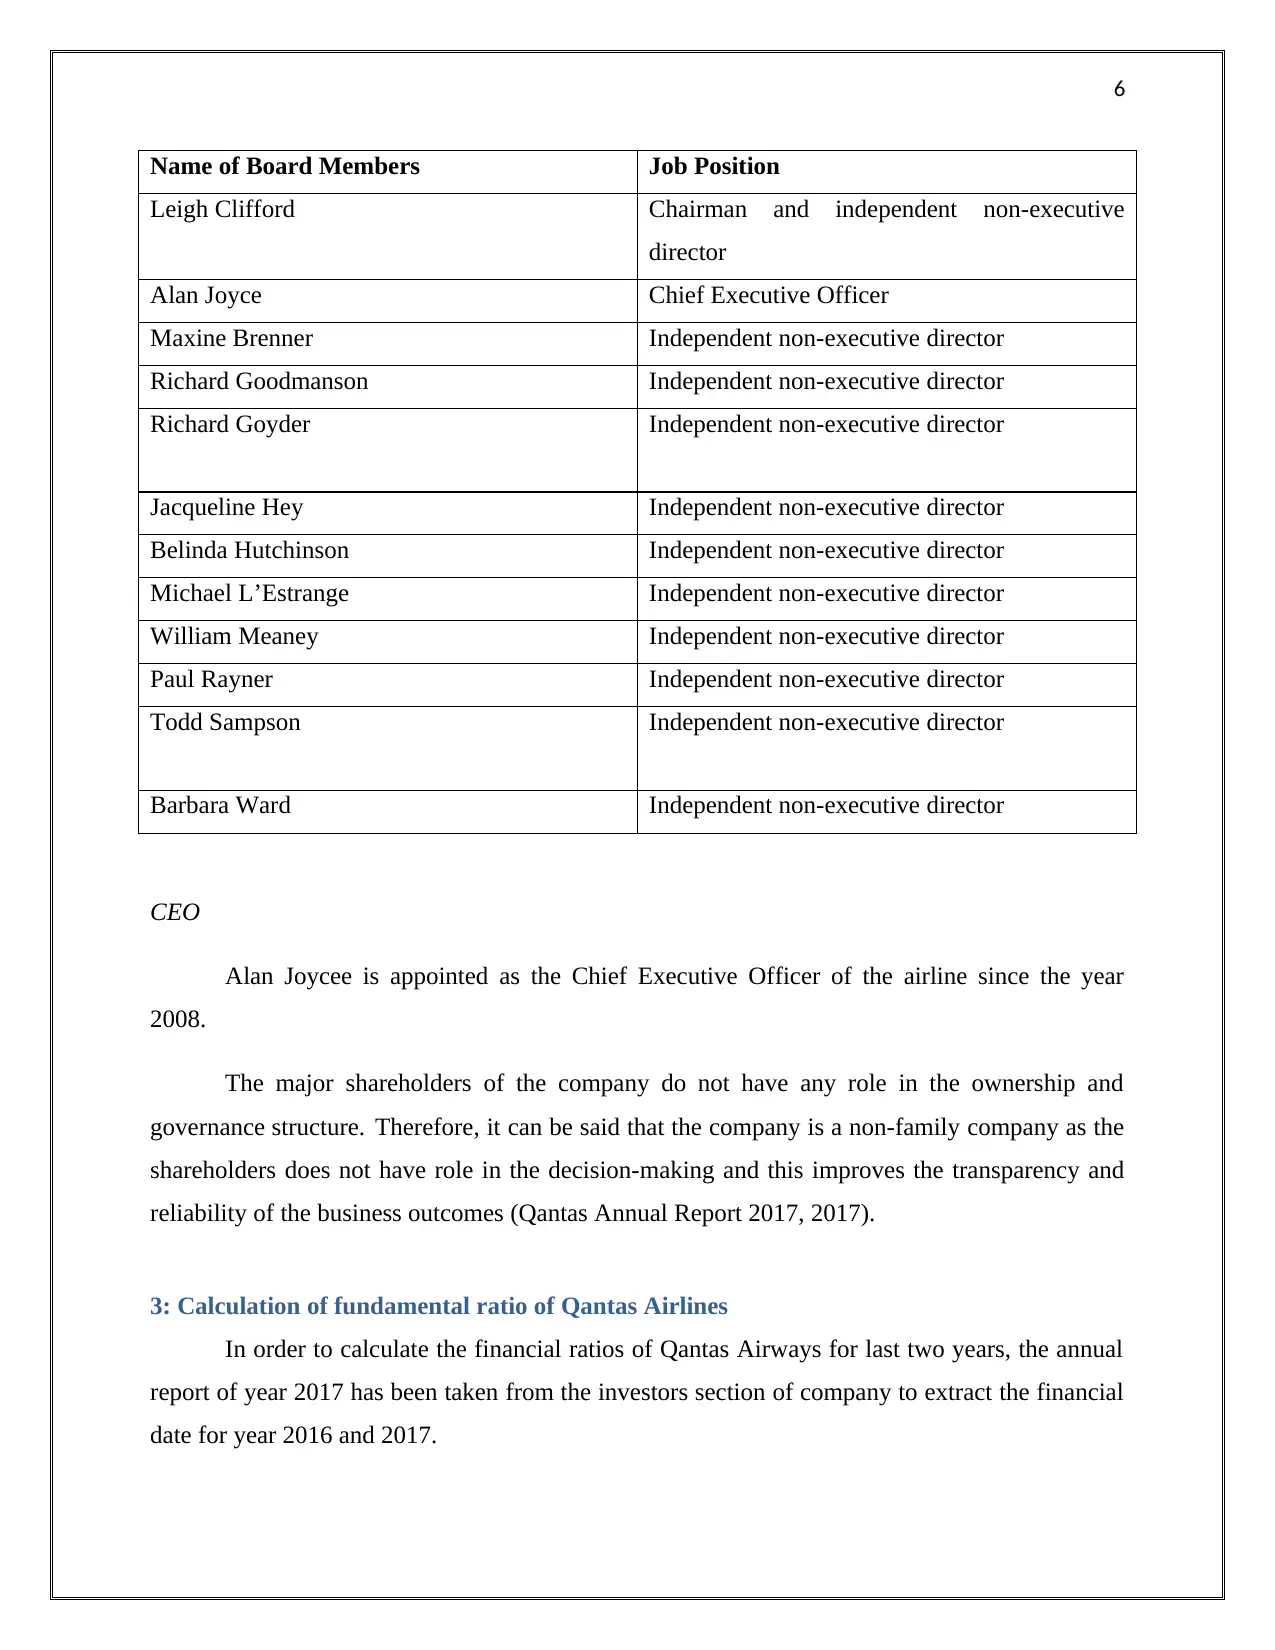
Name of Board Members Job Position
Leigh Clifford Chairman and independent non-executive
director
Alan Joyce Chief Executive Officer
Maxine Brenner Independent non-executive director
Richard Goodmanson Independent non-executive director
Richard Goyder Independent non-executive director
Jacqueline Hey Independent non-executive director
Belinda Hutchinson Independent non-executive director
Michael L’Estrange Independent non-executive director
William Meaney Independent non-executive director
Paul Rayner Independent non-executive director
Todd Sampson Independent non-executive director
Barbara Ward Independent non-executive director
CEO
Alan Joycee is appointed as the Chief Executive Officer of the airline since the year
2008.
The major shareholders of the company do not have any role in the ownership and
governance structure. Therefore, it can be said that the company is a non-family company as the
shareholders does not have role in the decision-making and this improves the transparency and
reliability of the business outcomes (Qantas Annual Report 2017, 2017).
3: Calculation of fundamental ratio of Qantas Airlines
In order to calculate the financial ratios of Qantas Airways for last two years, the annual
report of year 2017 has been taken from the investors section of company to extract the financial
date for year 2016 and 2017.
⊘ This is a preview!⊘
Do you want full access?
Subscribe today to unlock all pages.
Trusted by 1+ million students worldwide
7
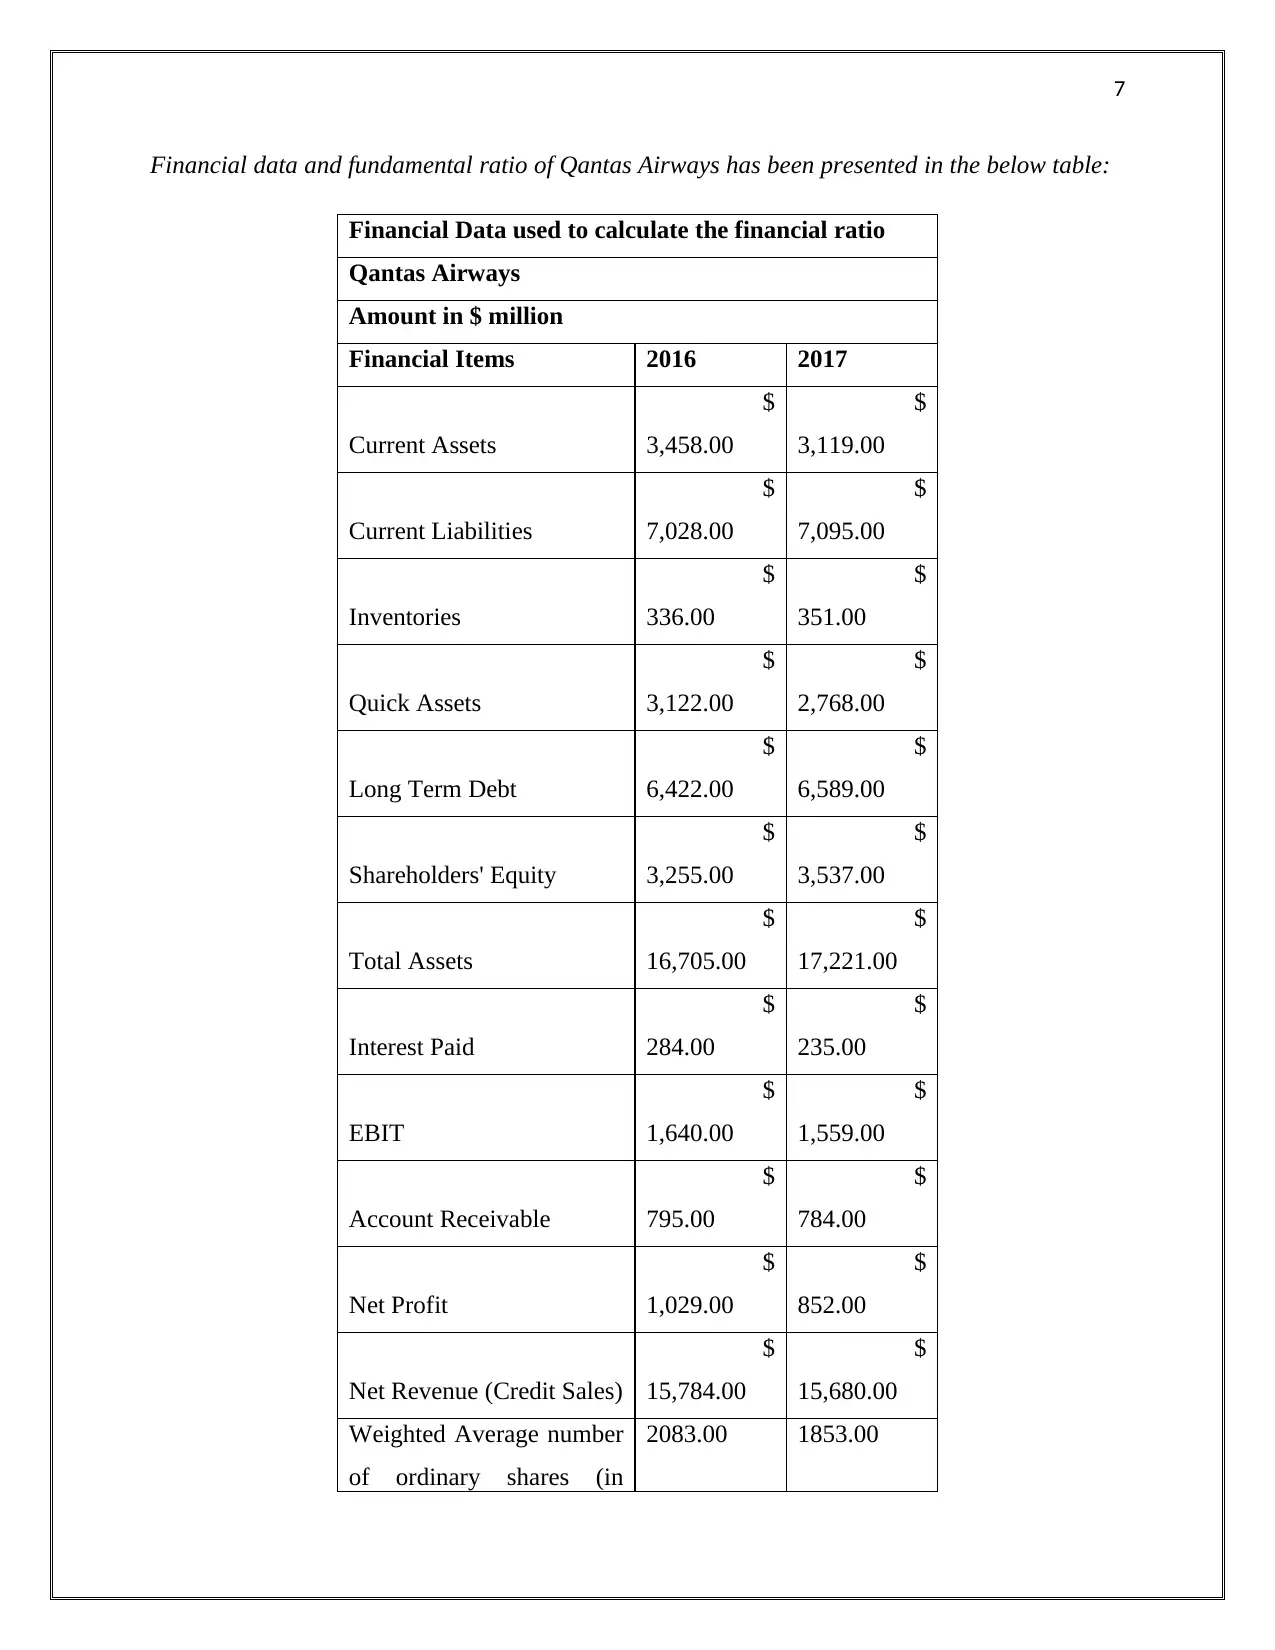
Financial data and fundamental ratio of Qantas Airways has been presented in the below table:
Financial Data used to calculate the financial ratio
Qantas Airways
Amount in $ million
Financial Items 2016 2017
Current Assets
$
3,458.00
$
3,119.00
Current Liabilities
$
7,028.00
$
7,095.00
Inventories
$
336.00
$
351.00
Quick Assets
$
3,122.00
$
2,768.00
Long Term Debt
$
6,422.00
$
6,589.00
Shareholders' Equity
$
3,255.00
$
3,537.00
Total Assets
$
16,705.00
$
17,221.00
Interest Paid
$
284.00
$
235.00
EBIT
$
1,640.00
$
1,559.00
Account Receivable
$
795.00
$
784.00
Net Profit
$
1,029.00
$
852.00
Net Revenue (Credit Sales)
$
15,784.00
$
15,680.00
Weighted Average number
of ordinary shares (in
2083.00 1853.00
Paraphrase This Document
Need a fresh take? Get an instant paraphrase of this document with our AI Paraphraser
8
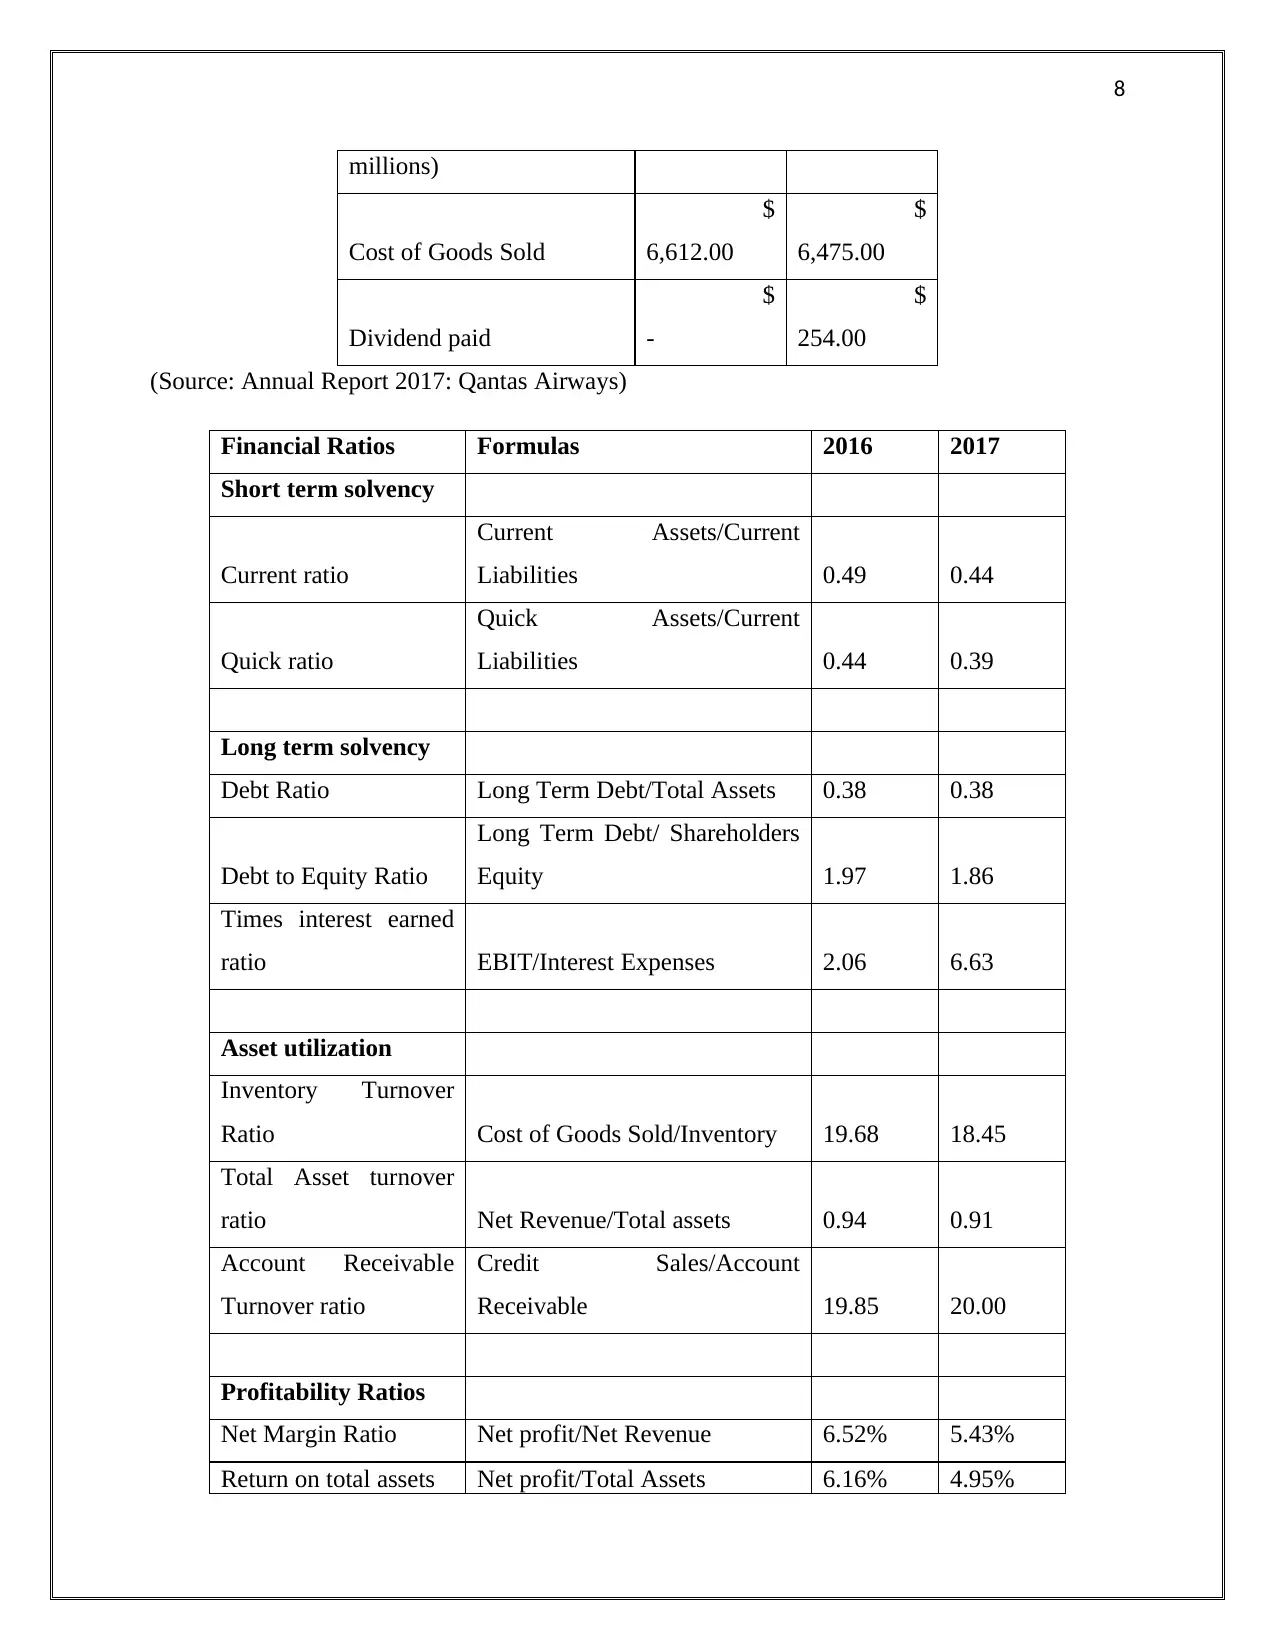
millions)
Cost of Goods Sold
$
6,612.00
$
6,475.00
Dividend paid
$
-
$
254.00
(Source: Annual Report 2017: Qantas Airways)
Financial Ratios Formulas 2016 2017
Short term solvency
Current ratio
Current Assets/Current
Liabilities 0.49 0.44
Quick ratio
Quick Assets/Current
Liabilities 0.44 0.39
Long term solvency
Debt Ratio Long Term Debt/Total Assets 0.38 0.38
Debt to Equity Ratio
Long Term Debt/ Shareholders
Equity 1.97 1.86
Times interest earned
ratio EBIT/Interest Expenses 2.06 6.63
Asset utilization
Inventory Turnover
Ratio Cost of Goods Sold/Inventory 19.68 18.45
Total Asset turnover
ratio Net Revenue/Total assets 0.94 0.91
Account Receivable
Turnover ratio
Credit Sales/Account
Receivable 19.85 20.00
Profitability Ratios
Net Margin Ratio Net profit/Net Revenue 6.52% 5.43%
Return on total assets Net profit/Total Assets 6.16% 4.95%
9
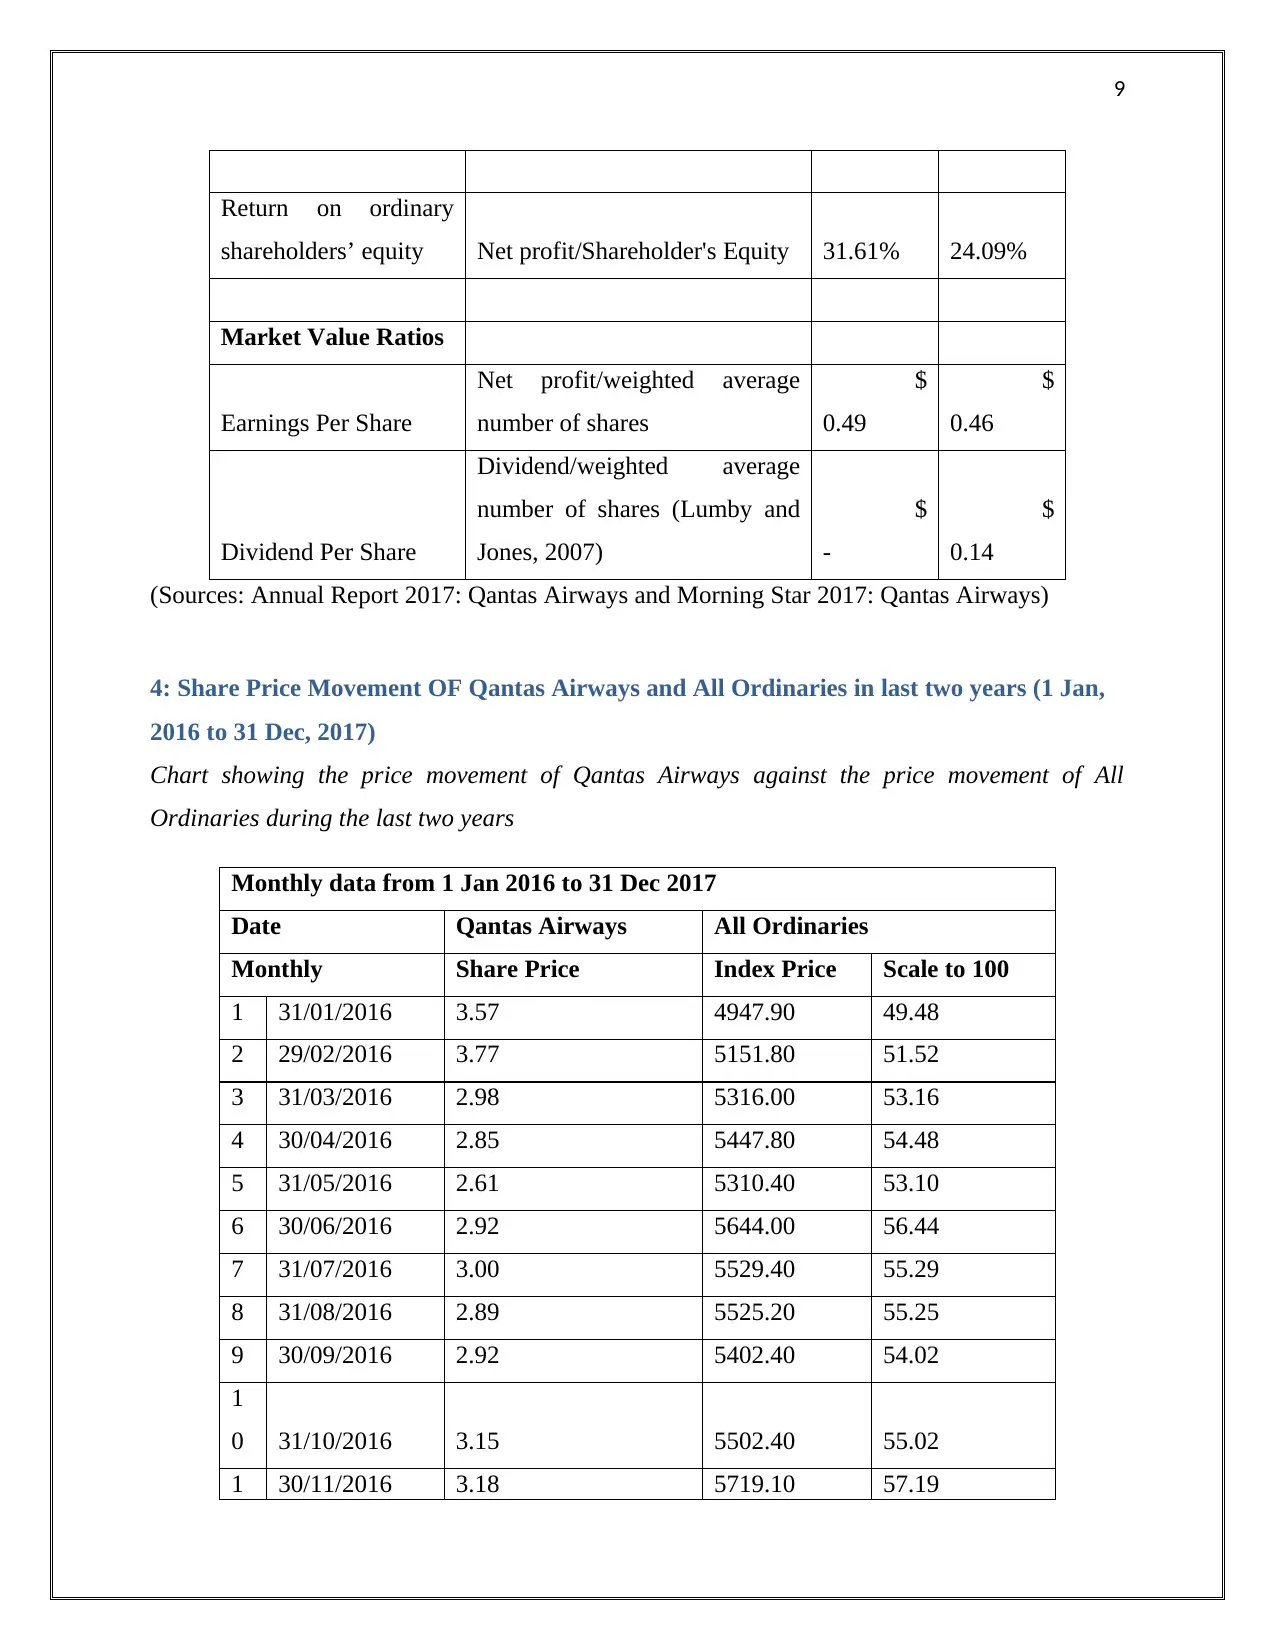
Return on ordinary
shareholders’ equity Net profit/Shareholder's Equity 31.61% 24.09%
Market Value Ratios
Earnings Per Share
Net profit/weighted average
number of shares
$
0.49
$
0.46
Dividend Per Share
Dividend/weighted average
number of shares (Lumby and
Jones, 2007)
$
-
$
0.14
(Sources: Annual Report 2017: Qantas Airways and Morning Star 2017: Qantas Airways)
4: Share Price Movement OF Qantas Airways and All Ordinaries in last two years (1 Jan,
2016 to 31 Dec, 2017)
Chart showing the price movement of Qantas Airways against the price movement of All
Ordinaries during the last two years
Monthly data from 1 Jan 2016 to 31 Dec 2017
Date Qantas Airways All Ordinaries
Monthly Share Price Index Price Scale to 100
1 31/01/2016 3.57 4947.90 49.48
2 29/02/2016 3.77 5151.80 51.52
3 31/03/2016 2.98 5316.00 53.16
4 30/04/2016 2.85 5447.80 54.48
5 31/05/2016 2.61 5310.40 53.10
6 30/06/2016 2.92 5644.00 56.44
7 31/07/2016 3.00 5529.40 55.29
8 31/08/2016 2.89 5525.20 55.25
9 30/09/2016 2.92 5402.40 54.02
1
0 31/10/2016 3.15 5502.40 55.02
1 30/11/2016 3.18 5719.10 57.19
⊘ This is a preview!⊘
Do you want full access?
Subscribe today to unlock all pages.
Trusted by 1+ million students worldwide
10
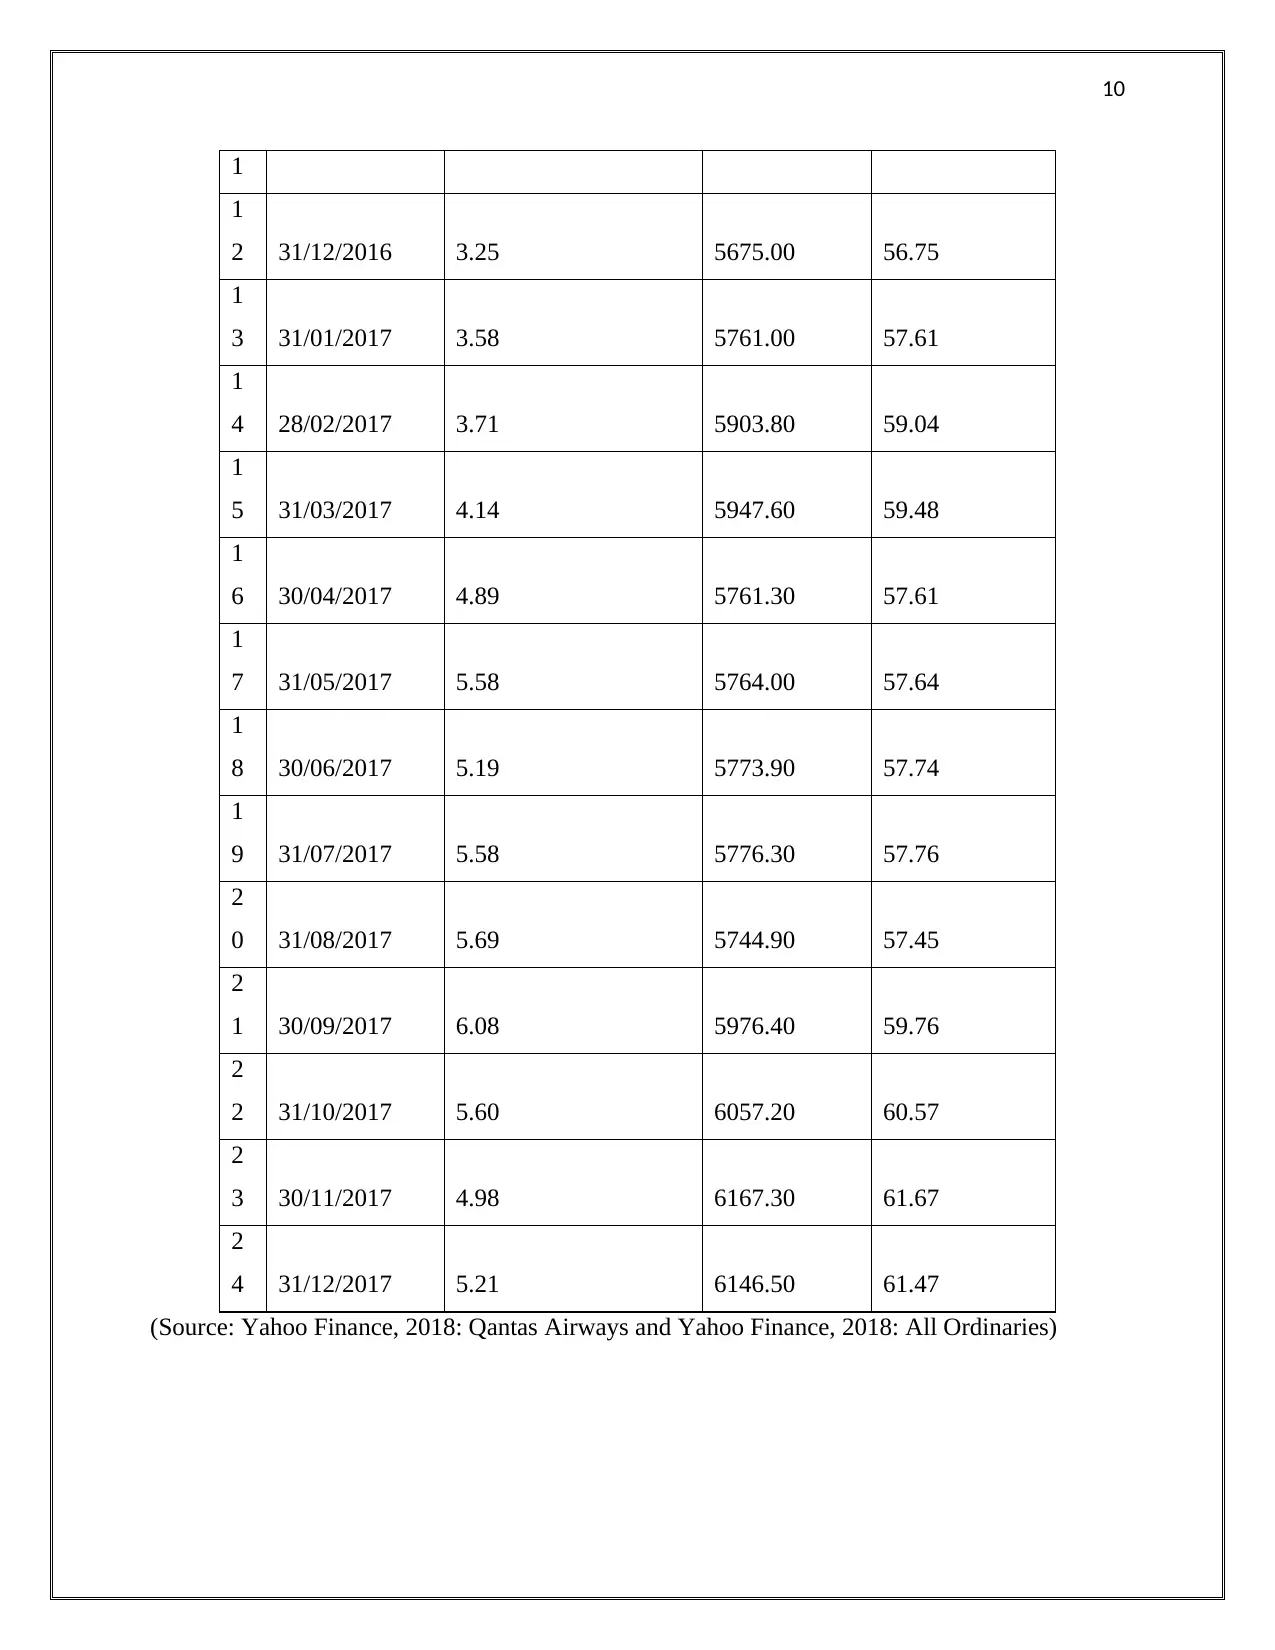
1
1
2 31/12/2016 3.25 5675.00 56.75
1
3 31/01/2017 3.58 5761.00 57.61
1
4 28/02/2017 3.71 5903.80 59.04
1
5 31/03/2017 4.14 5947.60 59.48
1
6 30/04/2017 4.89 5761.30 57.61
1
7 31/05/2017 5.58 5764.00 57.64
1
8 30/06/2017 5.19 5773.90 57.74
1
9 31/07/2017 5.58 5776.30 57.76
2
0 31/08/2017 5.69 5744.90 57.45
2
1 30/09/2017 6.08 5976.40 59.76
2
2 31/10/2017 5.60 6057.20 60.57
2
3 30/11/2017 4.98 6167.30 61.67
2
4 31/12/2017 5.21 6146.50 61.47
(Source: Yahoo Finance, 2018: Qantas Airways and Yahoo Finance, 2018: All Ordinaries)
1
1
2 31/12/2016 3.25 5675.00 56.75
1
3 31/01/2017 3.58 5761.00 57.61
1
4 28/02/2017 3.71 5903.80 59.04
1
5 31/03/2017 4.14 5947.60 59.48
1
6 30/04/2017 4.89 5761.30 57.61
1
7 31/05/2017 5.58 5764.00 57.64
1
8 30/06/2017 5.19 5773.90 57.74
1
9 31/07/2017 5.58 5776.30 57.76
2
0 31/08/2017 5.69 5744.90 57.45
2
1 30/09/2017 6.08 5976.40 59.76
2
2 31/10/2017 5.60 6057.20 60.57
2
3 30/11/2017 4.98 6167.30 61.67
2
4 31/12/2017 5.21 6146.50 61.47
(Source: Yahoo Finance, 2018: Qantas Airways and Yahoo Finance, 2018: All Ordinaries)
Paraphrase This Document
Need a fresh take? Get an instant paraphrase of this document with our AI Paraphraser
11
01/01/2016
01/02/2016
01/03/2016
01/04/2016
01/05/2016
01/06/2016
01/07/2016
01/08/2016
01/09/2016
01/10/2016
01/11/2016
01/12/2016
01/01/2017
01/02/2017
01/03/2017
01/04/2017
01/05/2017
01/06/2017
01/07/2017
01/08/2017
01/09/2017
01/10/2017
01/11/2017
01/12/2017
0.00
5.00
10.00
15.00
20.00
25.00
30.00
35.00
40.00
45.00
50.00
55.00
60.00
65.00
Price Movement of Quantas Airways and All
Ordinaries
All Ordinaries
Quantas Airways
Date (Monthly)
Share Price
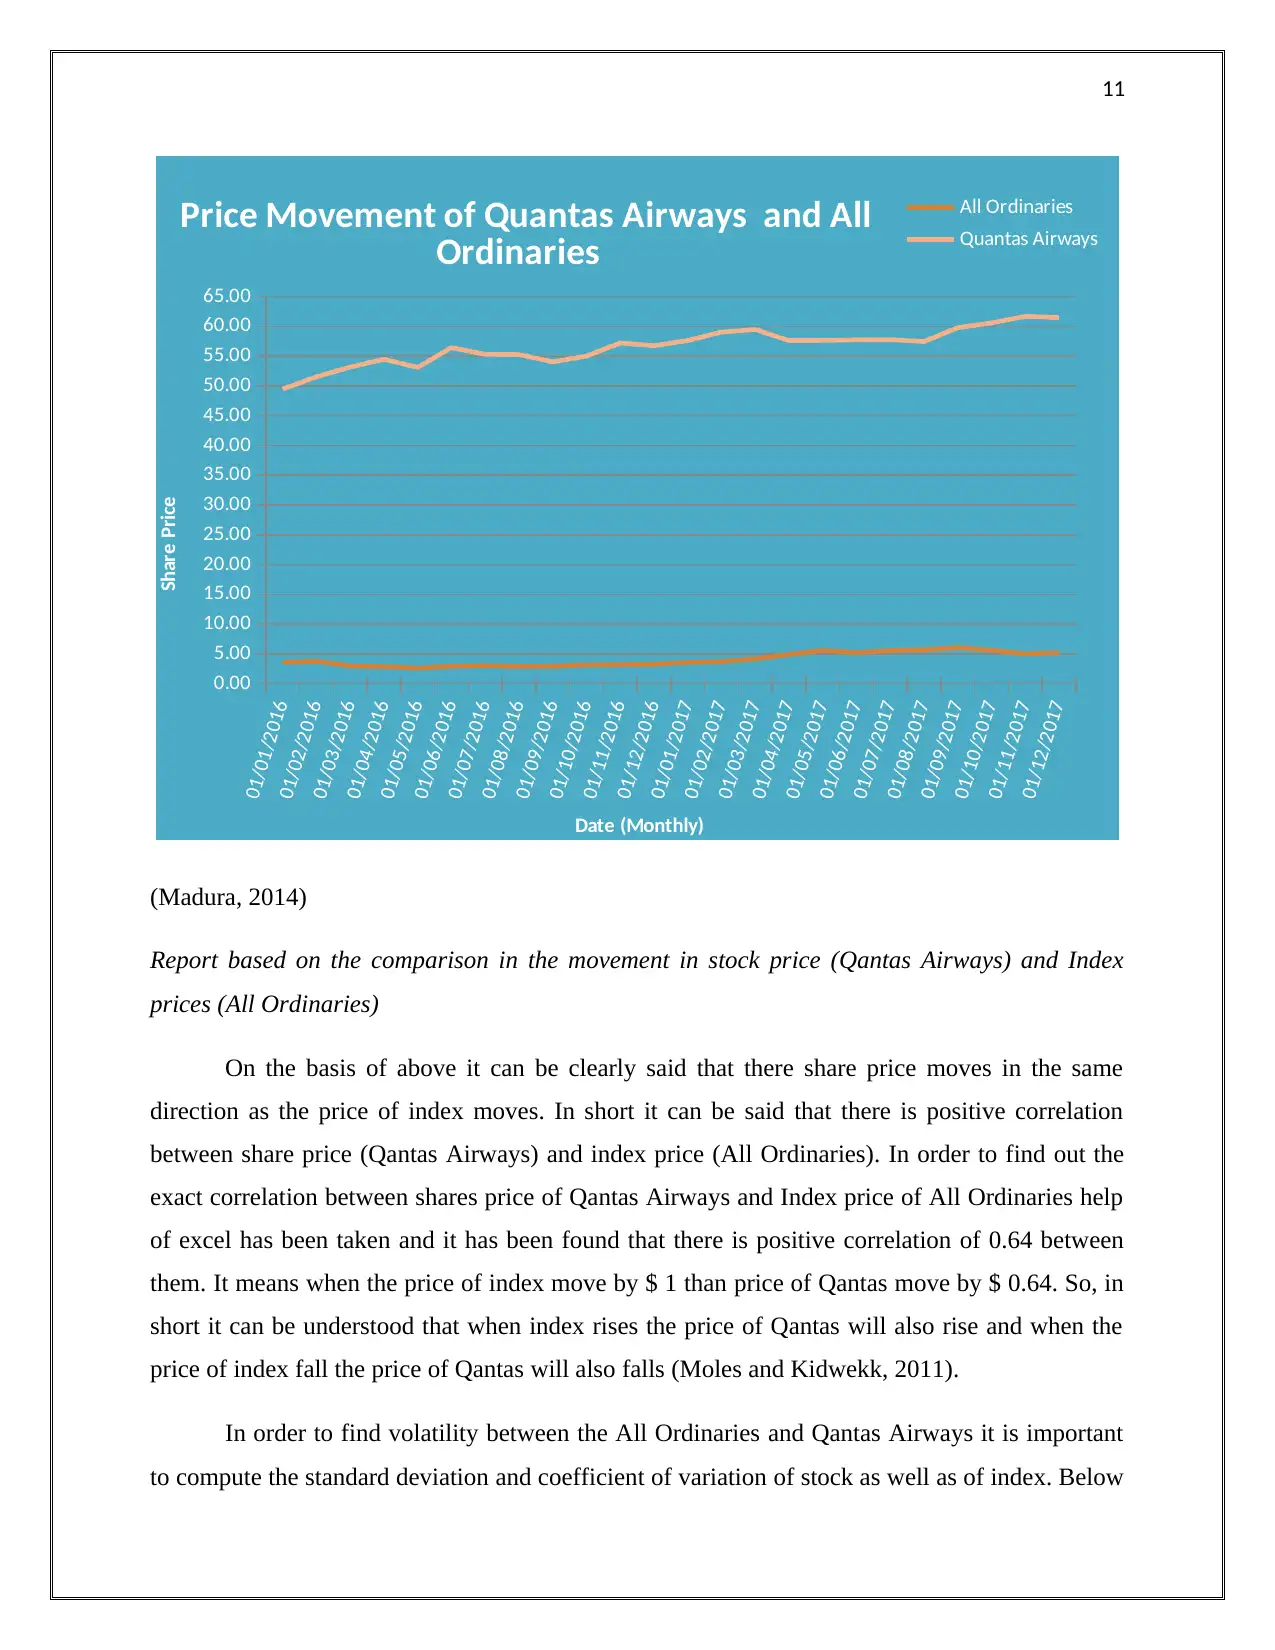
(Madura, 2014)
Report based on the comparison in the movement in stock price (Qantas Airways) and Index
prices (All Ordinaries)
On the basis of above it can be clearly said that there share price moves in the same
direction as the price of index moves. In short it can be said that there is positive correlation
between share price (Qantas Airways) and index price (All Ordinaries). In order to find out the
exact correlation between shares price of Qantas Airways and Index price of All Ordinaries help
of excel has been taken and it has been found that there is positive correlation of 0.64 between
them. It means when the price of index move by $ 1 than price of Qantas move by $ 0.64. So, in
short it can be understood that when index rises the price of Qantas will also rise and when the
price of index fall the price of Qantas will also falls (Moles and Kidwekk, 2011).
In order to find volatility between the All Ordinaries and Qantas Airways it is important
to compute the standard deviation and coefficient of variation of stock as well as of index. Below
01/01/2016
01/02/2016
01/03/2016
01/04/2016
01/05/2016
01/06/2016
01/07/2016
01/08/2016
01/09/2016
01/10/2016
01/11/2016
01/12/2016
01/01/2017
01/02/2017
01/03/2017
01/04/2017
01/05/2017
01/06/2017
01/07/2017
01/08/2017
01/09/2017
01/10/2017
01/11/2017
01/12/2017
0.00
5.00
10.00
15.00
20.00
25.00
30.00
35.00
40.00
45.00
50.00
55.00
60.00
65.00
Price Movement of Quantas Airways and All
Ordinaries
All Ordinaries
Quantas Airways
Date (Monthly)
Share Price
(Madura, 2014)
Report based on the comparison in the movement in stock price (Qantas Airways) and Index
prices (All Ordinaries)
On the basis of above it can be clearly said that there share price moves in the same
direction as the price of index moves. In short it can be said that there is positive correlation
between share price (Qantas Airways) and index price (All Ordinaries). In order to find out the
exact correlation between shares price of Qantas Airways and Index price of All Ordinaries help
of excel has been taken and it has been found that there is positive correlation of 0.64 between
them. It means when the price of index move by $ 1 than price of Qantas move by $ 0.64. So, in
short it can be understood that when index rises the price of Qantas will also rise and when the
price of index fall the price of Qantas will also falls (Moles and Kidwekk, 2011).
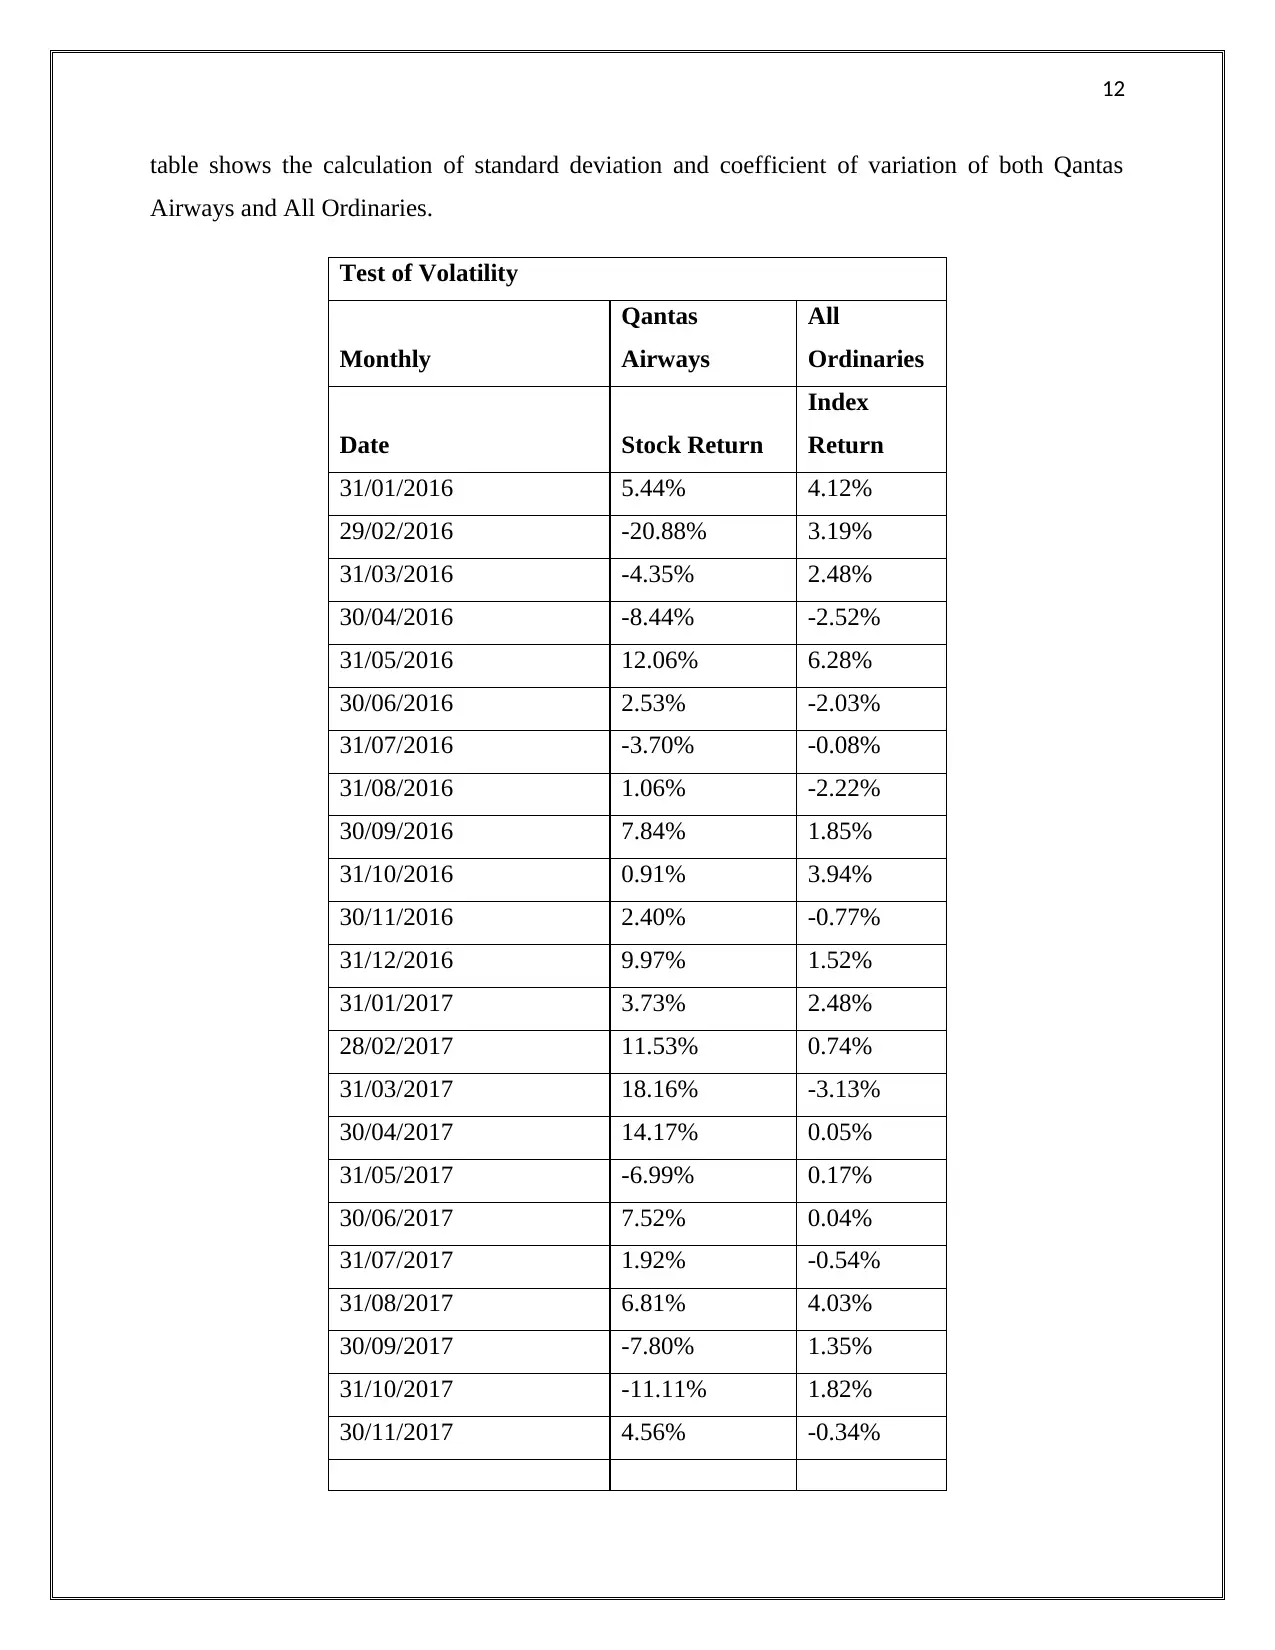
In order to find volatility between the All Ordinaries and Qantas Airways it is important
to compute the standard deviation and coefficient of variation of stock as well as of index. Below
12
table shows the calculation of standard deviation and coefficient of variation of both Qantas
Airways and All Ordinaries.
Test of Volatility
Monthly
Qantas
Airways
All
Ordinaries
Date Stock Return
Index
Return
31/01/2016 5.44% 4.12%
29/02/2016 -20.88% 3.19%
31/03/2016 -4.35% 2.48%
30/04/2016 -8.44% -2.52%
31/05/2016 12.06% 6.28%
30/06/2016 2.53% -2.03%
31/07/2016 -3.70% -0.08%
31/08/2016 1.06% -2.22%
30/09/2016 7.84% 1.85%
31/10/2016 0.91% 3.94%
30/11/2016 2.40% -0.77%
31/12/2016 9.97% 1.52%
31/01/2017 3.73% 2.48%
28/02/2017 11.53% 0.74%
31/03/2017 18.16% -3.13%
30/04/2017 14.17% 0.05%
31/05/2017 -6.99% 0.17%
30/06/2017 7.52% 0.04%
31/07/2017 1.92% -0.54%
31/08/2017 6.81% 4.03%
30/09/2017 -7.80% 1.35%
31/10/2017 -11.11% 1.82%
30/11/2017 4.56% -0.34%
⊘ This is a preview!⊘
Do you want full access?
Subscribe today to unlock all pages.
Trusted by 1+ million students worldwide
1 out of 20
Related Documents


Your All-in-One AI-Powered Toolkit for Academic Success.
+13062052269
info@desklib.com
Available 24*7 on WhatsApp / Email
![[object Object]](/_next/static/media/star-bottom.7253800d.svg)
Unlock your academic potential
Copyright © 2020–2026 A2Z Services. All Rights Reserved. Developed and managed by ZUCOL.