HI5002 Finance for Business: Evaluating Financial Performance
VerifiedAdded on 2024/06/03
|19
|3158
|143
Report
AI Summary
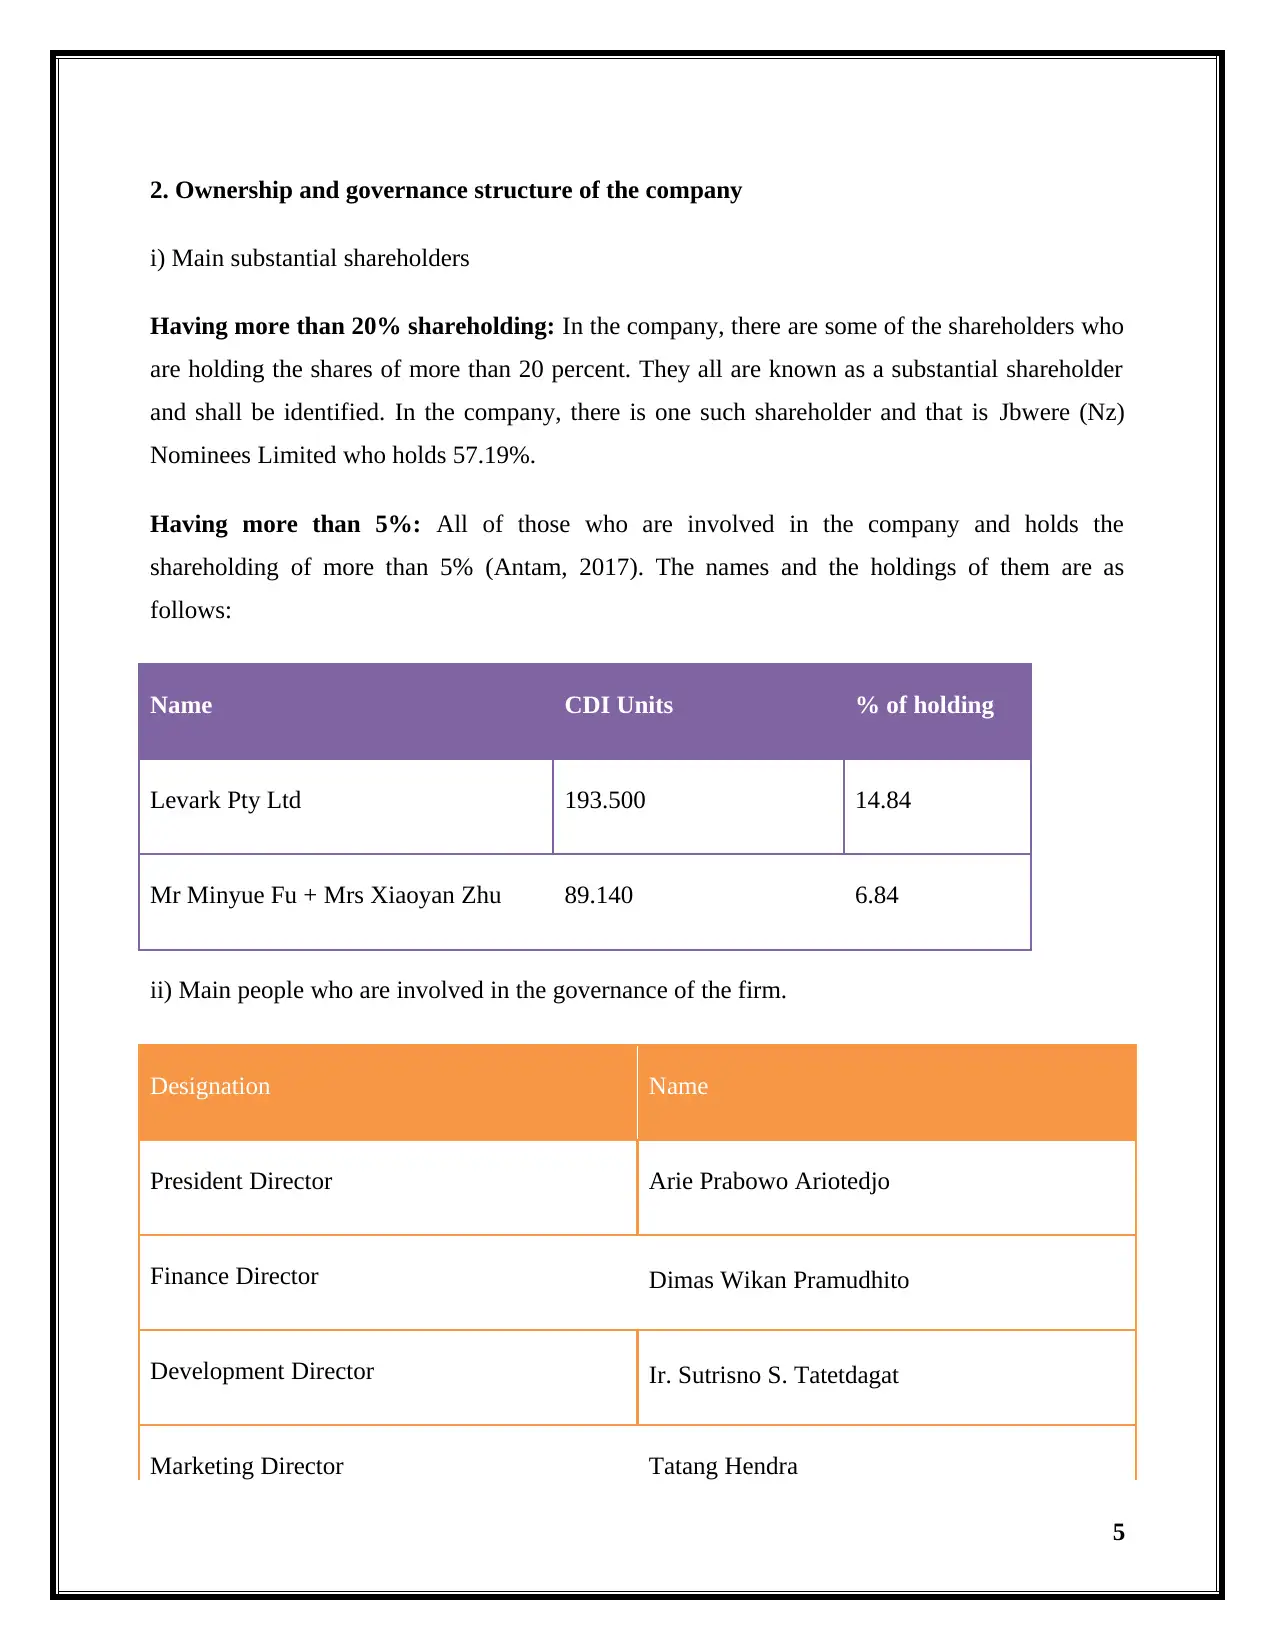
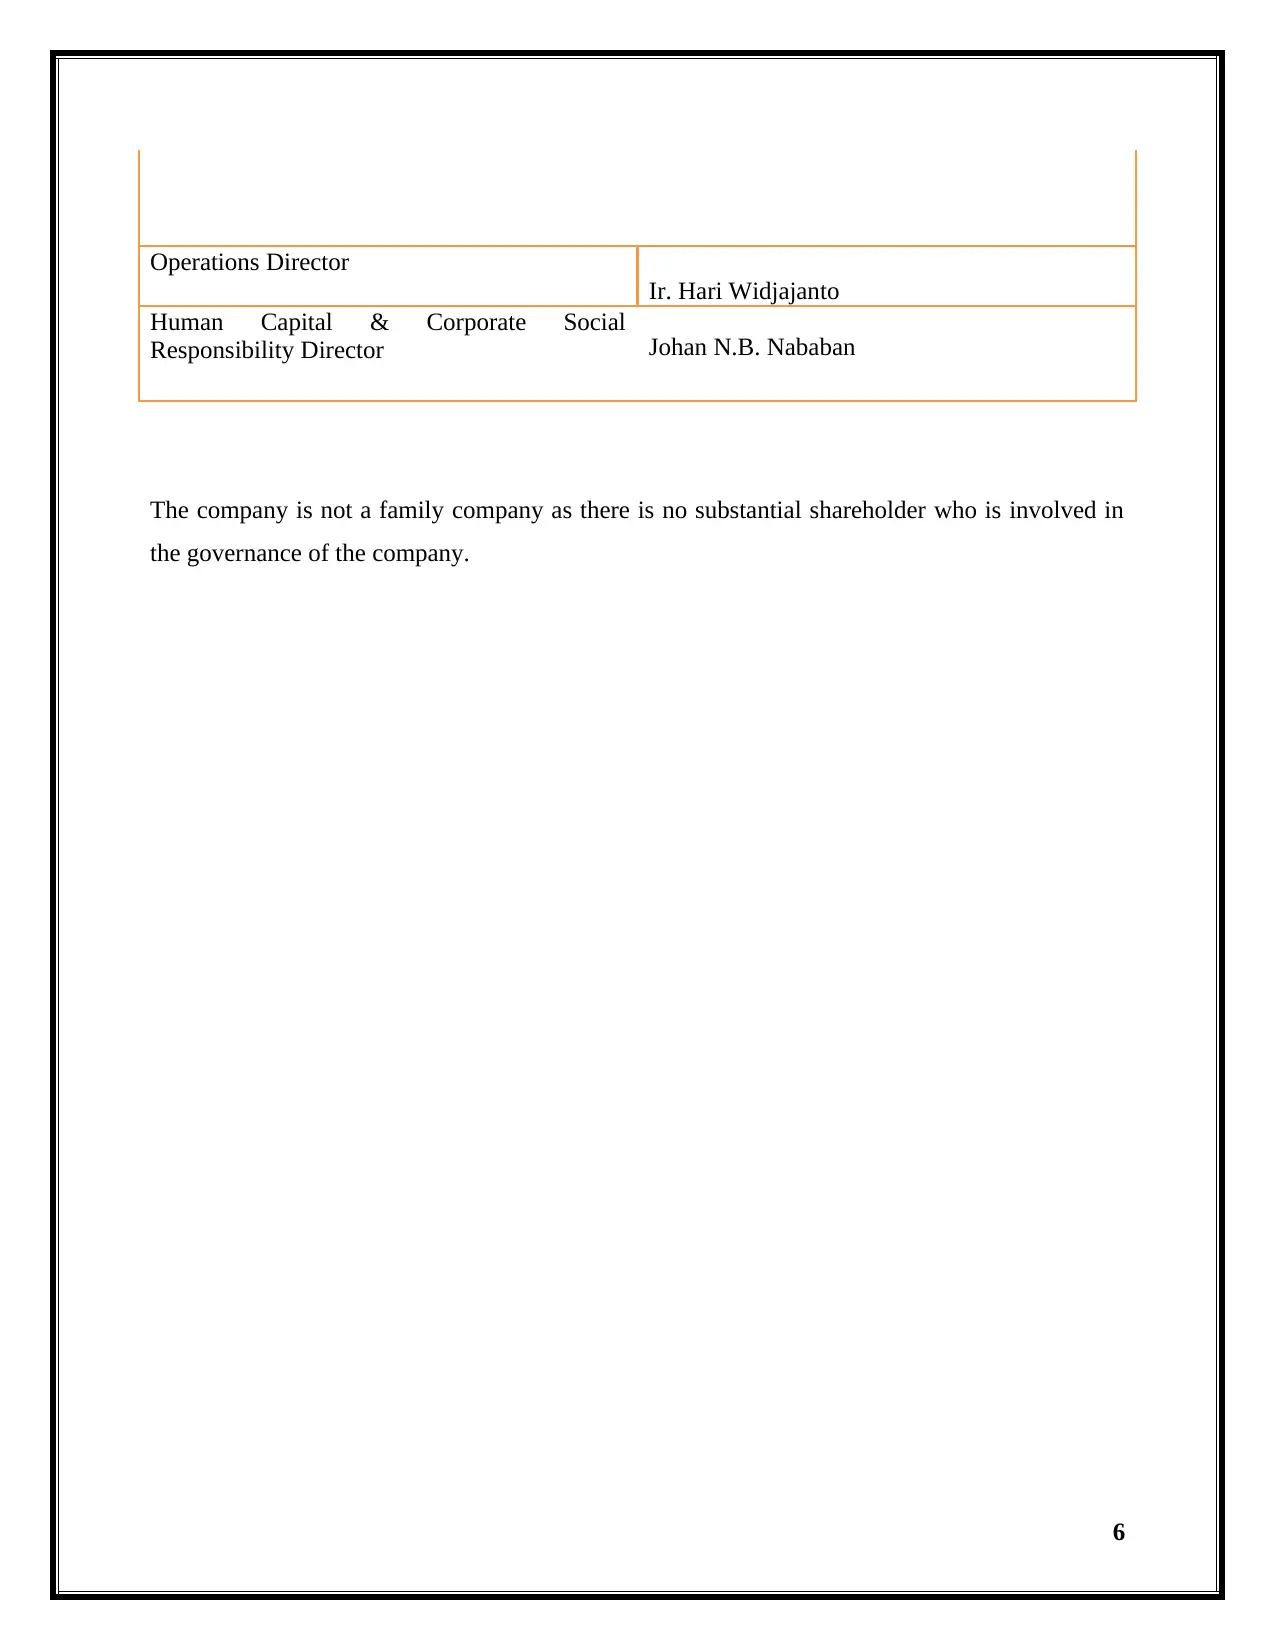
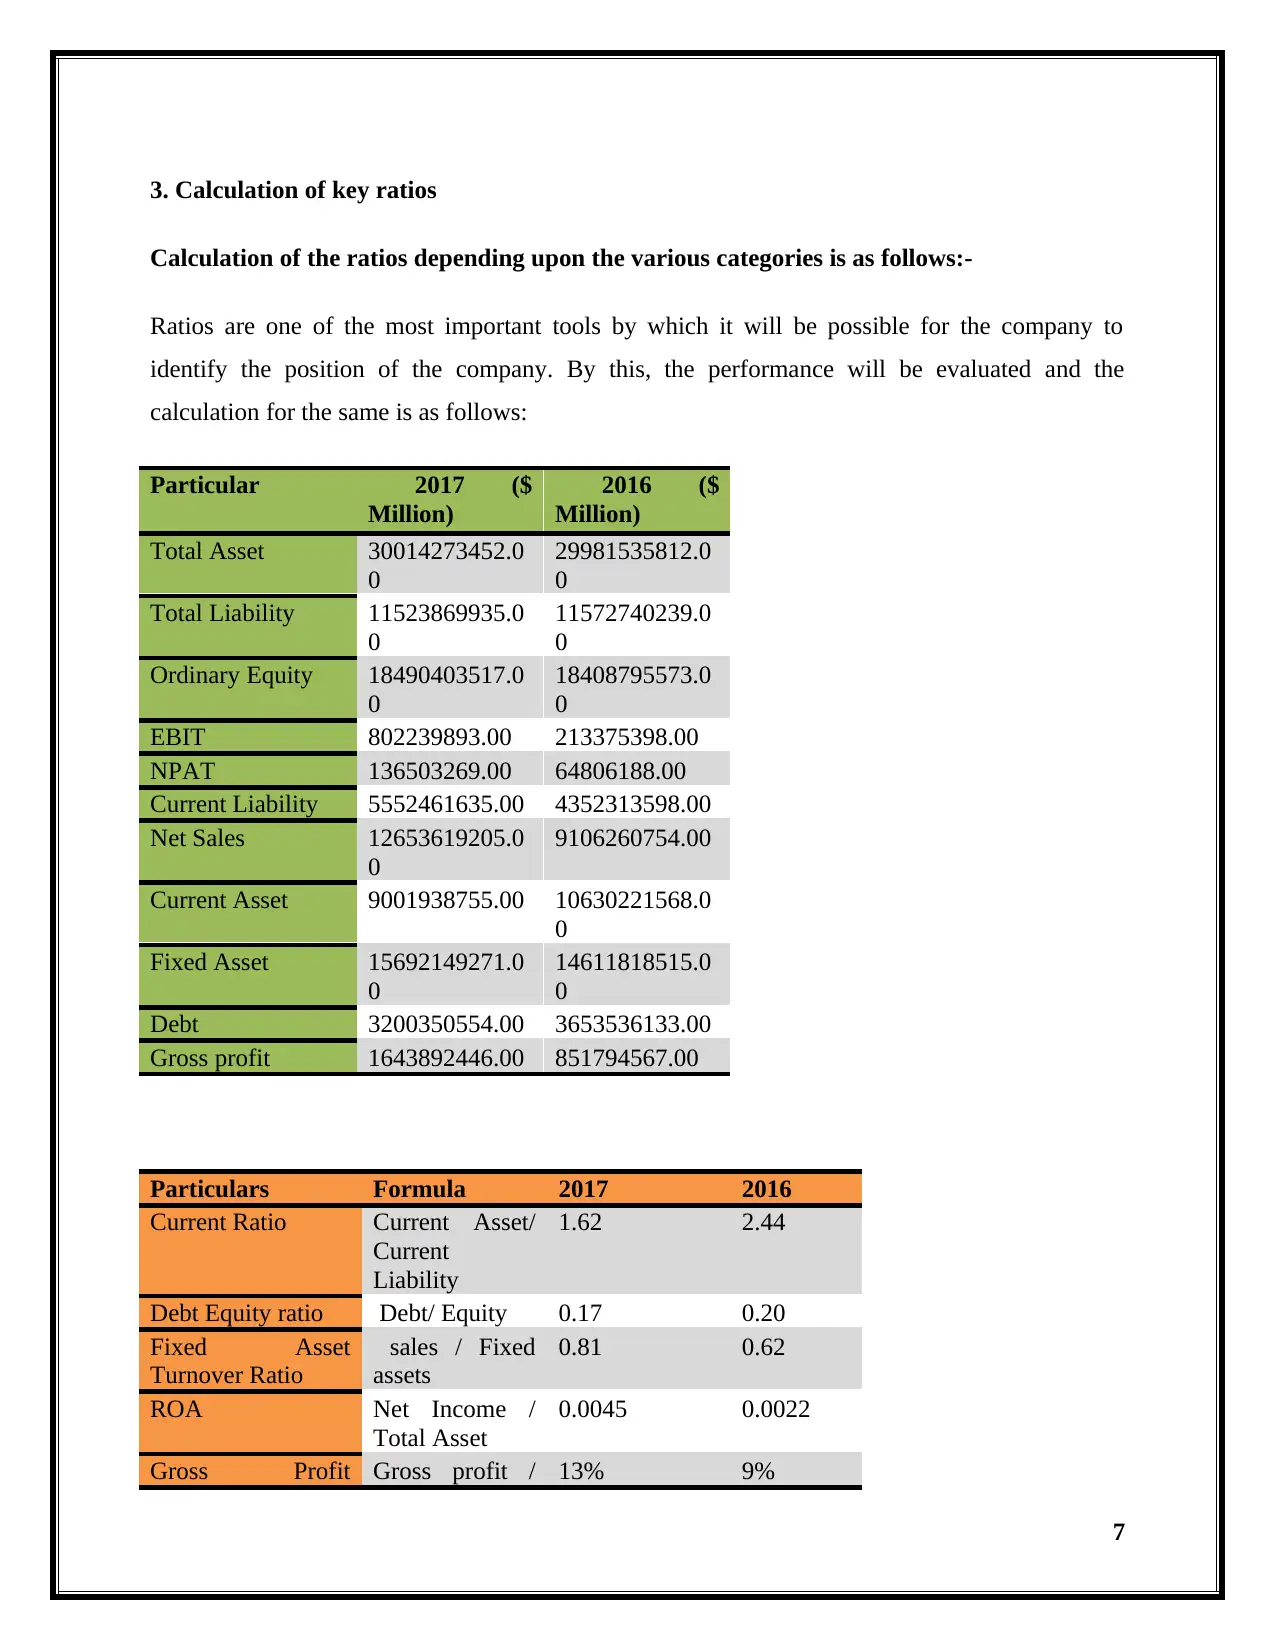
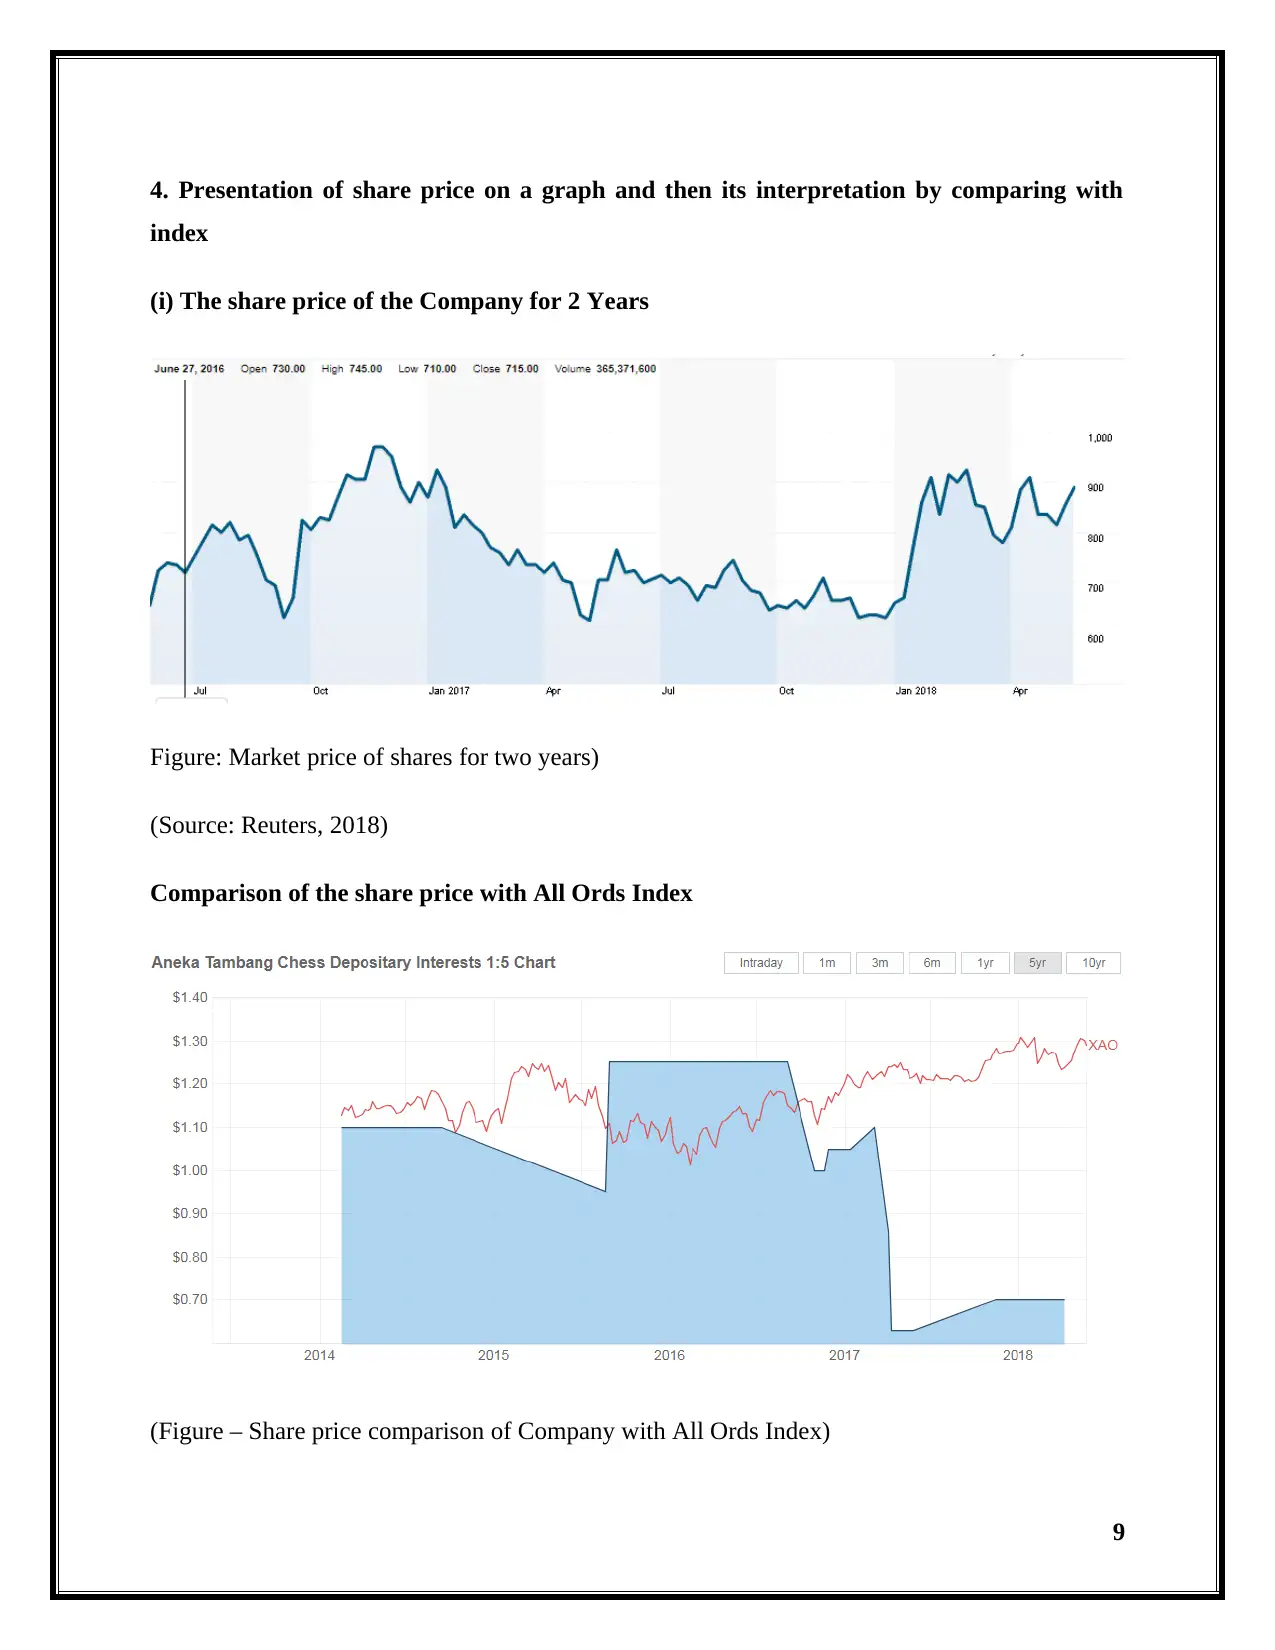
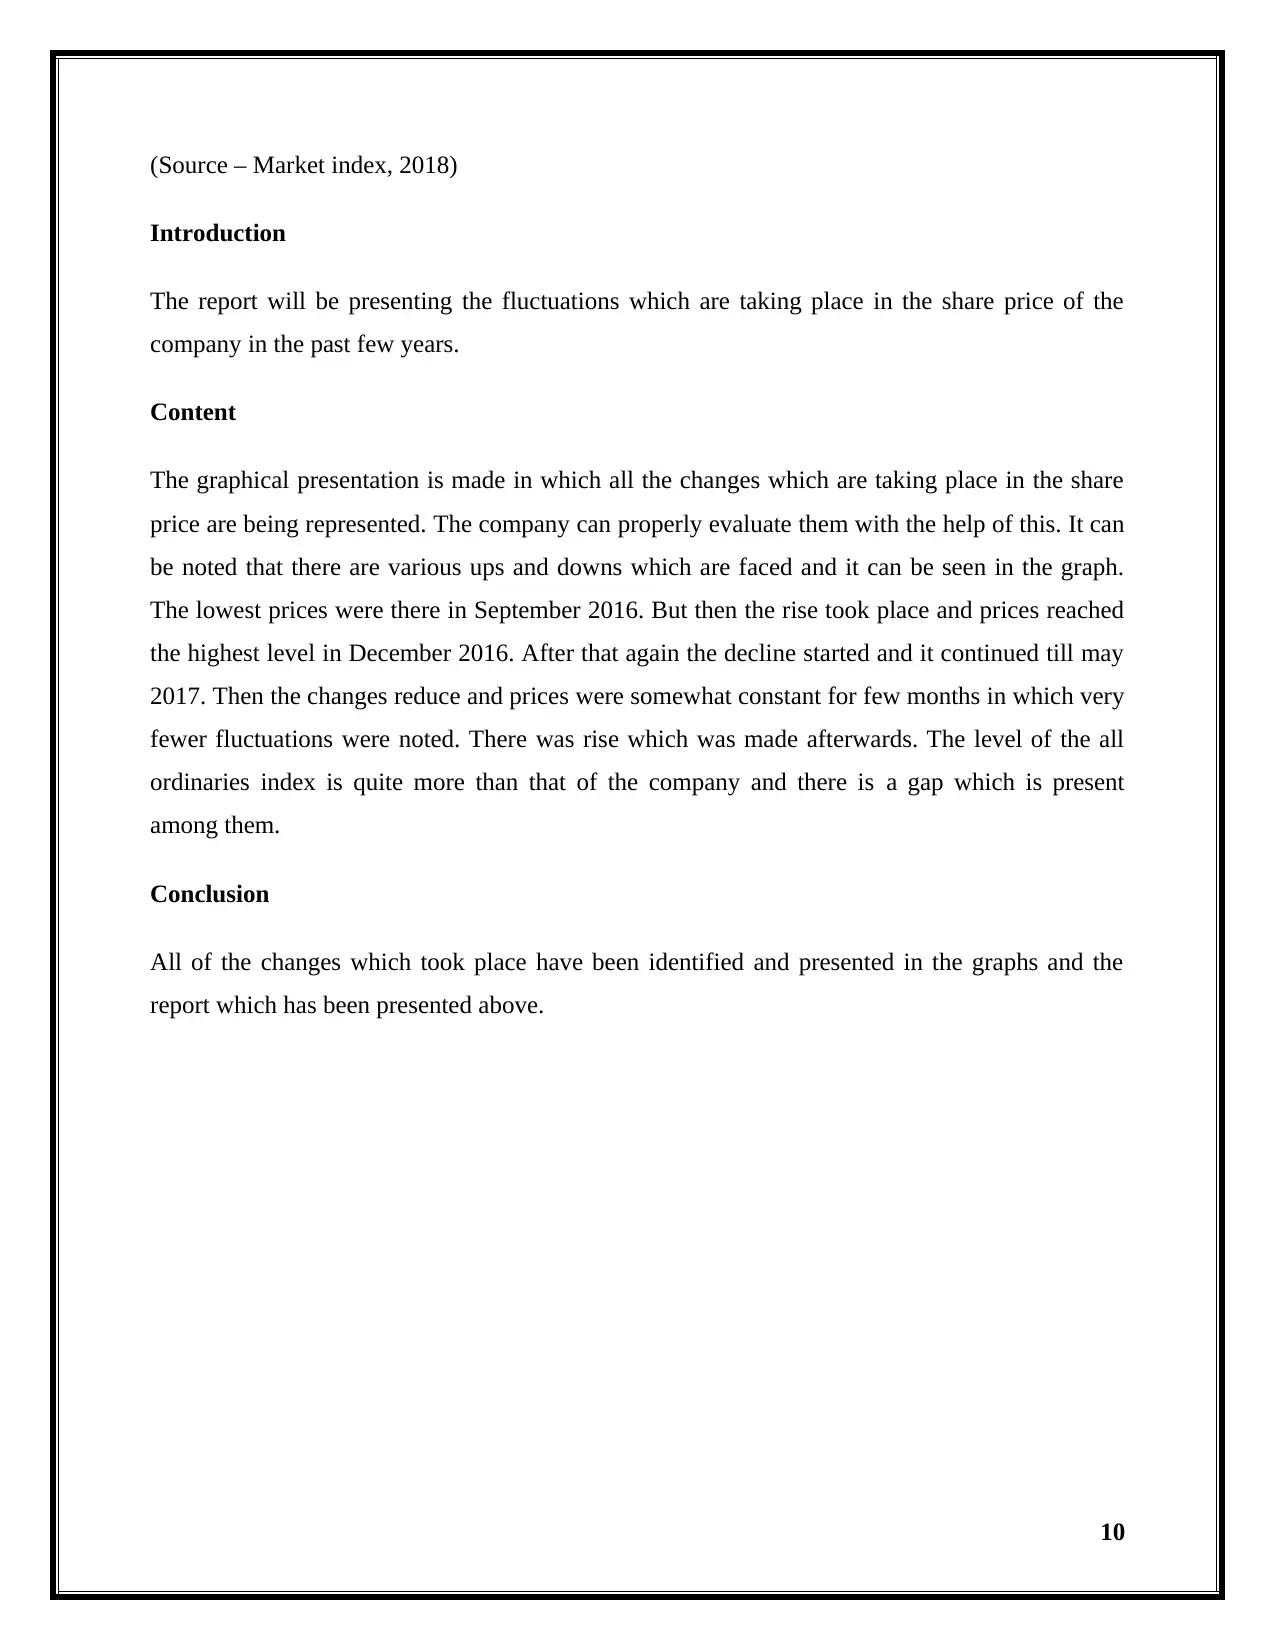
This report provides a comprehensive financial analysis of Aneka Tambang (Antam), an Indonesian mining company. It covers various aspects, including an overview of the company's operations, ownership and governance structure, and a detailed calculation of key financial ratios such as current ratio, debt-equity ratio, fixed asset turnover ratio, gross profit margin ratio, and return on assets (ROA). The report also presents a share price analysis with graphical representation and comparison to the All Ords Index. Furthermore, it includes research on company announcements, calculation of the required rate of return using the Capital Asset Pricing Model (CAPM), determination of the weighted average cost of capital (WACC), evaluation based on debt ratio, and a discussion of the dividend policy. The report concludes with a letter of recommendation based on the financial analysis.
Contribute Materials
Your contribution can guide someone’s learning journey. Share your
documents today.

HI5002: Finance for business
1
1
Secure Best Marks with AI Grader
Need help grading? Try our AI Grader for instant feedback on your assignments.

Table of Contents
Introduction......................................................................................................................................3
1. Overview of company..............................................................................................................4
2. Ownership and governance structure of company...................................................................5
5. Research with the help of business publication and internet.................................................11
6. Calculation of required rate of return....................................................................................12
7. Calculation of weighted cost of capital.................................................................................13
8.. Evaluation on basis of debt ratio..........................................................................................15
9. Dividend policy.....................................................................................................................16
10. Letter of Recommendation..................................................................................................17
Conclusion.....................................................................................................................................18
References......................................................................................................................................19
2

Introduction
The business will be able to attain the required goals and objectives when the company will be
able to manage all the finance of the entity in an appropriate manner. For that, it will be needed
that all of the factors which are related to it shall be taken into account. For that, the structure of
the company shall be identified and the proper analyzation shall be made by the use of various
tools. In this report, the same will be made and for this, there will be a calculation which will be
made such as the cost of capital, ratios and rate of return. Then the announcements will be
determined which have been made. The dividend policy of the company will also be taken into
consideration and will be identified.
3

1. Overview of company
The Aneka Tambang is the company which was established in 1968 and was built by merging
various mining companies and projects. The incorporation of the company is made with this
name but afterwards, it was converted in the listed company. There are various activities which
are performed by the company such as excavation, exploration and processing by which various
elements such as silver, nickel ore, coal and various others (Antam, 2017). The company is
operating in the various area and was listed on the ASX in after period and there are operations
which are carried in Indonesia also. The company believe in the development of the community
and also on the environment as the activities which are performed in the business affects the
environment.
4
Secure Best Marks with AI Grader
Need help grading? Try our AI Grader for instant feedback on your assignments.

2. Ownership and governance structure of the company
i) Main substantial shareholders
Having more than 20% shareholding: In the company, there are some of the shareholders who
are holding the shares of more than 20 percent. They all are known as a substantial shareholder
and shall be identified. In the company, there is one such shareholder and that is Jbwere (Nz)
Nominees Limited who holds 57.19%.
Having more than 5%: All of those who are involved in the company and holds the
shareholding of more than 5% (Antam, 2017). The names and the holdings of them are as
follows:
Name CDI Units % of holding
Levark Pty Ltd 193.500 14.84
Mr Minyue Fu + Mrs Xiaoyan Zhu 89.140 6.84
ii) Main people who are involved in the governance of the firm.
Designation Name
President Director Arie Prabowo Ariotedjo
Finance Director Dimas Wikan Pramudhito
Development Director Ir. Sutrisno S. Tatetdagat
Marketing Director Tatang Hendra
5

Operations Director
Ir. Hari Widjajanto
Human Capital & Corporate Social
Responsibility Director Johan N.B. Nababan
The company is not a family company as there is no substantial shareholder who is involved in
the governance of the company.
6
Ir. Hari Widjajanto
Human Capital & Corporate Social
Responsibility Director Johan N.B. Nababan
The company is not a family company as there is no substantial shareholder who is involved in
the governance of the company.
6

3. Calculation of key ratios
Calculation of the ratios depending upon the various categories is as follows:-
Ratios are one of the most important tools by which it will be possible for the company to
identify the position of the company. By this, the performance will be evaluated and the
calculation for the same is as follows:
Particular 2017 ($
Million)
2016 ($
Million)
Total Asset 30014273452.0
0
29981535812.0
0
Total Liability 11523869935.0
0
11572740239.0
0
Ordinary Equity 18490403517.0
0
18408795573.0
0
EBIT 802239893.00 213375398.00
NPAT 136503269.00 64806188.00
Current Liability 5552461635.00 4352313598.00
Net Sales 12653619205.0
0
9106260754.00
Current Asset 9001938755.00 10630221568.0
0
Fixed Asset 15692149271.0
0
14611818515.0
0
Debt 3200350554.00 3653536133.00
Gross profit 1643892446.00 851794567.00
Particulars Formula 2017 2016
Current Ratio Current Asset/
Current
Liability
1.62 2.44
Debt Equity ratio Debt/ Equity 0.17 0.20
Fixed Asset
Turnover Ratio
sales / Fixed
assets
0.81 0.62
ROA Net Income /
Total Asset
0.0045 0.0022
Gross Profit Gross profit / 13% 9%
7
Paraphrase This Document
Need a fresh take? Get an instant paraphrase of this document with our AI Paraphraser

Margin Ratio Sales
Current Ratio – The liquidity of the company will be ascertained with the help of this and for
that, all the current assets and current liabilities are compared with one another. There is the need
to calculate this and in the given case there is a decline in this which shows that the company
will be required to increase the investment in the assets.
Debt Equity Ratio – The position of the debt in the company will be ascertained and evaluated.
It will be identified that whether the proper balance among them is maintained or not. The ratio
is declining from 0.2 to 0.17 and this is a positive aspect of the company will have to meet the
less amount of interest cost.
Fixed Asset Turnover ratio – the company is required to identify that whether the appropriate
earnings are made by the fixed assets. For that, this ratio is considered. In the present year, there
is an increase in this which is from 0.62 to 0.81.
Gross profit margin ratio – the gross profit which is made by the company will be evaluated
with the help of this. The ratio is calculated by considering the comparison with the sales. There
is a rise in this also from 9% in 2016 to 13% in 2017 (Antam, 2017).
ROA – The return which is made in the company on the total asset is taken into account under
this (Basu, 2018). This is also rising in the company and which shows that the earnings are made
inappropriate manner.
8

4. Presentation of share price on a graph and then its interpretation by comparing with
index
(i) The share price of the Company for 2 Years
Figure: Market price of shares for two years)
(Source: Reuters, 2018)
Comparison of the share price with All Ords Index
(Figure – Share price comparison of Company with All Ords Index)
9
index
(i) The share price of the Company for 2 Years
Figure: Market price of shares for two years)
(Source: Reuters, 2018)
Comparison of the share price with All Ords Index
(Figure – Share price comparison of Company with All Ords Index)
9

(Source – Market index, 2018)
Introduction
The report will be presenting the fluctuations which are taking place in the share price of the
company in the past few years.
Content
The graphical presentation is made in which all the changes which are taking place in the share
price are being represented. The company can properly evaluate them with the help of this. It can
be noted that there are various ups and downs which are faced and it can be seen in the graph.
The lowest prices were there in September 2016. But then the rise took place and prices reached
the highest level in December 2016. After that again the decline started and it continued till may
2017. Then the changes reduce and prices were somewhat constant for few months in which very
fewer fluctuations were noted. There was rise which was made afterwards. The level of the all
ordinaries index is quite more than that of the company and there is a gap which is present
among them.
Conclusion
All of the changes which took place have been identified and presented in the graphs and the
report which has been presented above.
10
Secure Best Marks with AI Grader
Need help grading? Try our AI Grader for instant feedback on your assignments.

5. Research with the help of business publication and internet.
The company operates in accordance with the laws and as there are various announcements
which are made so it is required that they are provided and so the same is done below.
The gold series was launched by the company and announcement for the same is made on
19th April 2018. This was the second development in this as there was already a series
which are launched earlier in this same respect. By the value of the gold bar, products
will be achieving the growth (Antam, 2017). It has been provided in this that there are
four Indonesian batik motifs where the products will be available.
The financial structure of the company has been strengthened and for that, a commitment
has been announced by which the value of shareholders will be increasing. For this, the
development of the core business will be made and for this, the maximum production will
be made so that increase in the revenue is attained.
11

6. Calculation of required rate of return
i) In the process of calculation of the rate of return, there will be a requirement of the beta. This
is because of the fact that risk will be taken into consideration by including it in the process. 0.77
has been identified as the beta of the given company.
ii) The calculation of the rate of return can be made by the help of various methods which are
available and for the current case capital asset pricing method is taken into consideration (Fama,
& French, 2014). Under this, all the rates which are involved are considered such as risk-free rate
and the rate of market return. The formula has been specified which can be used for this and that
is as follows:
Rate of return = Rf + (β) (Rm-Rf)
Rate of return = 4% + 0.77 *6%
=8.62%
iii) The investment which is made in the company is conservative in nature and this can be said
as the rate of the return is quite low. Due to this, the company will not be bearing much of the
risk which makes it secured. The investors will be willing to make the investment as the
company is not including much of the chances that risk of the loss will have to be faced. In this,
all of the factors have been considered and then the decision has been made which makes clear
all the aspects in relation to this.
12

7. Calculation of weighted cost of capital
WACC is calculated so that the company can identify the cost which will have to be paid by the
company. In this, both the equity and debt will be taken into consideration as they are the sources
from which funds are obtained in the company (Krüger, et. al., 2015). The tax rate will also be
used so that the effect of it can also be considered in the calculation process.
WACC = E x Re + D x Rd (1 – T)
V V
Where,
Re = Rate on equity
Rd = Cost of Debt
V = Equity + Debt
D = Debt
E = Equity
T = Tax Rate
WACC = 18490403517 x 0.0862 + 3200350554 x 0.0997 (1 – 0.30)
21690754071 21690754071
WACC = 0.0735 + 0.0103
WACC = 0.0838
WACC = 8.38%
13
Paraphrase This Document
Need a fresh take? Get an instant paraphrase of this document with our AI Paraphraser

ii) If the company is having the high WACC then it will be bad for the company as they will
have to pay the more amount of the interest and by that, the company’s cost will be increasing.
This will be adverse for the company as the profit of the company will be reducing. This will
have the adverse impact on the company and so it will be required that the company shall
maintain the cost of capital at a lower level.
14

8.. Evaluation on basis of debt ratio
i)
The company will be required to calculate the gearing ratio as there will need to evaluate the
capital structure of the company. By that, the ratio in which the company maintains all the equity
and the borrowings is identified and this will be in the interest of the company (Dalal, 2013).
This is because they will be able to decide the level at which least cost will be made and the level
of the profits can be increased due to it. :
The Gearing ratio of the company is below:-
Calculation of Gearing Ratios
Particular 2017 2016
Total Shareholder's Equity 18490403517.0
0 18408795573.00
Total Debt
3200350554.00 3653536133.00
Gearing Ratio 0.17 0.20
The company is noticing the decline in the debt-equity ratio and this is because the company has
reduced the amount of the borrowings and this lead to the results which are attained. It provides
the company with the opportunity to expand as they can raise the funds by this source.
ii)
The company will be required to make the changes in the gearing ratio as per their requirement.
They will be identifying the needs of the business and with that, the market condition will also be
evaluated which will be used for the making of the decisions. They will be making the increase
15

in the debt if the funds will be required but that will be made by considering the cost which will
be made on that. They will have to decide such amount at which they can make the required
amount of the profits.
9. Dividend policy
The company pays the dividend from the amount which is earned and that is decided by the
company that how much shall be paid. For that, the policy will be formulated so that they can be
used in the company. There are various methods by which it can be made possible and in that
one is to decide the amount which will be paid and that will remain constant irrespective of the
fact that how much of the earning is made by the company (Panigrahi & Zainuddin, 2015).
Another is the method by which the company will be required to pay the dividend on the basis of
the earnings which are made. The company can make the payments on a periodical basis or there
is also the irregular payment which is made by the company. So, all of them will be considered
by the company to make the final decision.
The company is also following one of the following policy and according to that it will be
making the payment of the cash dividend which will be 30% of the net profits that earned and
they will be paid by the company on the regular interval of time (Antam, 2017).
16
Secure Best Marks with AI Grader
Need help grading? Try our AI Grader for instant feedback on your assignments.

10. Letter of Recommendation
In the company all the aspects have been taken into consideration and on the basis of them it can
be said that company will be making the profits in the future period. By that, the investment in
the company is recommended. There are proper ratios and the cost of capital is also in the limit.
The company has the scope for the further growth. The investors will be benefited as they will be
receiving appropriate dividends due to the policy which is followed by the company in this
respect. The rate of return is also proper and there is not much of the risk which is involved in
that. The overall condition of the business is satisfactory and there is no such aspect on the basis
of which the company can be rejected.
17

Conclusion
From the report, it can be said that the proper maintenance of the funds shall be made and this
will be possible only by taking into consideration the aspects which are related to this factor. The
company in the present case is also working in an appropriate manner and the proper analysis has
been made in which graphs have also been taken into consideration. The capital structure of the
company is also evaluated and it is identified that debt amount is in limit and it is not in excess of
which the company will have to pay less amount of the interest. There is the governance
structure which is followed and the same is identified so that any loophole in that can be
considered and proper disclosure of the announcements is also made by the company which
makes it clear for the investors about all the events.
18

References
Antam. (2017). Annual Report 2017. Antam. [Online]. Available at:
http://www.antam.com/images/stories/joget/file/annual/2017/ANTAM_AR2017_HiRes_
200418.pdf [Accessed 24-05-2018]
Antam. (2017). ANTAM Described. Antam. [Online]. Available at:
http://www.antam.com/index.php?option=com_content&task=view&id=32&Itemid=38
[Accessed 24-05-2018]
Basu, C., (2018). Four Basic Types of Financial Ratios Used to Measure a Company's
Performance. Chron. [Online]. Also available at http://smallbusiness.chron.com/four-
basic-types-financial-ratios-used-measure-companys-performance-25299.html.
[Accessed on 24-05-2018]
Dalal, G. (2013). Optimal capital structure. International Journal of Education and
Management Studies, 3(1), 138.
Fama, E. F., & French, K. R. (2014). A Five-Factor Asset Pricing Model. Booth School of
Business, 2-53.
Krüger, P., Landier, A., & Thesmar, D. (2015). The WACC fallacy: The real effects of
using a unique discount rate. The Journal of Finance, 70(3), 1253-1285.
Market Index, (2018). Aneka Tambang Chart. Market Index. [Online]. Available at:
https://www.marketindex.com.au/asx/atm. [Accessed on 24-05-2018]
Panigrahi, S. K., & Zainuddin, Y. (2015). Dividend Policy Decisions: Theoretical Views
and Relevant Issues. Reports on Economics and Finance, Vol. 1, 2015, no. 1, 43 – 58
Reuters, (2018). Aneka Tambang Tbk PT (ANTM.JK). Reuters. [Online]. Available at:
https://www.reuters.com/finance/stocks/chart/ANTM.JK. [Accessed on 24-05-2018]
19
1 out of 19
Related Documents

Your All-in-One AI-Powered Toolkit for Academic Success.
+13062052269
info@desklib.com
Available 24*7 on WhatsApp / Email
Unlock your academic potential
© 2024 | Zucol Services PVT LTD | All rights reserved.