Investment Analysis: Caltex Australia & Washington H. Soul Pattinson
VerifiedAdded on 2023/06/07
|21
|5045
|288
Report
AI Summary
This report provides an investment recommendation to an overseas institutional investor, comparing Caltex Australia Limited and Washington H. Soul Pattinson and Company Limited. It analyzes their operations, comparative advantages, liquidity, profitability, and capital structure using ratio analysis. The report also examines historical share price movements against the All Ordinaries Index and identifies factors influencing share prices. Furthermore, it evaluates dividend policies and calculates beta values and expected rates of return using the CAPM. Based on this analysis, the report recommends investing in Washington H. Soul Pattinson due to its favorable liquidity, profitability, and solvency position, consistent dividend payments, and alignment with the All Ordinaries Index.
Running head: FINANCE FOR BUSINESS
Finance for Business
Name of the Student:
Name of the University:
Author’s Note:
Course ID:
Finance for Business
Name of the Student:
Name of the University:
Author’s Note:
Course ID:
Paraphrase This Document
Need a fresh take? Get an instant paraphrase of this document with our AI Paraphraser
1FINANCE FOR BUSINESS
Executive Summary:
The paper is prepared for providing investment-related recommendations to a big overseas
institutional investor from the perspective of a group of investment analysts involved in a big
investment Australian consulting firm. For meeting the purpose of this report, the two
organisations selected include Caltex Australia Limited and Washington H. Soul Pattinson
and Company Limited that have business operations in diversified areas. It could be found
that WHSP is placed in a favourable position in the Australian market in terms of liquidity,
profitability and solvency, which denotes that investing in this organisation would maximise
the return on investment. Moreover, the share price of WHSP even though has fluctuated
over the years, it has moved in tandem with the All Ordinaries Index. Finally, it has not failed
in making dividend payments to its shareholders since its inception. Therefore, it is
recommended to invest in this stock for obtaining better and favourable returns in future.
2FINANCE FOR BUSINESS
Table of Contents
Introduction:...............................................................................................................................3
1. Description of operation and comparative advantages of Caltex Australia and Washington
H. Soul Pattinson:.......................................................................................................................3
2. Calculation and comparison of performance ratios of the two organisations:.......................4
2.1 Liquidity ratios:................................................................................................................4
2.2 Profitability ratios:...........................................................................................................6
2.3 Capital structure (leverage ratios):...................................................................................8
3. Analysis of monthly share price movements of the two organisations:...............................10
3.1 Graphical representation for monthly share price movements over the last three years
against the movements in the All Ordinaries Index:............................................................10
3.2 Report on the share price movements:...........................................................................10
4. Significant factors having influence on the share price of the two organisations:...............11
5. Calculation of beta values and expected rates of return using the CAPM:..........................12
5.1 Calculated beta of Caltex Australia and Washington H. Soul Pattinson:......................12
5.2 Required rate of return for the shares of the two organisations:....................................13
6. Dividend policies adopted by Caltex Australia and Washington H. Soul Pattinson:..........13
7. Recommendation letter:.......................................................................................................13
Conclusion:..............................................................................................................................13
References:...............................................................................................................................15
Appendices:..............................................................................................................................17
⊘ This is a preview!⊘
Do you want full access?
Subscribe today to unlock all pages.
Trusted by 1+ million students worldwide
3FINANCE FOR BUSINESS
Introduction:
The current report is prepared with the intent to provide investment-related
recommendations to a big overseas institutional investor from the perspective of a group of
investment analysts involved in a big investment Australian consulting firm. For meeting the
purpose of this report, the two organisations selected include Caltex Australia Limited and
Washington H. Soul Pattinson and Company Limited that have business operations in
diversified areas and they are listed in ASX (Asx.com.au 2018). The financial conditions of
these organisations would be analysed based on their published annual reports by using the
technique of ratio analysis. Moreover, their historical share prices would be considered and
comparison would be made with All Ordinaries Index for the past three years. Besides, the
factors having impact on their share prices would be highlighted in this paper as well by
assessing the significant announcements associated with these two organisations.
Furthermore, the dividend policies of both the organisations would be considered. Based on
all these aspects, recommendation would be provided to the overseas investor regarding
investment in one particular stock.
1. Description of operation and comparative advantages of Caltex Australia and
Washington H. Soul Pattinson:
Caltex Australia Limited:
The organisation is involved in buying, distributing, refining and selling petroleum
products in Australia, Singapore and New Zealand. The operations of Caltex are carried out
through Lytton and Supply and Marketing segments. The Lytton segment is engaged in
refining crude oil into diesel, petrol, jet fuel, greases and speciality products like liquid
petroleum. It has been established in 1900 having its headquarters in Sydney, Australia with
an employee base of nearly 5,600 (Caltex 2018). The organisation owns approximately 35%
of the oil refining capacity of Australia.
The history of Caltex started years ago when Ampol, the Australian oil importer was
listed in ASX in 1940. Ampol and Caltex initiated their refineries in 1950 and 1960 and due
to this, intense competition was observed between them in the oil product marketing sector
and service station arena. However, with the passage of time, Caltex acquired Golden Fleece
and Ampol acquired Total. Moreover, in 1995, these two companies merged with each other
that have assisted Caltex in becoming the biggest Australian refiner-marketer. This factor
Paraphrase This Document
Need a fresh take? Get an instant paraphrase of this document with our AI Paraphraser
4FINANCE FOR BUSINESS
could be identified as the significant comparative advantage of the organisation in the
Australian market. Despite all such developments, both Ampol and Caltex have been
relatively small.
Washington H. Soul Pattinson and Company Limited (WHSP):
WHSP is an investment group having diversified asset portfolio within a range of
industries. It has been listed on ASX since 1903 and one of its primary contributions to the
shareholders is timely and regular payment of dividends. The origin of the organisation is
deemed to be observed in the Australian pharmacies. However, at present, it has diversified
beyond the pharmaceutical industry and the investment portfolio has widened due to
investments in building materials, natural resources, agriculture, telecommunications, retail,
investments, property equity and corporate advisory services (Whsp.com.au 2018). For
instance, it holds significant shareholdings of 25.3% in TPG Telecom, 50% in New Hope
Group, 43.9% in Brickworks Limited, 19.3% in Australian Pharmaceutical Industries, 8.6%
in BKI Investment Company Limited, 100% in Pitt Capital Partners and others. All these
factors have assisted WHSP in gaining comparative advantage in the Australian market.
2. Calculation and comparison of performance ratios of the two organisations:
In the words of Barth (2015), ratio analysis could be defined as the financial statement
evaluation, which is used for gaining a quick indication of the financial position of an
organisation in several key performance areas. The ratios could be categorised into debt
management, short-term solvency, profitability, liquidity, asset management, efficiency and
market value ratios. However, as the overseas client is interested particularly in liquidity
ratios, profitability ratios and capital structure or leverage ratios, these three types of ratios
would be evaluated in the context of Caltex Australia and WHSP.
2.1 Liquidity ratios:
For evaluating the liquidity position of Caltex Australia Limited and WHSP, the
liquidity ratios that are taken into consideration include current ratio and quick ratio. The
calculations and analyses of these ratios are represented as follows:
Particulars
Caltex Australia Limited WHSP
2015 2016 2017 2015 2016 2017
Current 1.6 1.4 1.1 8.9 2.2 3.2
5FINANCE FOR BUSINESS
ratio 5 3 6 6 5 8
Quick ratio
0.8
5
0.7
1
0.4
4
8.5
1
1.8
2
2.8
1
*(Refer to Appendix 1 for detailed calculations)
Table 1: Liquidity ratios of Caltex Australia and WHSP for the years 2015-2017
(Source: Caltex 2018: Whsp.com.au., 2018)
2015 2016 2017 2015 2016 2017
Caltex Australia Limited WHSP
-
1.00
2.00
3.00
4.00
5.00
6.00
7.00
8.00
9.00
10.00
Liquidity Ratios
Current ratio
Quick ratio
Companies
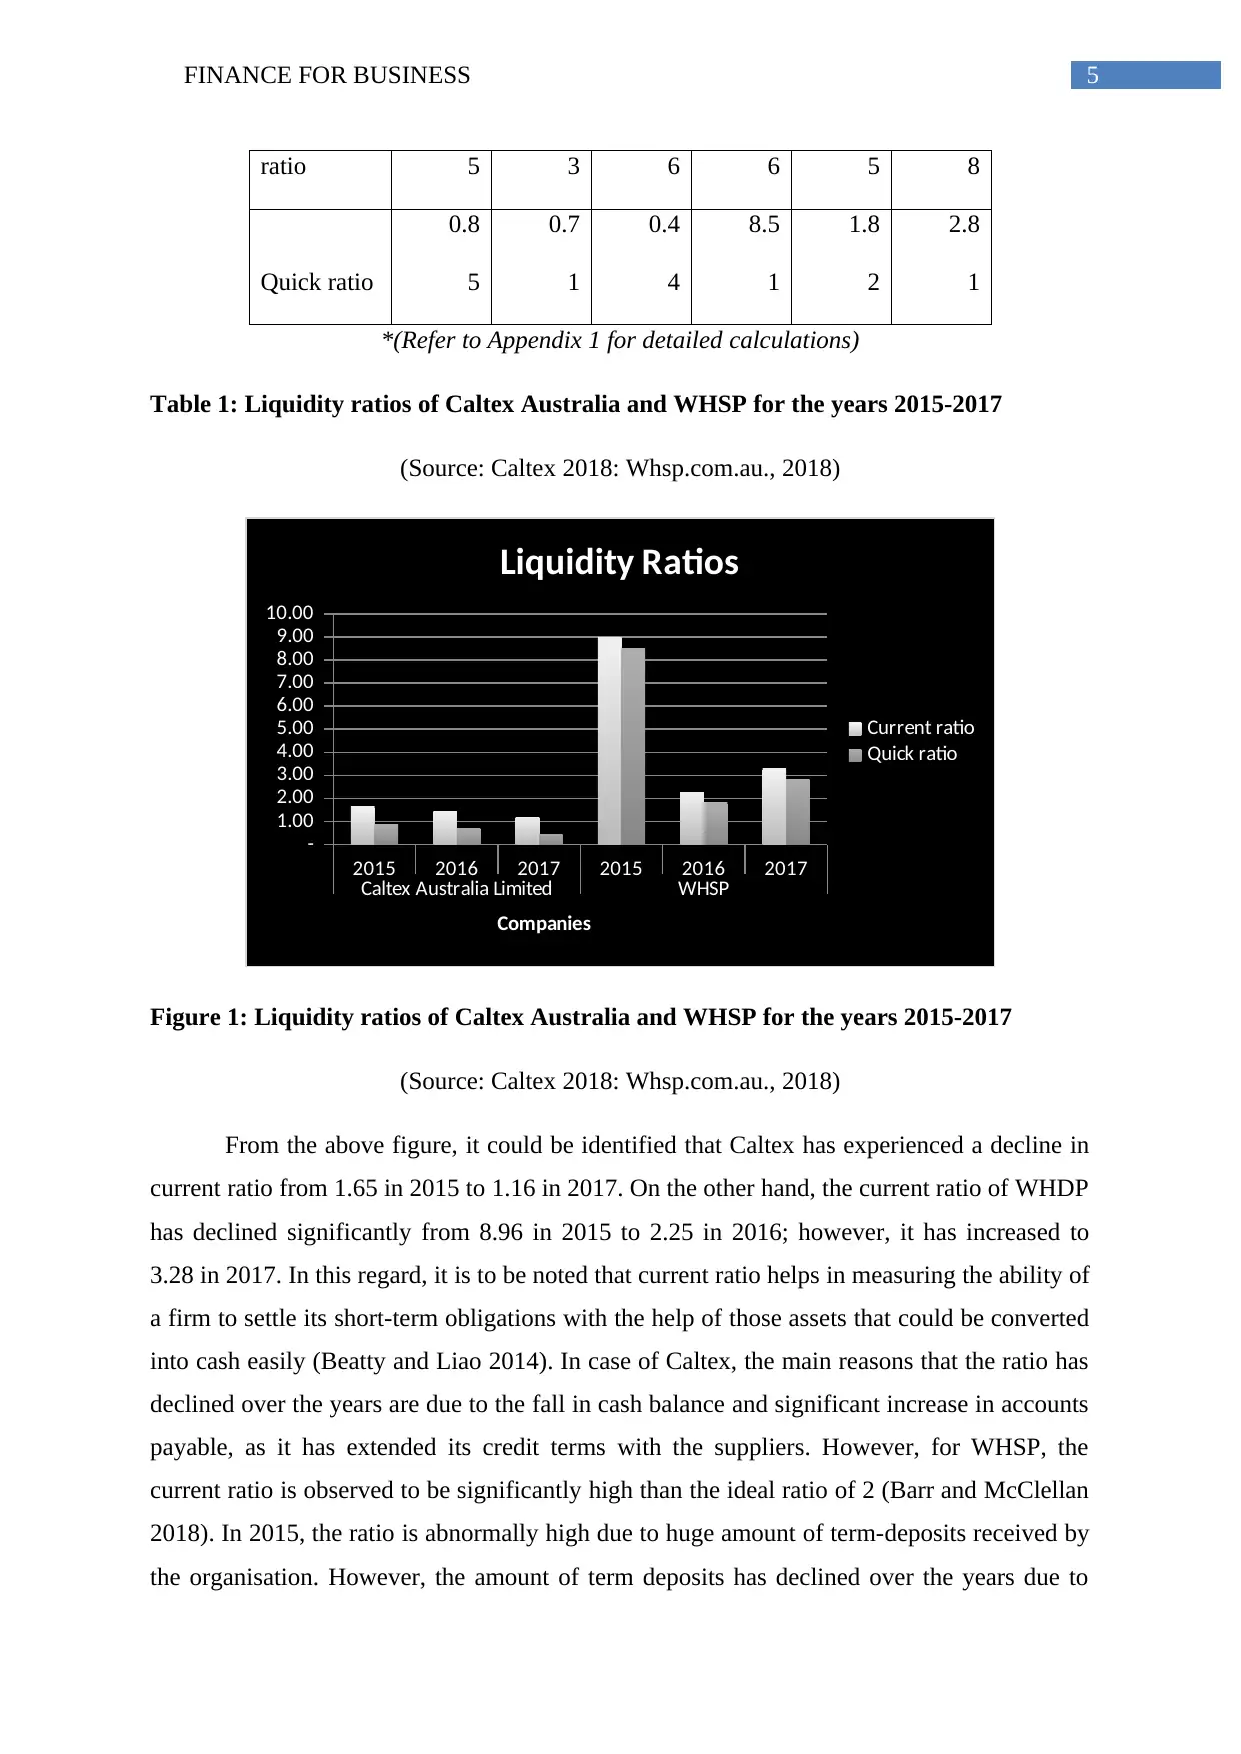
Figure 1: Liquidity ratios of Caltex Australia and WHSP for the years 2015-2017
(Source: Caltex 2018: Whsp.com.au., 2018)
From the above figure, it could be identified that Caltex has experienced a decline in
current ratio from 1.65 in 2015 to 1.16 in 2017. On the other hand, the current ratio of WHDP
has declined significantly from 8.96 in 2015 to 2.25 in 2016; however, it has increased to
3.28 in 2017. In this regard, it is to be noted that current ratio helps in measuring the ability of
a firm to settle its short-term obligations with the help of those assets that could be converted
into cash easily (Beatty and Liao 2014). In case of Caltex, the main reasons that the ratio has
declined over the years are due to the fall in cash balance and significant increase in accounts
payable, as it has extended its credit terms with the suppliers. However, for WHSP, the
current ratio is observed to be significantly high than the ideal ratio of 2 (Barr and McClellan
2018). In 2015, the ratio is abnormally high due to huge amount of term-deposits received by
the organisation. However, the amount of term deposits has declined over the years due to
ratio 5 3 6 6 5 8
Quick ratio
0.8
5
0.7
1
0.4
4
8.5
1
1.8
2
2.8
1
*(Refer to Appendix 1 for detailed calculations)
Table 1: Liquidity ratios of Caltex Australia and WHSP for the years 2015-2017
(Source: Caltex 2018: Whsp.com.au., 2018)
2015 2016 2017 2015 2016 2017
Caltex Australia Limited WHSP
-
1.00
2.00
3.00
4.00
5.00
6.00
7.00
8.00
9.00
10.00
Liquidity Ratios
Current ratio
Quick ratio
Companies
Figure 1: Liquidity ratios of Caltex Australia and WHSP for the years 2015-2017
(Source: Caltex 2018: Whsp.com.au., 2018)
From the above figure, it could be identified that Caltex has experienced a decline in
current ratio from 1.65 in 2015 to 1.16 in 2017. On the other hand, the current ratio of WHDP
has declined significantly from 8.96 in 2015 to 2.25 in 2016; however, it has increased to
3.28 in 2017. In this regard, it is to be noted that current ratio helps in measuring the ability of
a firm to settle its short-term obligations with the help of those assets that could be converted
into cash easily (Beatty and Liao 2014). In case of Caltex, the main reasons that the ratio has
declined over the years are due to the fall in cash balance and significant increase in accounts
payable, as it has extended its credit terms with the suppliers. However, for WHSP, the
current ratio is observed to be significantly high than the ideal ratio of 2 (Barr and McClellan
2018). In 2015, the ratio is abnormally high due to huge amount of term-deposits received by
the organisation. However, the amount of term deposits has declined over the years due to
⊘ This is a preview!⊘
Do you want full access?
Subscribe today to unlock all pages.
Trusted by 1+ million students worldwide
6FINANCE FOR BUSINESS
which reduction in current ratio could be observed in the next two years; however, it has
adequate cash base kept as idle, which could be invested for improving the existing business
operations (Bekaert and Hodrick 2017).
Quick ratio is another liquidity ratio, which gauges the capability of a firm to clear its
short-term dues with the most liquid assets. Hence, it denotes that inventories are deducted
from current assets at the time of computing this ratio and the ideal standard is considered to
be 1 (Brigham et al. 2016). The similar trend is observed like that of current ratio for both the
organisations and no significant variations could be observed from current ratio. This implies
that none of the firms are focusing on maintaining more inventory base after conducting
adequate market analysis. However, since the ratio is declining for Caltex, it could be said
that WHSP is placed favourably in terms of competitive position in the Australian market.
2.2 Profitability ratios:
For evaluating the profitability position of Caltex Australia Limited and WHSP, the
liquidity ratios that are taken into consideration include net margin, return on capital
employed, return on assets and return on equity. The calculations and analyses of these ratios
are represented as follows:
Particulars
Caltex Australia Limited WHSP
2015 2016 2017 2015 2016 2017
Net margin 2.61% 3.40% 2.90% 12.90% 19.49% 29.47%
Return on capital employed
(ROCE) 20.87% 24.60% 23.28% -0.82% 0.54% 9.34%
Return on assets 10.21% 11.73% 10.65% 1.93% 3.48% 7.34%
Return on equity 19.65% 21.81% 20.98% 2.19% 3.97% 8.57%
*(Refer to Appendix 2 for detailed calculations)
Table 2: Profitability ratios of Caltex Australia and WHSP for the years 2015-2017
(Source: Caltex 2018: Whsp.com.au 2018)
Paraphrase This Document
Need a fresh take? Get an instant paraphrase of this document with our AI Paraphraser
7FINANCE FOR BUSINESS
2015 2016 2017 2015 2016 2017
Caltex Australia Limited WHSP
-5.00%
0.00%
5.00%
10.00%
15.00%
20.00%
25.00%
30.00%
35.00%
Profitability Ratios
Net margin
Return on capital
employed (ROCE)
Return on assets
Return on equity
Companies
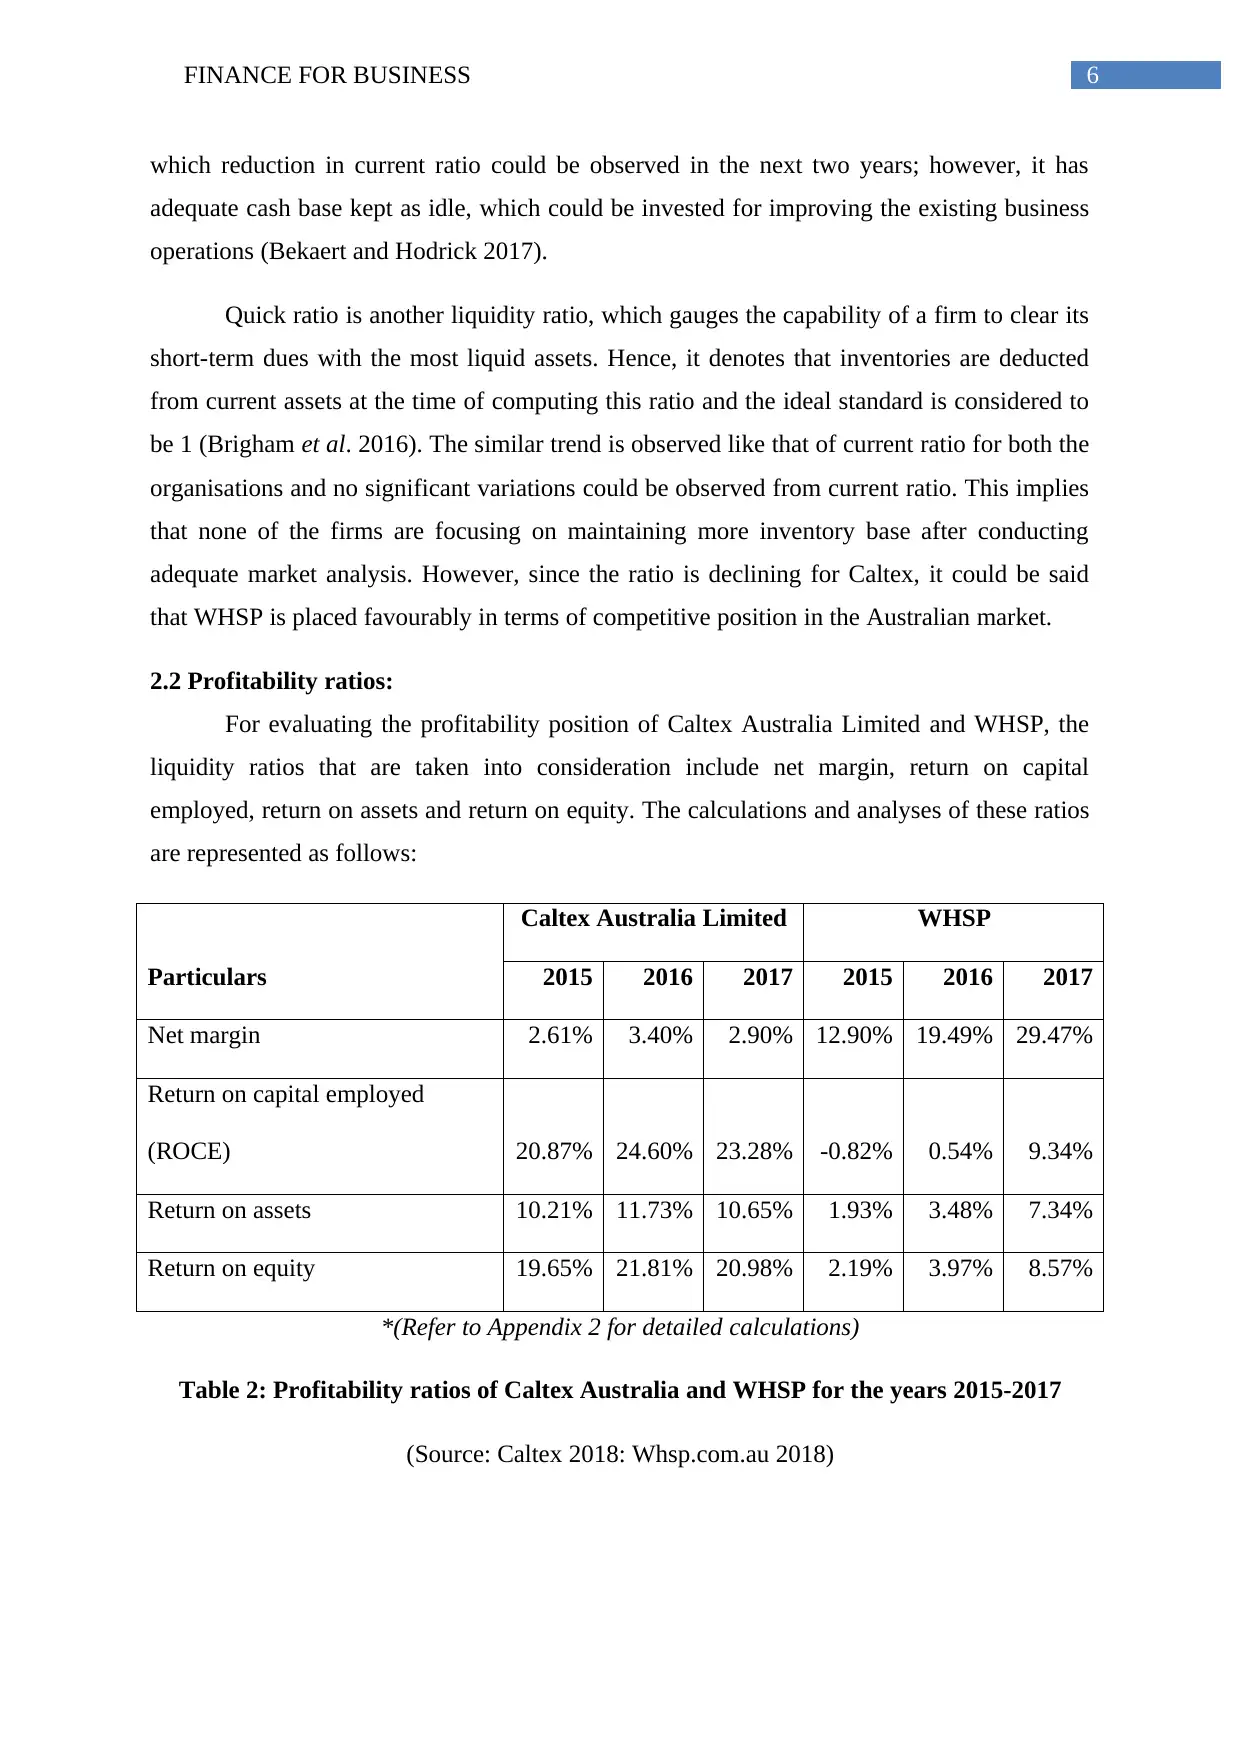
Figure 2: Profitability ratios of Caltex Australia and WHSP for the years 2015-2017
(Source: Caltex 2018: Whsp.com.au 2018)
According to the above figure, net margin is observed to increase from 2.61% in 2015
to 3.40% in 2016; however, it has declined again to 2.90% in 2017 for Caltex. In this context,
Buehlmaier and Whited (2018) advocated that net margin is the percentage of profit earned
by an organisation after deduction of all the relevant costs and expenses. For Caltex, decline
could be observed in net margin due to significant rise in net foreign exchange losses and
selling and distribution expenses. On the other hand, WHSP has managed to reduce its
overall expenses; thus, resulting in greater profit.
ROCE is a financial ratio, which gauges the profitability of an organisation and
efficiency with which the employment of capital is made (Callen 2015). In case of Caltex, a
steady rate is maintained throughout the years, while the rate has been significantly lower for
WHSP despite considerable rise in 2017. The main reason behind such trends is that Caltex
has maintained a steady operating profit over the years and for WHSP, operating profit was
poor in 2015 and 2016; improvement is observed in 2017 due to which ROCE has increased
accordingly.
Return on assets is a financial ratio that denotes the efficiency of an organisation in
converting money utilised to buy assets into net profit (Dhaene et al. 2017). Even though the
trend is fluctuating for Caltex and the ratio has increased for WHSP over the years, the return
of the latter is still lower than the former. This is because net profit of WHSP has increased
2015 2016 2017 2015 2016 2017
Caltex Australia Limited WHSP
-5.00%
0.00%
5.00%
10.00%
15.00%
20.00%
25.00%
30.00%
35.00%
Profitability Ratios
Net margin
Return on capital
employed (ROCE)
Return on assets
Return on equity
Companies
Figure 2: Profitability ratios of Caltex Australia and WHSP for the years 2015-2017
(Source: Caltex 2018: Whsp.com.au 2018)
According to the above figure, net margin is observed to increase from 2.61% in 2015
to 3.40% in 2016; however, it has declined again to 2.90% in 2017 for Caltex. In this context,
Buehlmaier and Whited (2018) advocated that net margin is the percentage of profit earned
by an organisation after deduction of all the relevant costs and expenses. For Caltex, decline
could be observed in net margin due to significant rise in net foreign exchange losses and
selling and distribution expenses. On the other hand, WHSP has managed to reduce its
overall expenses; thus, resulting in greater profit.
ROCE is a financial ratio, which gauges the profitability of an organisation and
efficiency with which the employment of capital is made (Callen 2015). In case of Caltex, a
steady rate is maintained throughout the years, while the rate has been significantly lower for
WHSP despite considerable rise in 2017. The main reason behind such trends is that Caltex
has maintained a steady operating profit over the years and for WHSP, operating profit was
poor in 2015 and 2016; improvement is observed in 2017 due to which ROCE has increased
accordingly.
Return on assets is a financial ratio that denotes the efficiency of an organisation in
converting money utilised to buy assets into net profit (Dhaene et al. 2017). Even though the
trend is fluctuating for Caltex and the ratio has increased for WHSP over the years, the return
of the latter is still lower than the former. This is because net profit of WHSP has increased
8FINANCE FOR BUSINESS
considerably over the years, while no such remarkable rise could be observed in its asset
base. However, the trend is steady for Caltex, due to which it has managed to earn more from
its assets.
Return on equity measures the efficacy of an organisation in using money from the
shareholders in generating profits and growing the same. In case of Caltex Australia, the ratio
has not varied much over the years; however, it has increased considerably for WHSP.
Despite such increase for WHSP, it is still lower in contrast to Caltex again due to the
unsteady net income earned by the former over the three-year period.
Therefore, based on the above evaluation, it could be said that the overall profitability
position of Caltex is better compared to that of WHSP in the Australian market.
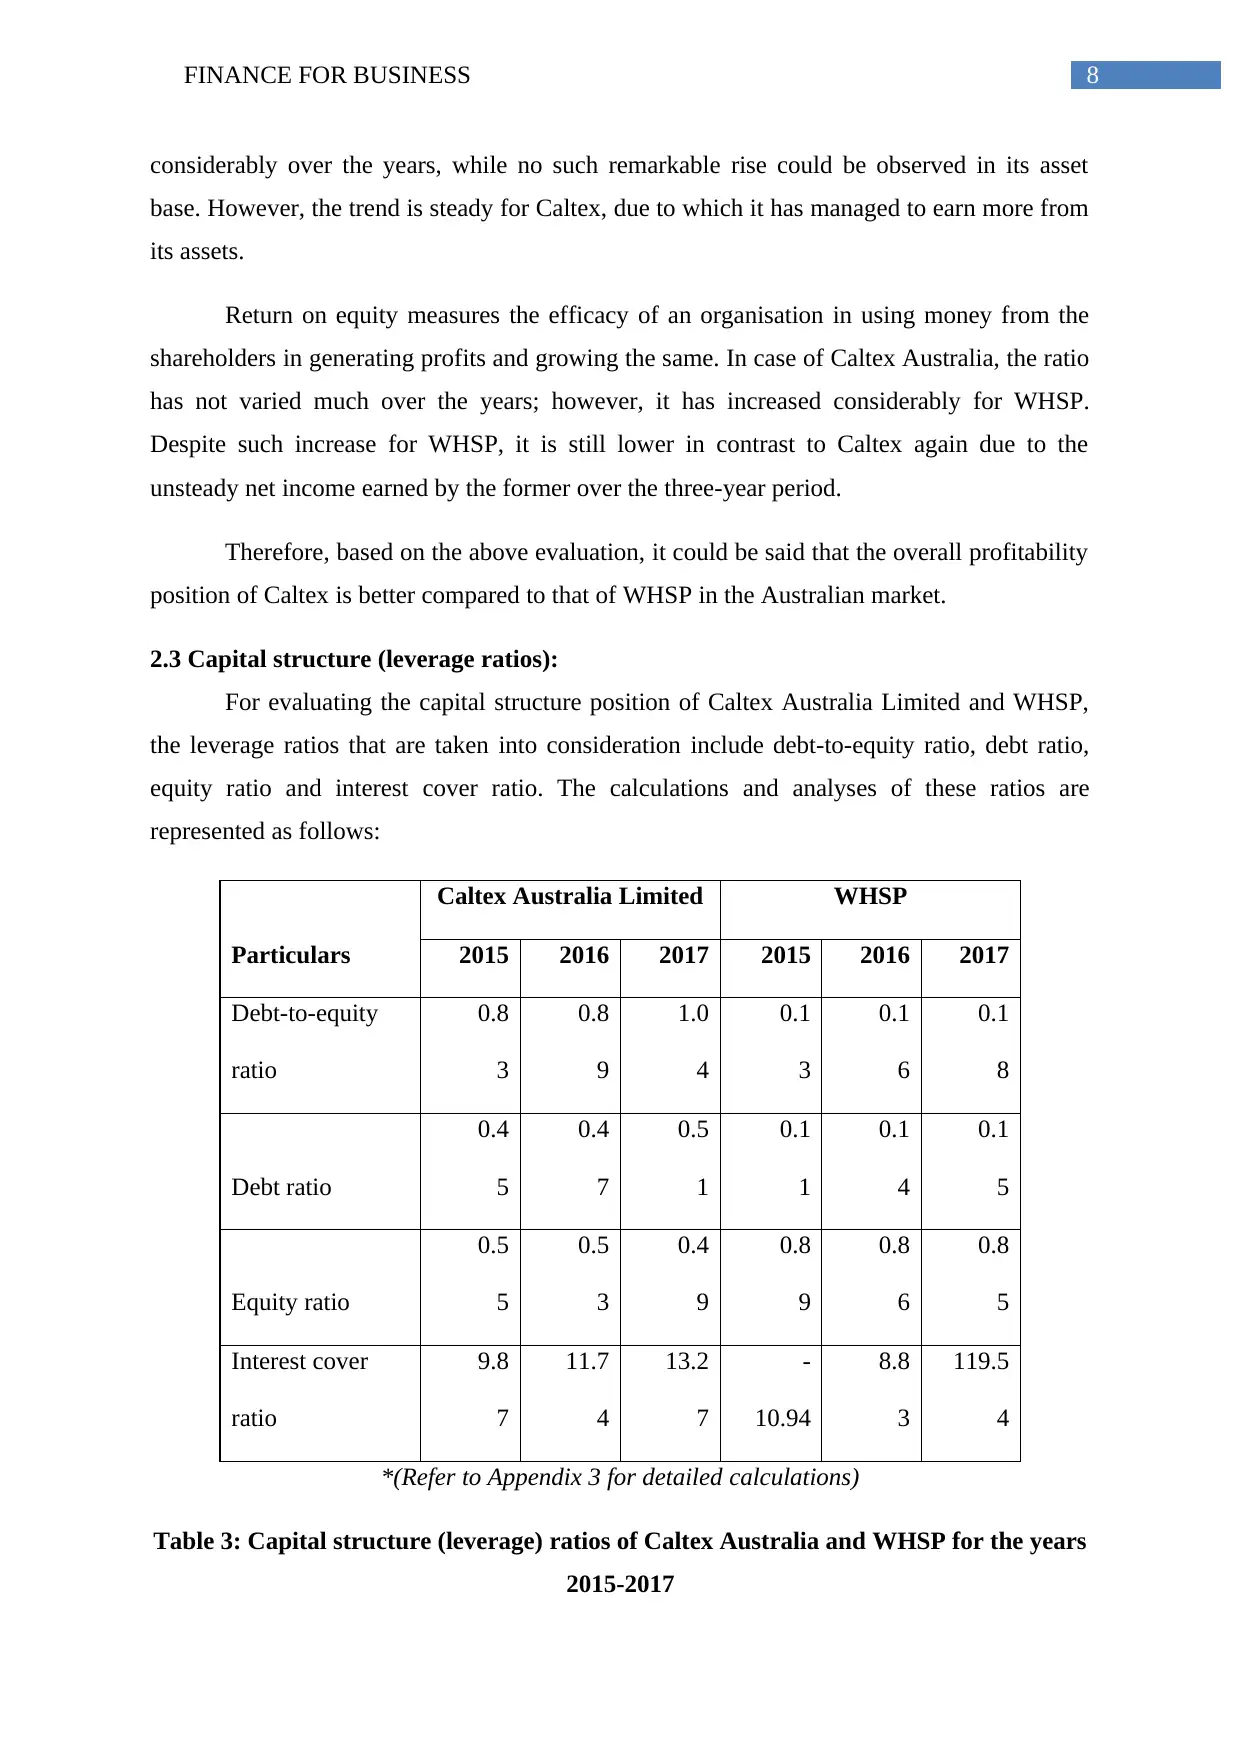
2.3 Capital structure (leverage ratios):
For evaluating the capital structure position of Caltex Australia Limited and WHSP,
the leverage ratios that are taken into consideration include debt-to-equity ratio, debt ratio,
equity ratio and interest cover ratio. The calculations and analyses of these ratios are
represented as follows:
Particulars
Caltex Australia Limited WHSP
2015 2016 2017 2015 2016 2017
Debt-to-equity
ratio
0.8
3
0.8
9
1.0
4
0.1
3
0.1
6
0.1
8
Debt ratio
0.4
5
0.4
7
0.5
1
0.1
1
0.1
4
0.1
5
Equity ratio
0.5
5
0.5
3
0.4
9
0.8
9
0.8
6
0.8
5
Interest cover
ratio
9.8
7
11.7
4
13.2
7
-
10.94
8.8
3
119.5
4
*(Refer to Appendix 3 for detailed calculations)
Table 3: Capital structure (leverage) ratios of Caltex Australia and WHSP for the years
2015-2017
considerably over the years, while no such remarkable rise could be observed in its asset
base. However, the trend is steady for Caltex, due to which it has managed to earn more from
its assets.
Return on equity measures the efficacy of an organisation in using money from the
shareholders in generating profits and growing the same. In case of Caltex Australia, the ratio
has not varied much over the years; however, it has increased considerably for WHSP.
Despite such increase for WHSP, it is still lower in contrast to Caltex again due to the
unsteady net income earned by the former over the three-year period.
Therefore, based on the above evaluation, it could be said that the overall profitability
position of Caltex is better compared to that of WHSP in the Australian market.
2.3 Capital structure (leverage ratios):
For evaluating the capital structure position of Caltex Australia Limited and WHSP,
the leverage ratios that are taken into consideration include debt-to-equity ratio, debt ratio,
equity ratio and interest cover ratio. The calculations and analyses of these ratios are
represented as follows:
Particulars
Caltex Australia Limited WHSP
2015 2016 2017 2015 2016 2017
Debt-to-equity
ratio
0.8
3
0.8
9
1.0
4
0.1
3
0.1
6
0.1
8
Debt ratio
0.4
5
0.4
7
0.5
1
0.1
1
0.1
4
0.1
5
Equity ratio
0.5
5
0.5
3
0.4
9
0.8
9
0.8
6
0.8
5
Interest cover
ratio
9.8
7
11.7
4
13.2
7
-
10.94
8.8
3
119.5
4
*(Refer to Appendix 3 for detailed calculations)
Table 3: Capital structure (leverage) ratios of Caltex Australia and WHSP for the years
2015-2017
⊘ This is a preview!⊘
Do you want full access?
Subscribe today to unlock all pages.
Trusted by 1+ million students worldwide
9FINANCE FOR BUSINESS
(Source: Caltex 2018: Whsp.com.au 2018)
2015 2016 2017 2015 2016 2017
Caltex Australia Limited WHSP
-20.00
-
20.00
40.00
60.00
80.00
100.00
120.00
140.00
Capital Structure (Leverage) Ratios
Debt-to-equity ratio
Debt ratio
Equity ratio
Interest cover ratio
Companies
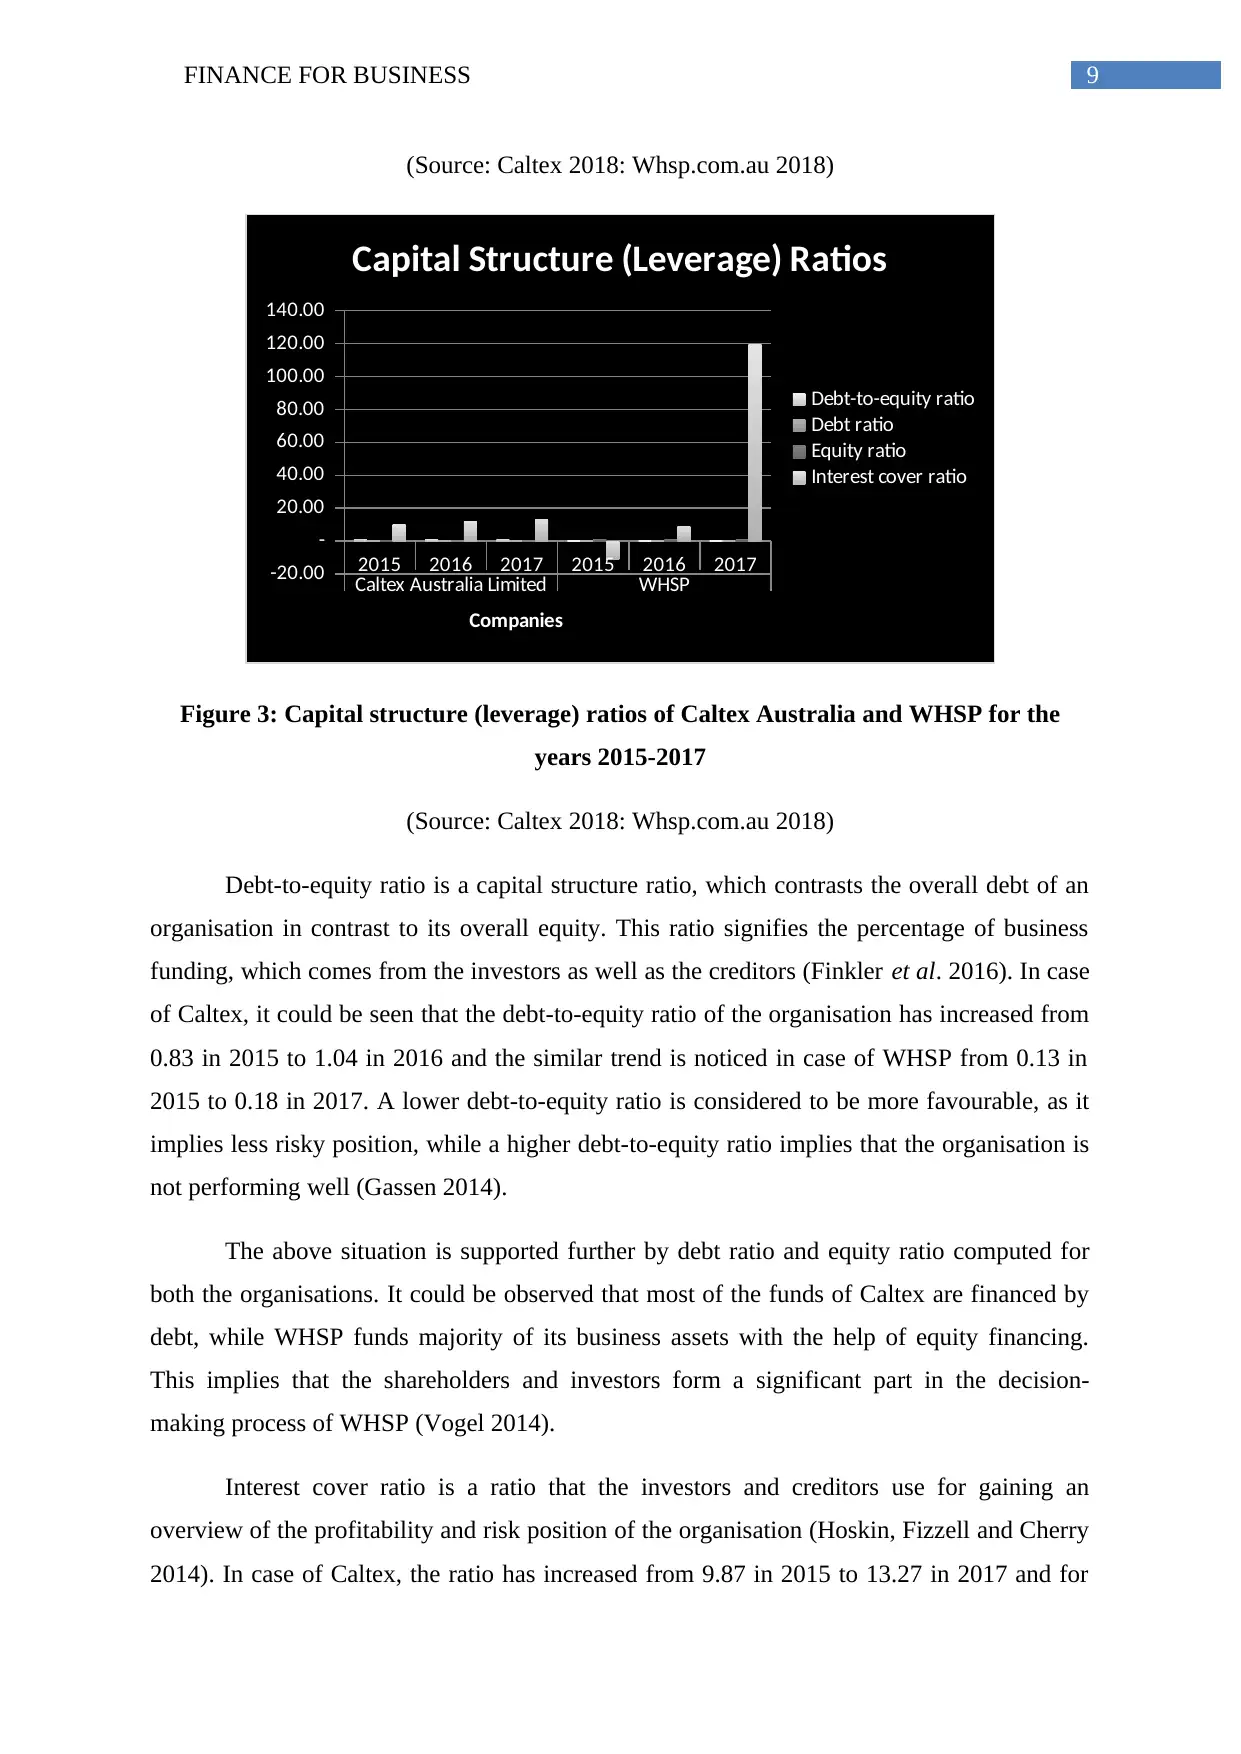
Figure 3: Capital structure (leverage) ratios of Caltex Australia and WHSP for the
years 2015-2017
(Source: Caltex 2018: Whsp.com.au 2018)
Debt-to-equity ratio is a capital structure ratio, which contrasts the overall debt of an
organisation in contrast to its overall equity. This ratio signifies the percentage of business
funding, which comes from the investors as well as the creditors (Finkler et al. 2016). In case
of Caltex, it could be seen that the debt-to-equity ratio of the organisation has increased from
0.83 in 2015 to 1.04 in 2016 and the similar trend is noticed in case of WHSP from 0.13 in
2015 to 0.18 in 2017. A lower debt-to-equity ratio is considered to be more favourable, as it
implies less risky position, while a higher debt-to-equity ratio implies that the organisation is
not performing well (Gassen 2014).
The above situation is supported further by debt ratio and equity ratio computed for
both the organisations. It could be observed that most of the funds of Caltex are financed by
debt, while WHSP funds majority of its business assets with the help of equity financing.
This implies that the shareholders and investors form a significant part in the decision-
making process of WHSP (Vogel 2014).
Interest cover ratio is a ratio that the investors and creditors use for gaining an
overview of the profitability and risk position of the organisation (Hoskin, Fizzell and Cherry
2014). In case of Caltex, the ratio has increased from 9.87 in 2015 to 13.27 in 2017 and for
(Source: Caltex 2018: Whsp.com.au 2018)
2015 2016 2017 2015 2016 2017
Caltex Australia Limited WHSP
-20.00
-
20.00
40.00
60.00
80.00
100.00
120.00
140.00
Capital Structure (Leverage) Ratios
Debt-to-equity ratio
Debt ratio
Equity ratio
Interest cover ratio
Companies
Figure 3: Capital structure (leverage) ratios of Caltex Australia and WHSP for the
years 2015-2017
(Source: Caltex 2018: Whsp.com.au 2018)
Debt-to-equity ratio is a capital structure ratio, which contrasts the overall debt of an
organisation in contrast to its overall equity. This ratio signifies the percentage of business
funding, which comes from the investors as well as the creditors (Finkler et al. 2016). In case
of Caltex, it could be seen that the debt-to-equity ratio of the organisation has increased from
0.83 in 2015 to 1.04 in 2016 and the similar trend is noticed in case of WHSP from 0.13 in
2015 to 0.18 in 2017. A lower debt-to-equity ratio is considered to be more favourable, as it
implies less risky position, while a higher debt-to-equity ratio implies that the organisation is
not performing well (Gassen 2014).
The above situation is supported further by debt ratio and equity ratio computed for
both the organisations. It could be observed that most of the funds of Caltex are financed by
debt, while WHSP funds majority of its business assets with the help of equity financing.
This implies that the shareholders and investors form a significant part in the decision-
making process of WHSP (Vogel 2014).
Interest cover ratio is a ratio that the investors and creditors use for gaining an
overview of the profitability and risk position of the organisation (Hoskin, Fizzell and Cherry
2014). In case of Caltex, the ratio has increased from 9.87 in 2015 to 13.27 in 2017 and for
Paraphrase This Document
Need a fresh take? Get an instant paraphrase of this document with our AI Paraphraser
10FINANCE FOR BUSINESS
WHSP; the ratio has experienced a massive increase from -10.94 in 2015 to 119.54 in 2017.
The main reason behind such massive rise is due to significant increase in operating profit
because of revenue increase as well as that of other income.
Therefore, in terms of leverage position, WHSP is placed in a favourable position in
the Australian market in contrast to Caltex Australia Limited.
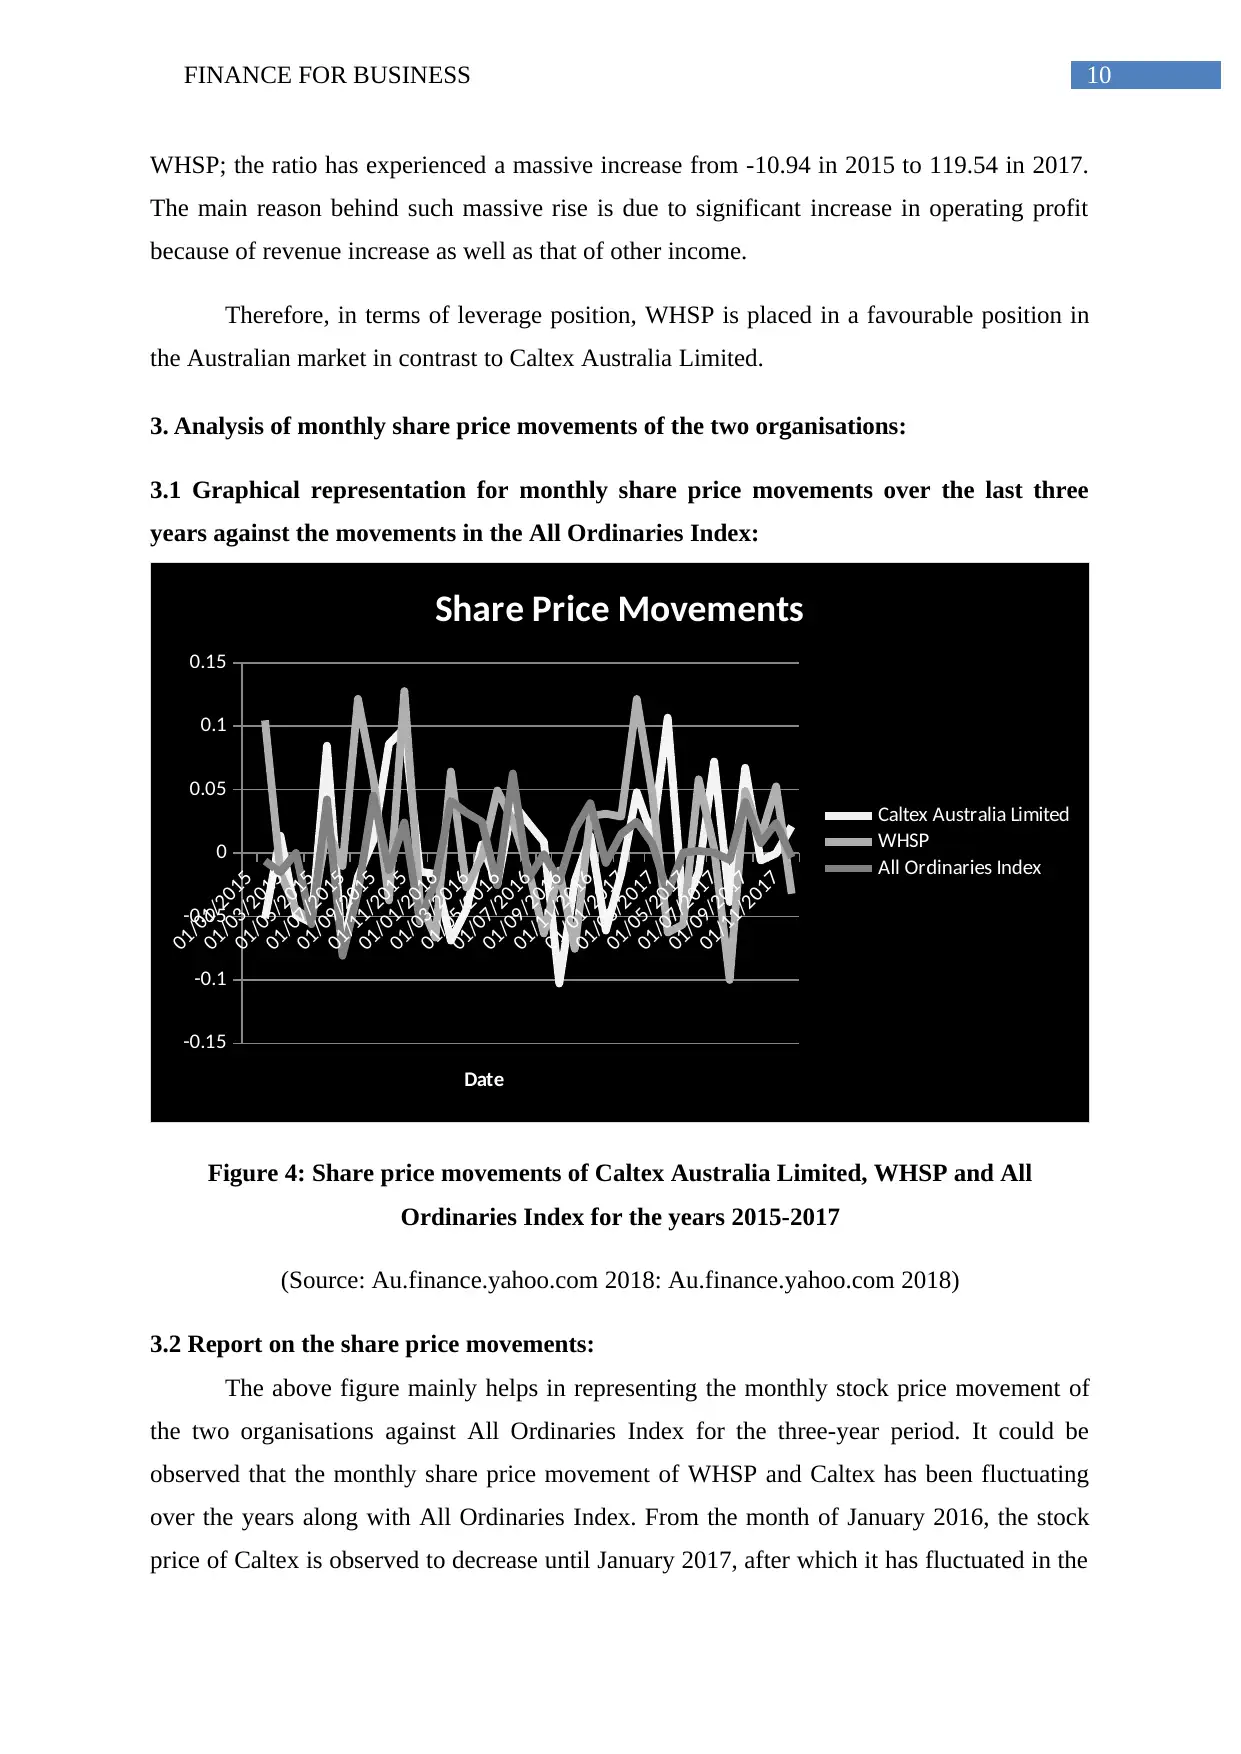
3. Analysis of monthly share price movements of the two organisations:
3.1 Graphical representation for monthly share price movements over the last three
years against the movements in the All Ordinaries Index:
01/01/2015
01/03/2015
01/05/2015
01/07/2015
01/09/2015
01/11/2015
01/01/2016
01/03/2016
01/05/2016
01/07/2016
01/09/2016
01/11/2016
01/01/2017
01/03/2017
01/05/2017
01/07/2017
01/09/2017
01/11/2017
-0.15
-0.1
-0.05
0
0.05
0.1
0.15
Share Price Movements
Caltex Australia Limited
WHSP
All Ordinaries Index
Date
Figure 4: Share price movements of Caltex Australia Limited, WHSP and All
Ordinaries Index for the years 2015-2017
(Source: Au.finance.yahoo.com 2018: Au.finance.yahoo.com 2018)
3.2 Report on the share price movements:
The above figure mainly helps in representing the monthly stock price movement of
the two organisations against All Ordinaries Index for the three-year period. It could be
observed that the monthly share price movement of WHSP and Caltex has been fluctuating
over the years along with All Ordinaries Index. From the month of January 2016, the stock
price of Caltex is observed to decrease until January 2017, after which it has fluctuated in the
WHSP; the ratio has experienced a massive increase from -10.94 in 2015 to 119.54 in 2017.
The main reason behind such massive rise is due to significant increase in operating profit
because of revenue increase as well as that of other income.
Therefore, in terms of leverage position, WHSP is placed in a favourable position in
the Australian market in contrast to Caltex Australia Limited.
3. Analysis of monthly share price movements of the two organisations:
3.1 Graphical representation for monthly share price movements over the last three
years against the movements in the All Ordinaries Index:
01/01/2015
01/03/2015
01/05/2015
01/07/2015
01/09/2015
01/11/2015
01/01/2016
01/03/2016
01/05/2016
01/07/2016
01/09/2016
01/11/2016
01/01/2017
01/03/2017
01/05/2017
01/07/2017
01/09/2017
01/11/2017
-0.15
-0.1
-0.05
0
0.05
0.1
0.15
Share Price Movements
Caltex Australia Limited
WHSP
All Ordinaries Index
Date
Figure 4: Share price movements of Caltex Australia Limited, WHSP and All
Ordinaries Index for the years 2015-2017
(Source: Au.finance.yahoo.com 2018: Au.finance.yahoo.com 2018)
3.2 Report on the share price movements:
The above figure mainly helps in representing the monthly stock price movement of
the two organisations against All Ordinaries Index for the three-year period. It could be
observed that the monthly share price movement of WHSP and Caltex has been fluctuating
over the years along with All Ordinaries Index. From the month of January 2016, the stock
price of Caltex is observed to decrease until January 2017, after which it has fluctuated in the
11FINANCE FOR BUSINESS
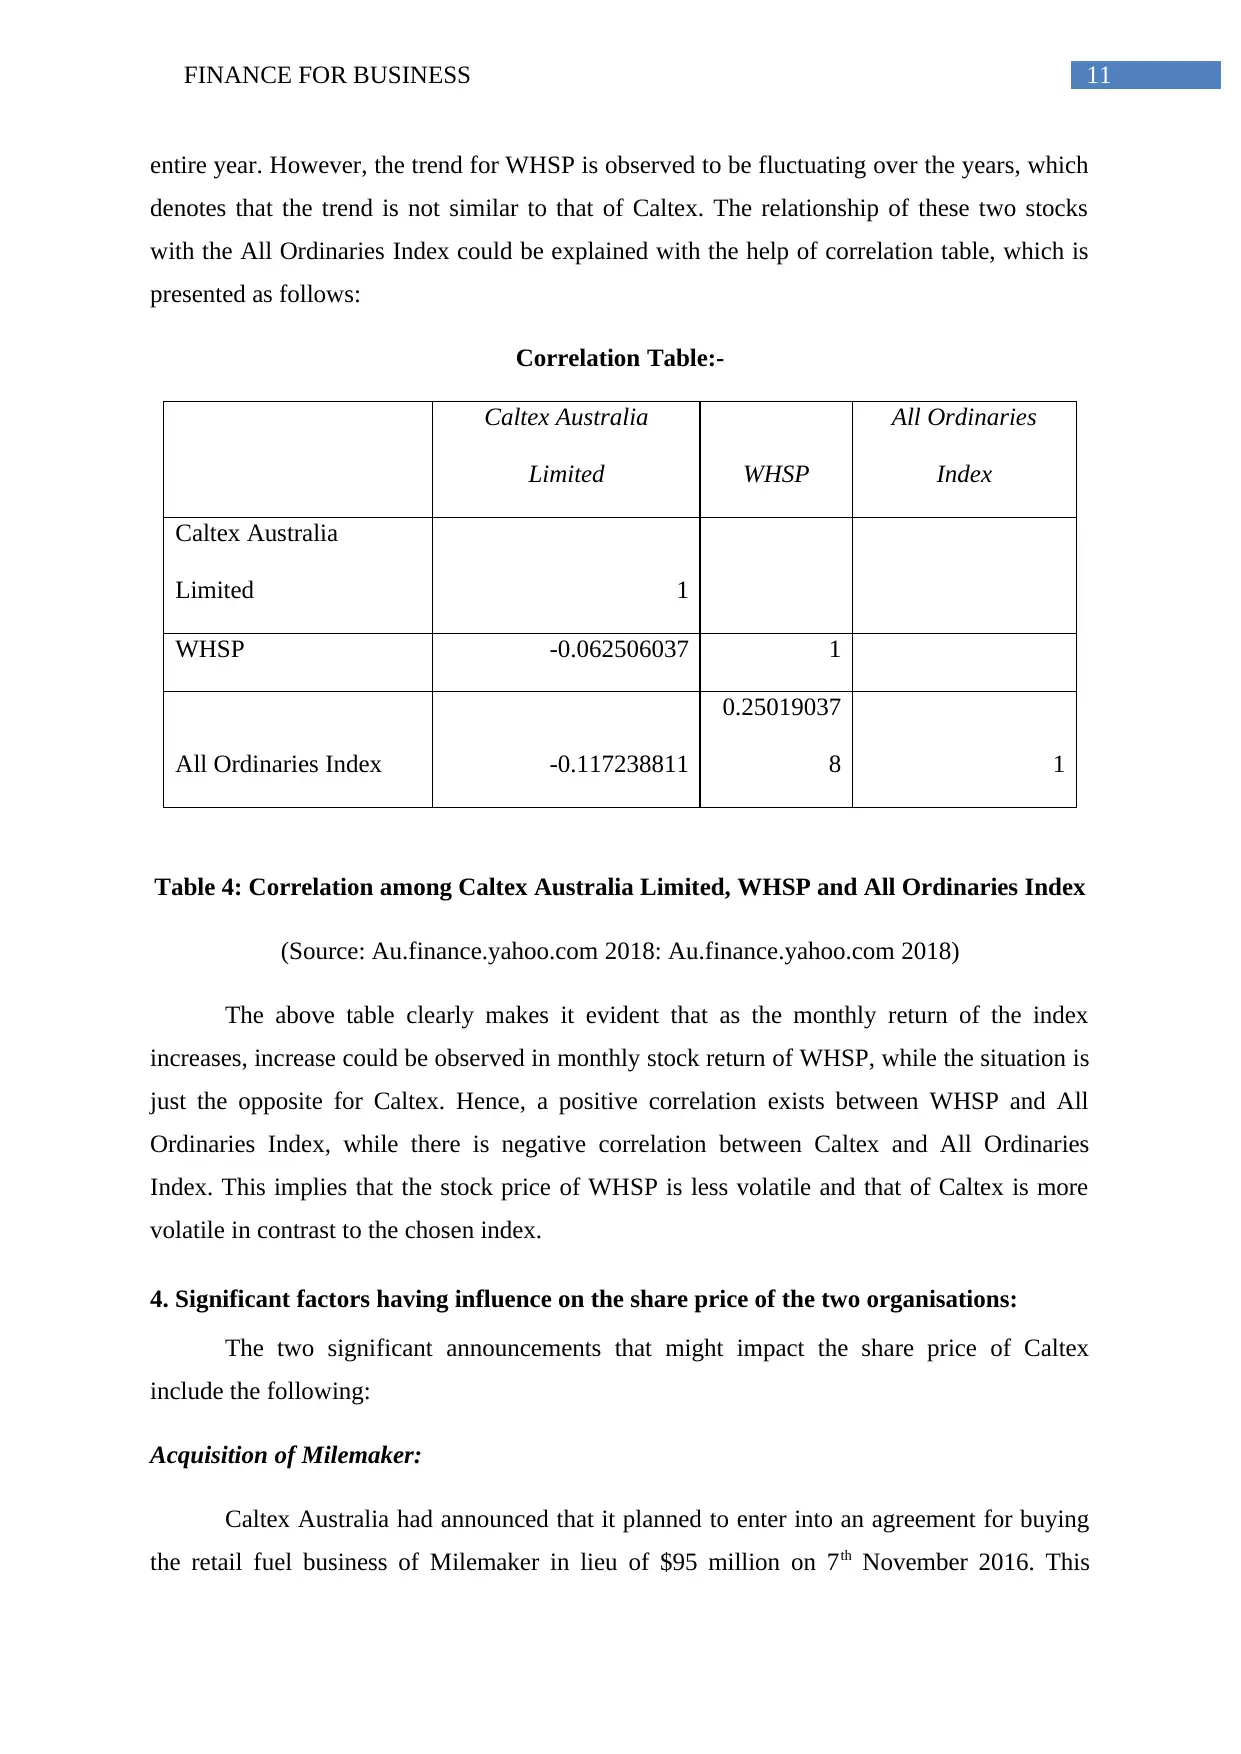
entire year. However, the trend for WHSP is observed to be fluctuating over the years, which
denotes that the trend is not similar to that of Caltex. The relationship of these two stocks
with the All Ordinaries Index could be explained with the help of correlation table, which is
presented as follows:
Correlation Table:-
Caltex Australia
Limited WHSP
All Ordinaries
Index
Caltex Australia
Limited 1
WHSP -0.062506037 1
All Ordinaries Index -0.117238811
0.25019037
8 1
Table 4: Correlation among Caltex Australia Limited, WHSP and All Ordinaries Index
(Source: Au.finance.yahoo.com 2018: Au.finance.yahoo.com 2018)
The above table clearly makes it evident that as the monthly return of the index
increases, increase could be observed in monthly stock return of WHSP, while the situation is
just the opposite for Caltex. Hence, a positive correlation exists between WHSP and All
Ordinaries Index, while there is negative correlation between Caltex and All Ordinaries
Index. This implies that the stock price of WHSP is less volatile and that of Caltex is more
volatile in contrast to the chosen index.
4. Significant factors having influence on the share price of the two organisations:
The two significant announcements that might impact the share price of Caltex
include the following:
Acquisition of Milemaker:
Caltex Australia had announced that it planned to enter into an agreement for buying
the retail fuel business of Milemaker in lieu of $95 million on 7th November 2016. This
⊘ This is a preview!⊘
Do you want full access?
Subscribe today to unlock all pages.
Trusted by 1+ million students worldwide
1 out of 21
Related Documents


Your All-in-One AI-Powered Toolkit for Academic Success.
+13062052269
info@desklib.com
Available 24*7 on WhatsApp / Email
![[object Object]](/_next/static/media/star-bottom.7253800d.svg)
Unlock your academic potential
Copyright © 2020–2026 A2Z Services. All Rights Reserved. Developed and managed by ZUCOL.