Woolworths Financial Analysis: HI5002 Finance for Business Report
VerifiedAdded on 2023/03/30
|12
|3554
|344
Report
AI Summary
This report provides a comprehensive analysis of Woolworths' financial performance, focusing on key areas such as ratio analysis, cash management strategies, risk assessment, and dividend policies. The analysis includes a review of Woolworths' business operations, competitive advantages, and financial statements from 2016 to 2018. Key financial ratios related to liquidity, profitability, solvency, market value, and efficiency are computed and analyzed to assess the company's financial health and identify areas for improvement. The report also evaluates a potential project using Net Present Value (NPV) and sensitivity analysis, and examines the systematic and unsystematic risks facing the business. Finally, the report provides recommendations for enhancing Woolworths' overall business structure, considering factors like cash flow management, liquidity, and operational efficiency.
Running head: FINANCE FOR BUSINESS
FINANCE FOR BUSINESS
Name of the Student:
Name of the University:
Author’s Note:
FINANCE FOR BUSINESS
Name of the Student:
Name of the University:
Author’s Note:
Paraphrase This Document
Need a fresh take? Get an instant paraphrase of this document with our AI Paraphraser
1
FINANCE FOR BUSINESS
Table of Contents
Introduction........................................................................................................................2
Discussion..........................................................................................................................2
Description and Nature of the Business........................................................................2
Ratio Analysis of the Business.......................................................................................3
Cash Management Strategies.......................................................................................6
Systematic and Unsystematic risks of the business......................................................9
Dividend Policies..........................................................................................................10
Recommendations...........................................................................................................10
Conclusion.......................................................................................................................11
Reference........................................................................................................................11
2
FINANCE FOR BUSINESS
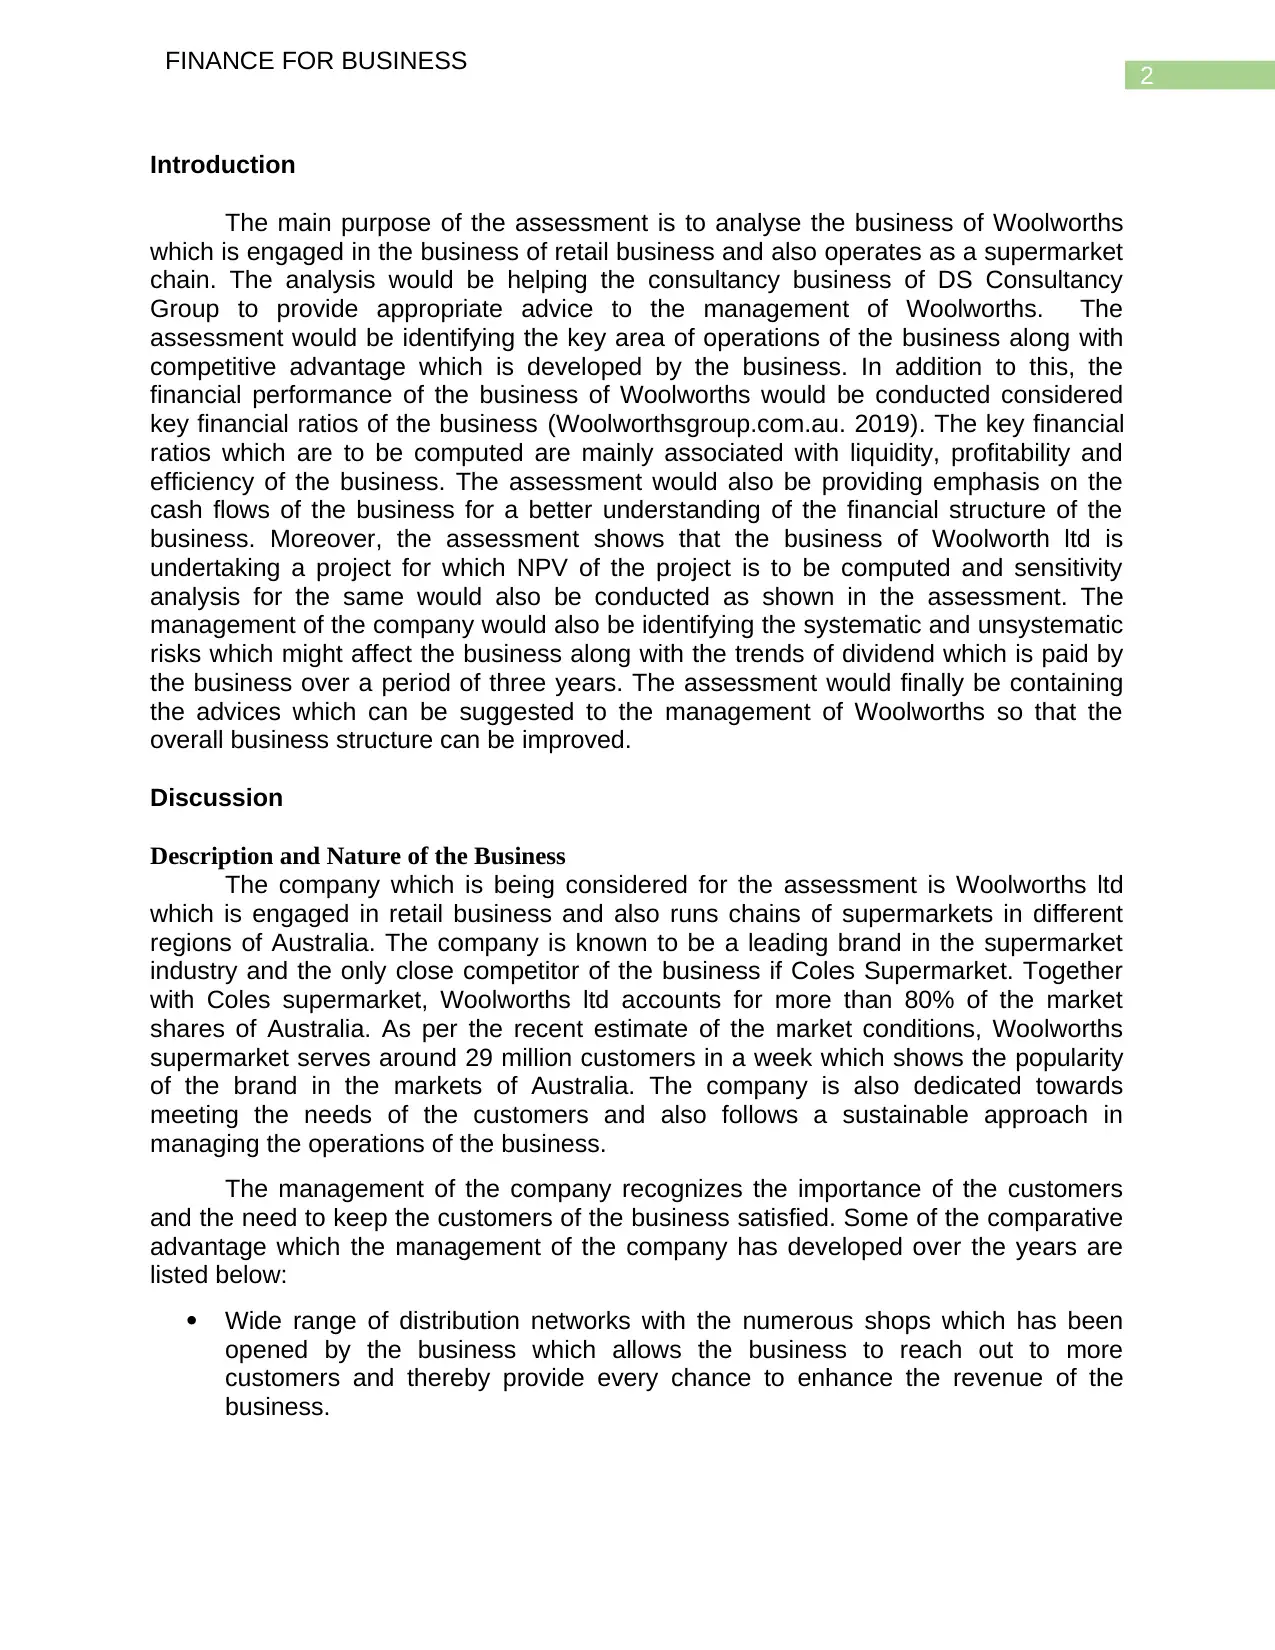
Introduction
The main purpose of the assessment is to analyse the business of Woolworths
which is engaged in the business of retail business and also operates as a supermarket
chain. The analysis would be helping the consultancy business of DS Consultancy
Group to provide appropriate advice to the management of Woolworths. The
assessment would be identifying the key area of operations of the business along with
competitive advantage which is developed by the business. In addition to this, the
financial performance of the business of Woolworths would be conducted considered
key financial ratios of the business (Woolworthsgroup.com.au. 2019). The key financial
ratios which are to be computed are mainly associated with liquidity, profitability and
efficiency of the business. The assessment would also be providing emphasis on the
cash flows of the business for a better understanding of the financial structure of the
business. Moreover, the assessment shows that the business of Woolworth ltd is
undertaking a project for which NPV of the project is to be computed and sensitivity
analysis for the same would also be conducted as shown in the assessment. The
management of the company would also be identifying the systematic and unsystematic
risks which might affect the business along with the trends of dividend which is paid by
the business over a period of three years. The assessment would finally be containing
the advices which can be suggested to the management of Woolworths so that the
overall business structure can be improved.
Discussion
Description and Nature of the Business
The company which is being considered for the assessment is Woolworths ltd
which is engaged in retail business and also runs chains of supermarkets in different
regions of Australia. The company is known to be a leading brand in the supermarket
industry and the only close competitor of the business if Coles Supermarket. Together
with Coles supermarket, Woolworths ltd accounts for more than 80% of the market
shares of Australia. As per the recent estimate of the market conditions, Woolworths
supermarket serves around 29 million customers in a week which shows the popularity
of the brand in the markets of Australia. The company is also dedicated towards
meeting the needs of the customers and also follows a sustainable approach in
managing the operations of the business.
The management of the company recognizes the importance of the customers
and the need to keep the customers of the business satisfied. Some of the comparative
advantage which the management of the company has developed over the years are
listed below:
Wide range of distribution networks with the numerous shops which has been
opened by the business which allows the business to reach out to more
customers and thereby provide every chance to enhance the revenue of the
business.
FINANCE FOR BUSINESS
Introduction
The main purpose of the assessment is to analyse the business of Woolworths
which is engaged in the business of retail business and also operates as a supermarket
chain. The analysis would be helping the consultancy business of DS Consultancy
Group to provide appropriate advice to the management of Woolworths. The
assessment would be identifying the key area of operations of the business along with
competitive advantage which is developed by the business. In addition to this, the
financial performance of the business of Woolworths would be conducted considered
key financial ratios of the business (Woolworthsgroup.com.au. 2019). The key financial
ratios which are to be computed are mainly associated with liquidity, profitability and
efficiency of the business. The assessment would also be providing emphasis on the
cash flows of the business for a better understanding of the financial structure of the
business. Moreover, the assessment shows that the business of Woolworth ltd is
undertaking a project for which NPV of the project is to be computed and sensitivity
analysis for the same would also be conducted as shown in the assessment. The
management of the company would also be identifying the systematic and unsystematic
risks which might affect the business along with the trends of dividend which is paid by
the business over a period of three years. The assessment would finally be containing
the advices which can be suggested to the management of Woolworths so that the
overall business structure can be improved.
Discussion
Description and Nature of the Business
The company which is being considered for the assessment is Woolworths ltd
which is engaged in retail business and also runs chains of supermarkets in different
regions of Australia. The company is known to be a leading brand in the supermarket
industry and the only close competitor of the business if Coles Supermarket. Together
with Coles supermarket, Woolworths ltd accounts for more than 80% of the market
shares of Australia. As per the recent estimate of the market conditions, Woolworths
supermarket serves around 29 million customers in a week which shows the popularity
of the brand in the markets of Australia. The company is also dedicated towards
meeting the needs of the customers and also follows a sustainable approach in
managing the operations of the business.
The management of the company recognizes the importance of the customers
and the need to keep the customers of the business satisfied. Some of the comparative
advantage which the management of the company has developed over the years are
listed below:
Wide range of distribution networks with the numerous shops which has been
opened by the business which allows the business to reach out to more
customers and thereby provide every chance to enhance the revenue of the
business.
⊘ This is a preview!⊘
Do you want full access?
Subscribe today to unlock all pages.
Trusted by 1+ million students worldwide
3
FINANCE FOR BUSINESS
The management of the company follows a low-cost model for the of keeping the
prices so that more customers can be attracted to the business. In this manner
as well, the business has built a brand loyalty for itself in the market.
The management of the company always follows innovative approach for the
purpose of appropriate meeting the needs of the customers and also for keeping
up with the level of competition in the market.
These approaches have made the business of Woolworths one of the leading
supermarket chains in the country. As per the current annual report of the company, the
management of the company is aiming to capture the grocery market by offering
grocery products at a cheaper price.
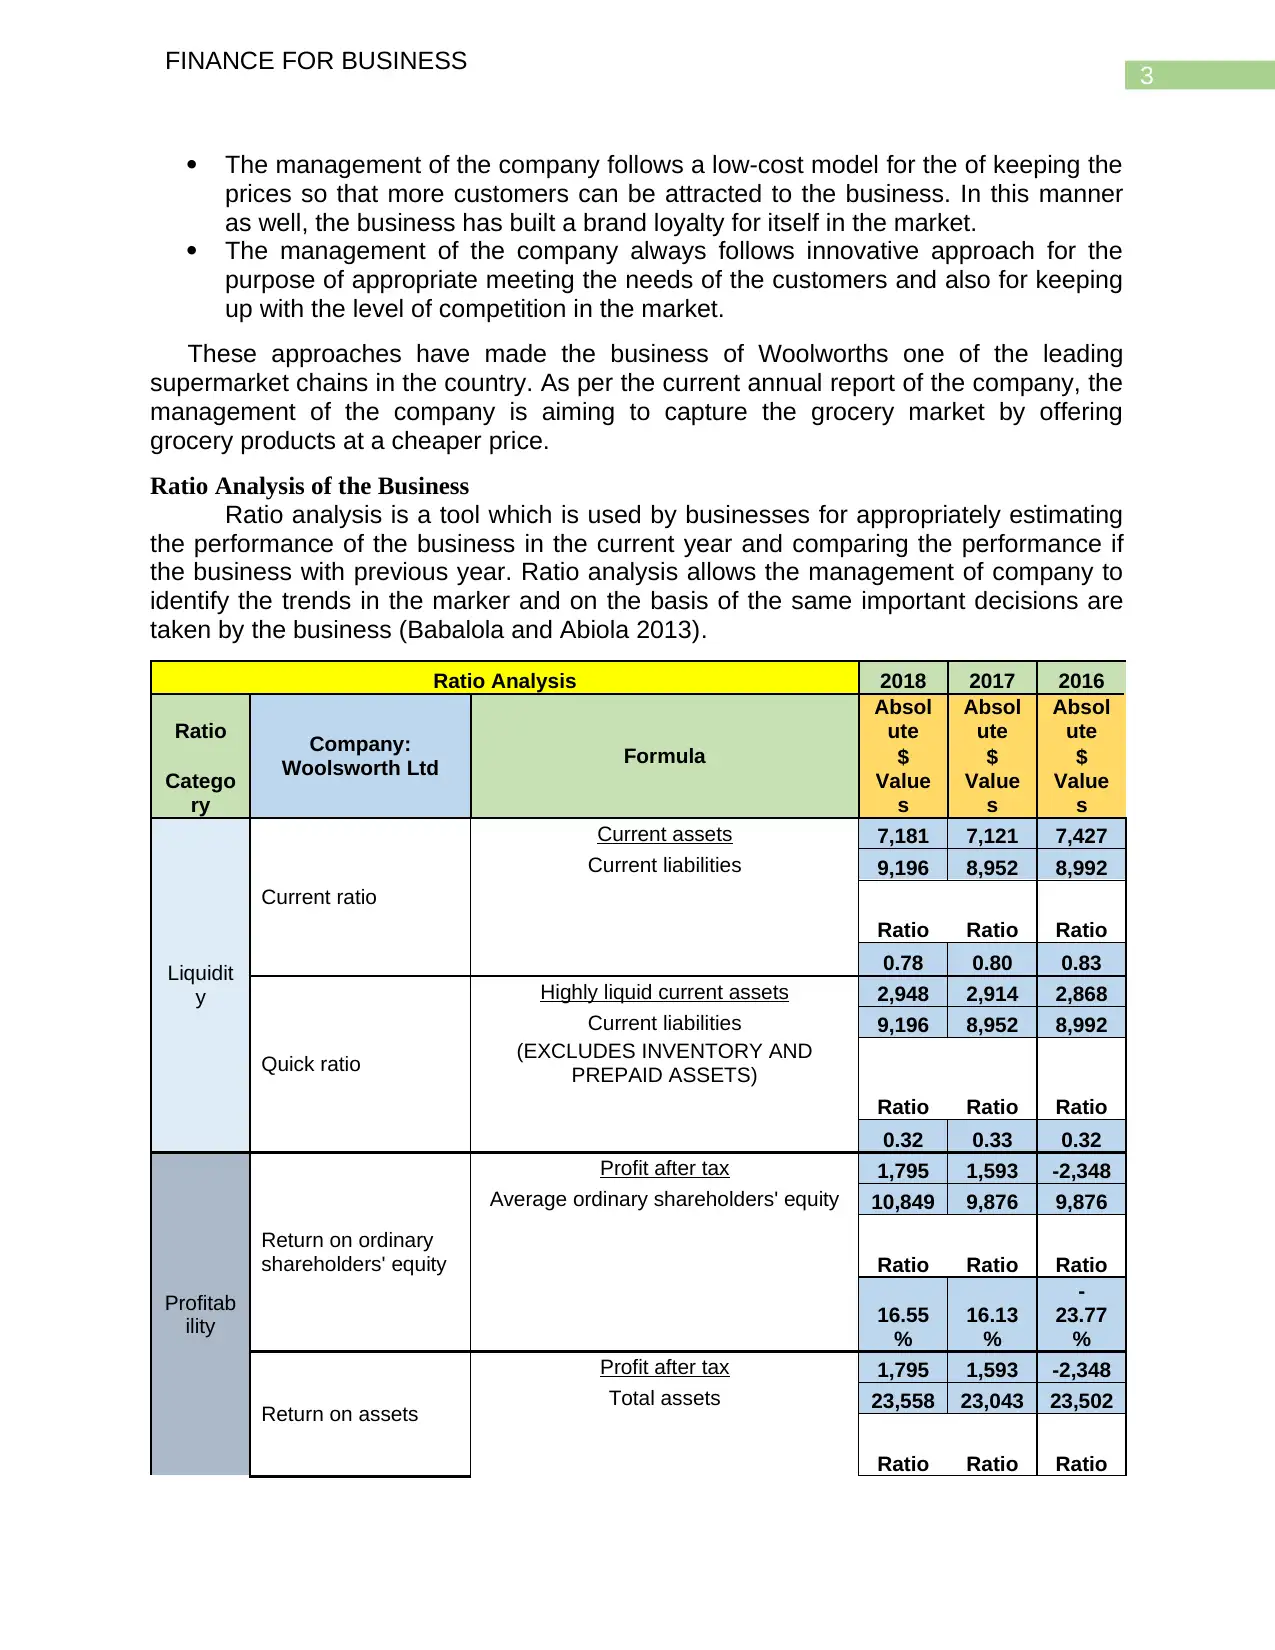
Ratio Analysis of the Business
Ratio analysis is a tool which is used by businesses for appropriately estimating
the performance of the business in the current year and comparing the performance if
the business with previous year. Ratio analysis allows the management of company to
identify the trends in the marker and on the basis of the same important decisions are
taken by the business (Babalola and Abiola 2013).
Ratio Analysis 2018 2017 2016
Ratio Company:
Woolsworth Ltd Formula
Absol
ute
Absol
ute
Absol
ute
Catego
ry
$
Value
s
$
Value
s
$
Value
s
Liquidit
y
Current ratio
Current assets 7,181 7,121 7,427
Current liabilities 9,196 8,952 8,992
Ratio Ratio Ratio
0.78 0.80 0.83
Quick ratio
Highly liquid current assets 2,948 2,914 2,868
Current liabilities 9,196 8,952 8,992
(EXCLUDES INVENTORY AND
PREPAID ASSETS)
Ratio Ratio Ratio
0.32 0.33 0.32
Profitab
ility
Return on ordinary
shareholders' equity
Profit after tax 1,795 1,593 -2,348
Average ordinary shareholders' equity 10,849 9,876 9,876
Ratio Ratio Ratio
16.55
%
16.13
%
-
23.77
%
Return on assets
Profit after tax 1,795 1,593 -2,348
Total assets 23,558 23,043 23,502
Ratio Ratio Ratio
FINANCE FOR BUSINESS
The management of the company follows a low-cost model for the of keeping the
prices so that more customers can be attracted to the business. In this manner
as well, the business has built a brand loyalty for itself in the market.
The management of the company always follows innovative approach for the
purpose of appropriate meeting the needs of the customers and also for keeping
up with the level of competition in the market.
These approaches have made the business of Woolworths one of the leading
supermarket chains in the country. As per the current annual report of the company, the
management of the company is aiming to capture the grocery market by offering
grocery products at a cheaper price.
Ratio Analysis of the Business
Ratio analysis is a tool which is used by businesses for appropriately estimating
the performance of the business in the current year and comparing the performance if
the business with previous year. Ratio analysis allows the management of company to
identify the trends in the marker and on the basis of the same important decisions are
taken by the business (Babalola and Abiola 2013).
Ratio Analysis 2018 2017 2016
Ratio Company:
Woolsworth Ltd Formula
Absol
ute
Absol
ute
Absol
ute
Catego
ry
$
Value
s
$
Value
s
$
Value
s
Liquidit
y
Current ratio
Current assets 7,181 7,121 7,427
Current liabilities 9,196 8,952 8,992
Ratio Ratio Ratio
0.78 0.80 0.83
Quick ratio
Highly liquid current assets 2,948 2,914 2,868
Current liabilities 9,196 8,952 8,992
(EXCLUDES INVENTORY AND
PREPAID ASSETS)
Ratio Ratio Ratio
0.32 0.33 0.32
Profitab
ility
Return on ordinary
shareholders' equity
Profit after tax 1,795 1,593 -2,348
Average ordinary shareholders' equity 10,849 9,876 9,876
Ratio Ratio Ratio
16.55
%
16.13
%
-
23.77
%
Return on assets
Profit after tax 1,795 1,593 -2,348
Total assets 23,558 23,043 23,502
Ratio Ratio Ratio
Paraphrase This Document
Need a fresh take? Get an instant paraphrase of this document with our AI Paraphraser
4
FINANCE FOR BUSINESS
7.62% 6.91% -9.99%
Gross profit
rate/margin
Gross profit 16,709 15,929 15,125
Sales revenue 56,726 54,841 53,473
Ratio Ratio Ratio
29.46
%
29.05
%
28.29
%
Profit margin
Profit after tax 1,795 1,593 -2,348
Net Sales 56,726 54,841 53,473
Ratio Ratio Ratio
3.16% 2.90% -4.39%
Cash return on sales
Net operating cash flow 2,930 3,122 2,357
Net Sales 56,726 54,841 53,473
Ratio Ratio Ratio
5.165
%
5.693
%
4.408
%
Solvenc
y Debt to total assets
Total liabilities 12,709 13,167 14,720
Total assets 23,558 23,043 23,502
Ratio Ratio Ratio
53.95
%
57.14
%
62.63
%
Market
Earnings per share
(EPS)
Given Basic EPS disclosed in the
income statement
Ratio Ratio Ratio
123.40 110.80 -98.00
Price-earnings ratio
Share price 26.29 26.50 21.70
EPS 1.23 1.11 -0.98
Ratio Ratio Ratio
21 24 -22
Activity
Inventory turnover
Cost of sales 40,256 44,633 38,538
Inventory 4,233 4,207 4,559
Ratio Ratio Ratio
9.51 10.61 8.45
Average days in
inventory
365 365 365 365
Inventory turnover 9.51 10.61 8.45
Ratio Ratio Ratio
38 34 43
5
FINANCE FOR BUSINESS
Net Credit Sales 17,018 16,452 16,042
Average net receivables 801 745 763
Receivables turnover
Ratio Ratio Ratio
21.25 22.08 21.02
Average days
receivables
365 365 365 365
Receivables turnover 21.25 22.08 21.02
Ratio Ratio Ratio
17 17 17
Financi
ng Debt to Equity Debt/Equity 117% 133% 149%
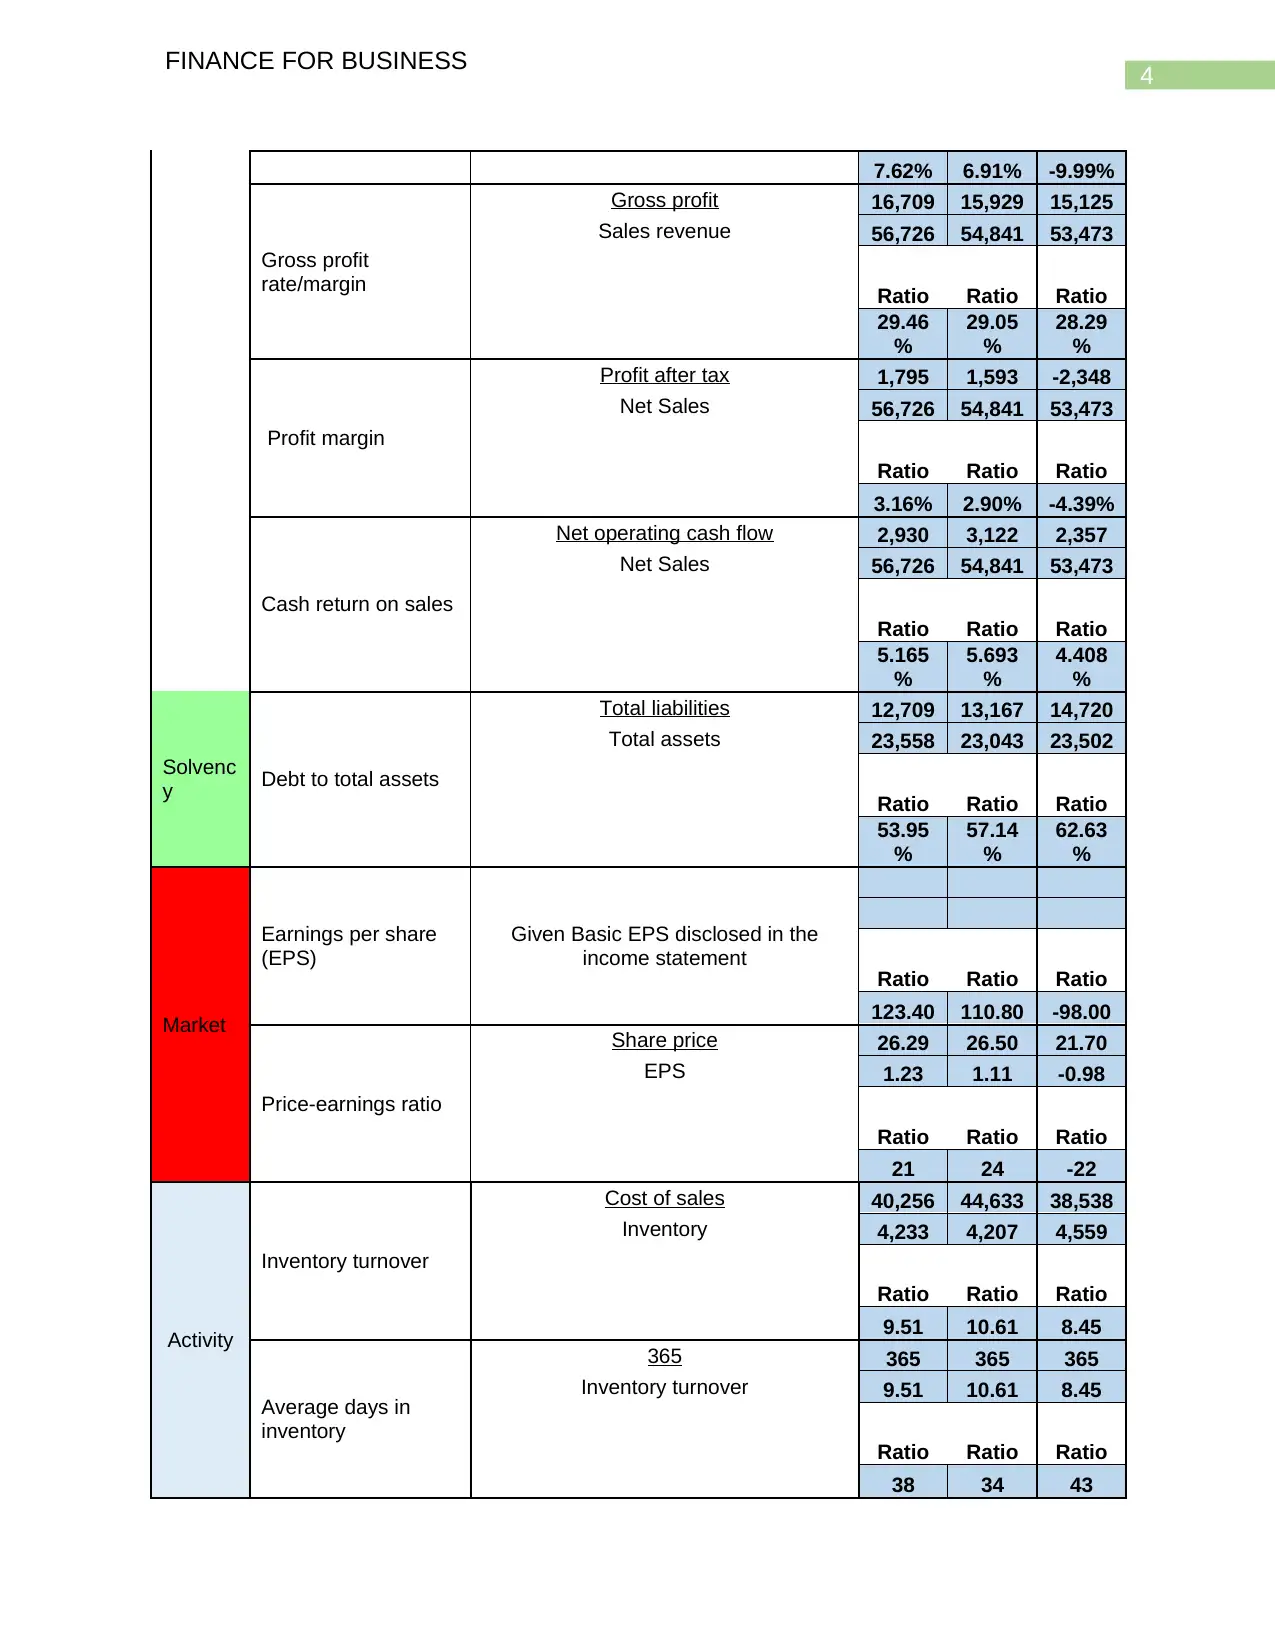
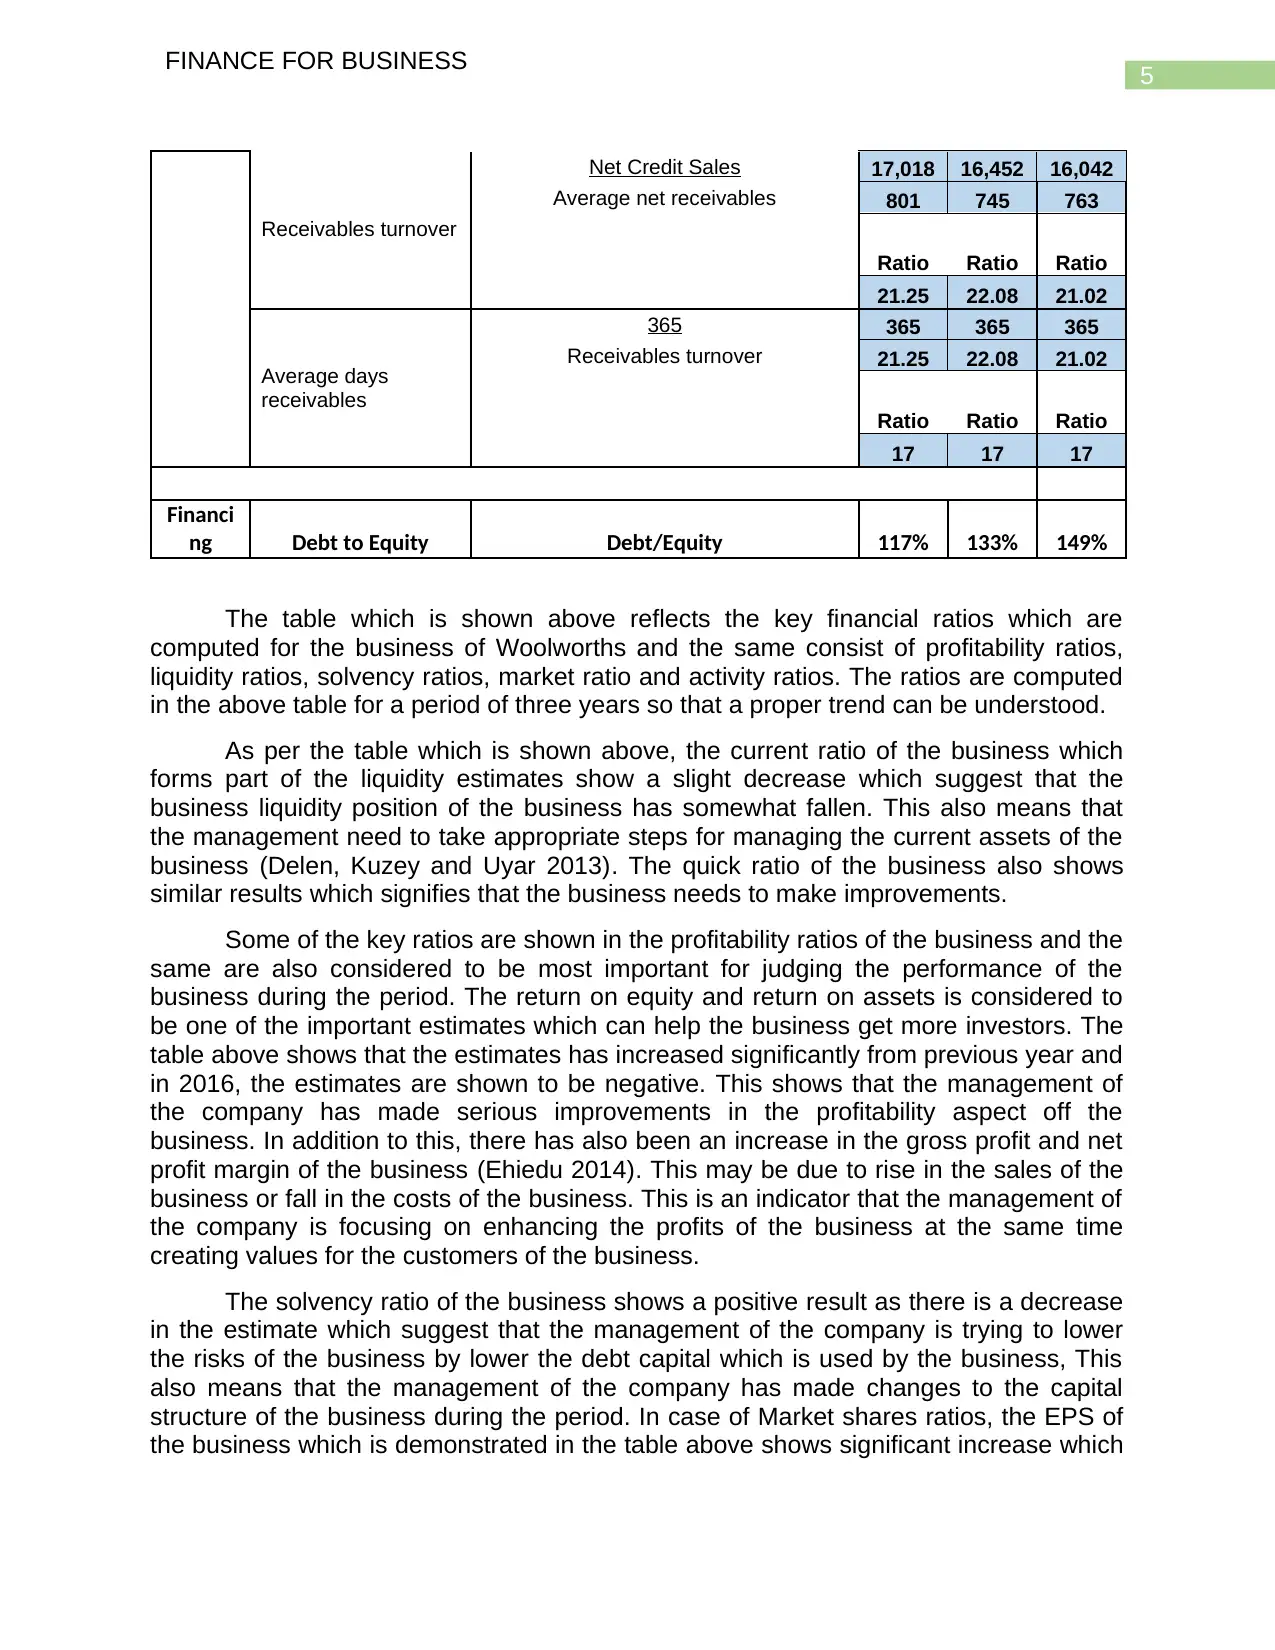
The table which is shown above reflects the key financial ratios which are
computed for the business of Woolworths and the same consist of profitability ratios,
liquidity ratios, solvency ratios, market ratio and activity ratios. The ratios are computed
in the above table for a period of three years so that a proper trend can be understood.
As per the table which is shown above, the current ratio of the business which
forms part of the liquidity estimates show a slight decrease which suggest that the
business liquidity position of the business has somewhat fallen. This also means that
the management need to take appropriate steps for managing the current assets of the
business (Delen, Kuzey and Uyar 2013). The quick ratio of the business also shows
similar results which signifies that the business needs to make improvements.
Some of the key ratios are shown in the profitability ratios of the business and the
same are also considered to be most important for judging the performance of the
business during the period. The return on equity and return on assets is considered to
be one of the important estimates which can help the business get more investors. The
table above shows that the estimates has increased significantly from previous year and
in 2016, the estimates are shown to be negative. This shows that the management of
the company has made serious improvements in the profitability aspect off the
business. In addition to this, there has also been an increase in the gross profit and net
profit margin of the business (Ehiedu 2014). This may be due to rise in the sales of the
business or fall in the costs of the business. This is an indicator that the management of
the company is focusing on enhancing the profits of the business at the same time
creating values for the customers of the business.
The solvency ratio of the business shows a positive result as there is a decrease
in the estimate which suggest that the management of the company is trying to lower
the risks of the business by lower the debt capital which is used by the business, This
also means that the management of the company has made changes to the capital
structure of the business during the period. In case of Market shares ratios, the EPS of
the business which is demonstrated in the table above shows significant increase which
FINANCE FOR BUSINESS
Net Credit Sales 17,018 16,452 16,042
Average net receivables 801 745 763
Receivables turnover
Ratio Ratio Ratio
21.25 22.08 21.02
Average days
receivables
365 365 365 365
Receivables turnover 21.25 22.08 21.02
Ratio Ratio Ratio
17 17 17
Financi
ng Debt to Equity Debt/Equity 117% 133% 149%
The table which is shown above reflects the key financial ratios which are
computed for the business of Woolworths and the same consist of profitability ratios,
liquidity ratios, solvency ratios, market ratio and activity ratios. The ratios are computed
in the above table for a period of three years so that a proper trend can be understood.
As per the table which is shown above, the current ratio of the business which
forms part of the liquidity estimates show a slight decrease which suggest that the
business liquidity position of the business has somewhat fallen. This also means that
the management need to take appropriate steps for managing the current assets of the
business (Delen, Kuzey and Uyar 2013). The quick ratio of the business also shows
similar results which signifies that the business needs to make improvements.
Some of the key ratios are shown in the profitability ratios of the business and the
same are also considered to be most important for judging the performance of the
business during the period. The return on equity and return on assets is considered to
be one of the important estimates which can help the business get more investors. The
table above shows that the estimates has increased significantly from previous year and
in 2016, the estimates are shown to be negative. This shows that the management of
the company has made serious improvements in the profitability aspect off the
business. In addition to this, there has also been an increase in the gross profit and net
profit margin of the business (Ehiedu 2014). This may be due to rise in the sales of the
business or fall in the costs of the business. This is an indicator that the management of
the company is focusing on enhancing the profits of the business at the same time
creating values for the customers of the business.
The solvency ratio of the business shows a positive result as there is a decrease
in the estimate which suggest that the management of the company is trying to lower
the risks of the business by lower the debt capital which is used by the business, This
also means that the management of the company has made changes to the capital
structure of the business during the period. In case of Market shares ratios, the EPS of
the business which is demonstrated in the table above shows significant increase which
⊘ This is a preview!⊘
Do you want full access?
Subscribe today to unlock all pages.
Trusted by 1+ million students worldwide
6
FINANCE FOR BUSINESS
may be due to the increase in the profits of the business. Therefore, it can be said that
the performance of the business in terms of profitability is quite appropriate.
The efficiency ratio of the business is represented by inventory turnover ratio and
receivables turnover ratio. The estimates which are computed in both the cases shows
that there is a fall in the estimates which is shown by the management which suggest
that there is a fall in the efficiency level of the business (Zaimah et al, 2013). The
efficiency ratios also show that the management of the company needs to make
appropriate changes in the business structure and internal policies of the business so
that the overall level of efficiency can be enhanced.
In an overall estimate, the management of the company is doing fine in terms of
profitability but the management needs to bring about changes in the liquidity structure
and efficiency structure of the business so that more revenue can be generated by the
business.
Cash Management Strategies
The cash management strategies need to be undertaken by the management of
Woolworths ltd so that the liquidity position of the business can be improved. As per the
annual report for the year 2018, the business has other financial assets and also has
sales agreement which would come under ordinary income. The management of the
company needs to identify the weaknesses which is present in the cash management
As per the notes to account section of the annual report, the management of the
company has derivatives which has increased in terms of value in 2018, This shows
that the management of the company in order to minimize the risks. In relation to
effective cash management the management of the company needs to formulate a
proper strategy for managing the risks as well as maintaining the liquidity of the
business.
Application of Sensitivity Analysis
The financial viability of the project could be well addressed with the help of the
various factors and points taken into consideration for the purpose of analysis. Capital
Budgeting like Net present value is the crucial investment evaluation process that is
used for assessing the overall valuation of the project investment that will be done by
the company. The project investment that will be done by the company involve a fixed
initial investment of $2 million which will be done for purchasing a machinery. The scrap
value of the machinery will be around $0.2 million which will be recovered at the end of
the fourth year of project investment (Harrison and Lock 2017). The working capital to
be taken into consideration for the purpose of analysis where an amount $0.6 million
would be treated as a cash inflow and the in the year 4 the same will be recovered. The
taxation rate remains the same as the cash flows for the company will be taxed at 30%
itself. Depreciation on the assets of the company would be charged on a straight line
basis and the same would be giving a tax shield to the company in the form of tax
deductible non-cash expense. The appropriate discount rate that would be charged for
discounting the cash flows would be the 10% rate.
Base Case Valuation: In the base case valuation the selling price of the units of goods
for the company would be done in the form 0.3 million of units sold respectively for
Paraphrase This Document
Need a fresh take? Get an instant paraphrase of this document with our AI Paraphraser
7
FINANCE FOR BUSINESS
every year and the selling price of the unit would be taken at $20 for the company. The
fixed cost for the company would be directly related to the various cash fixed expenses
that would be incurred by the company amounting to sum of $0.3 million. On the other
hand side the variable cost for the company would be around $12 in association with
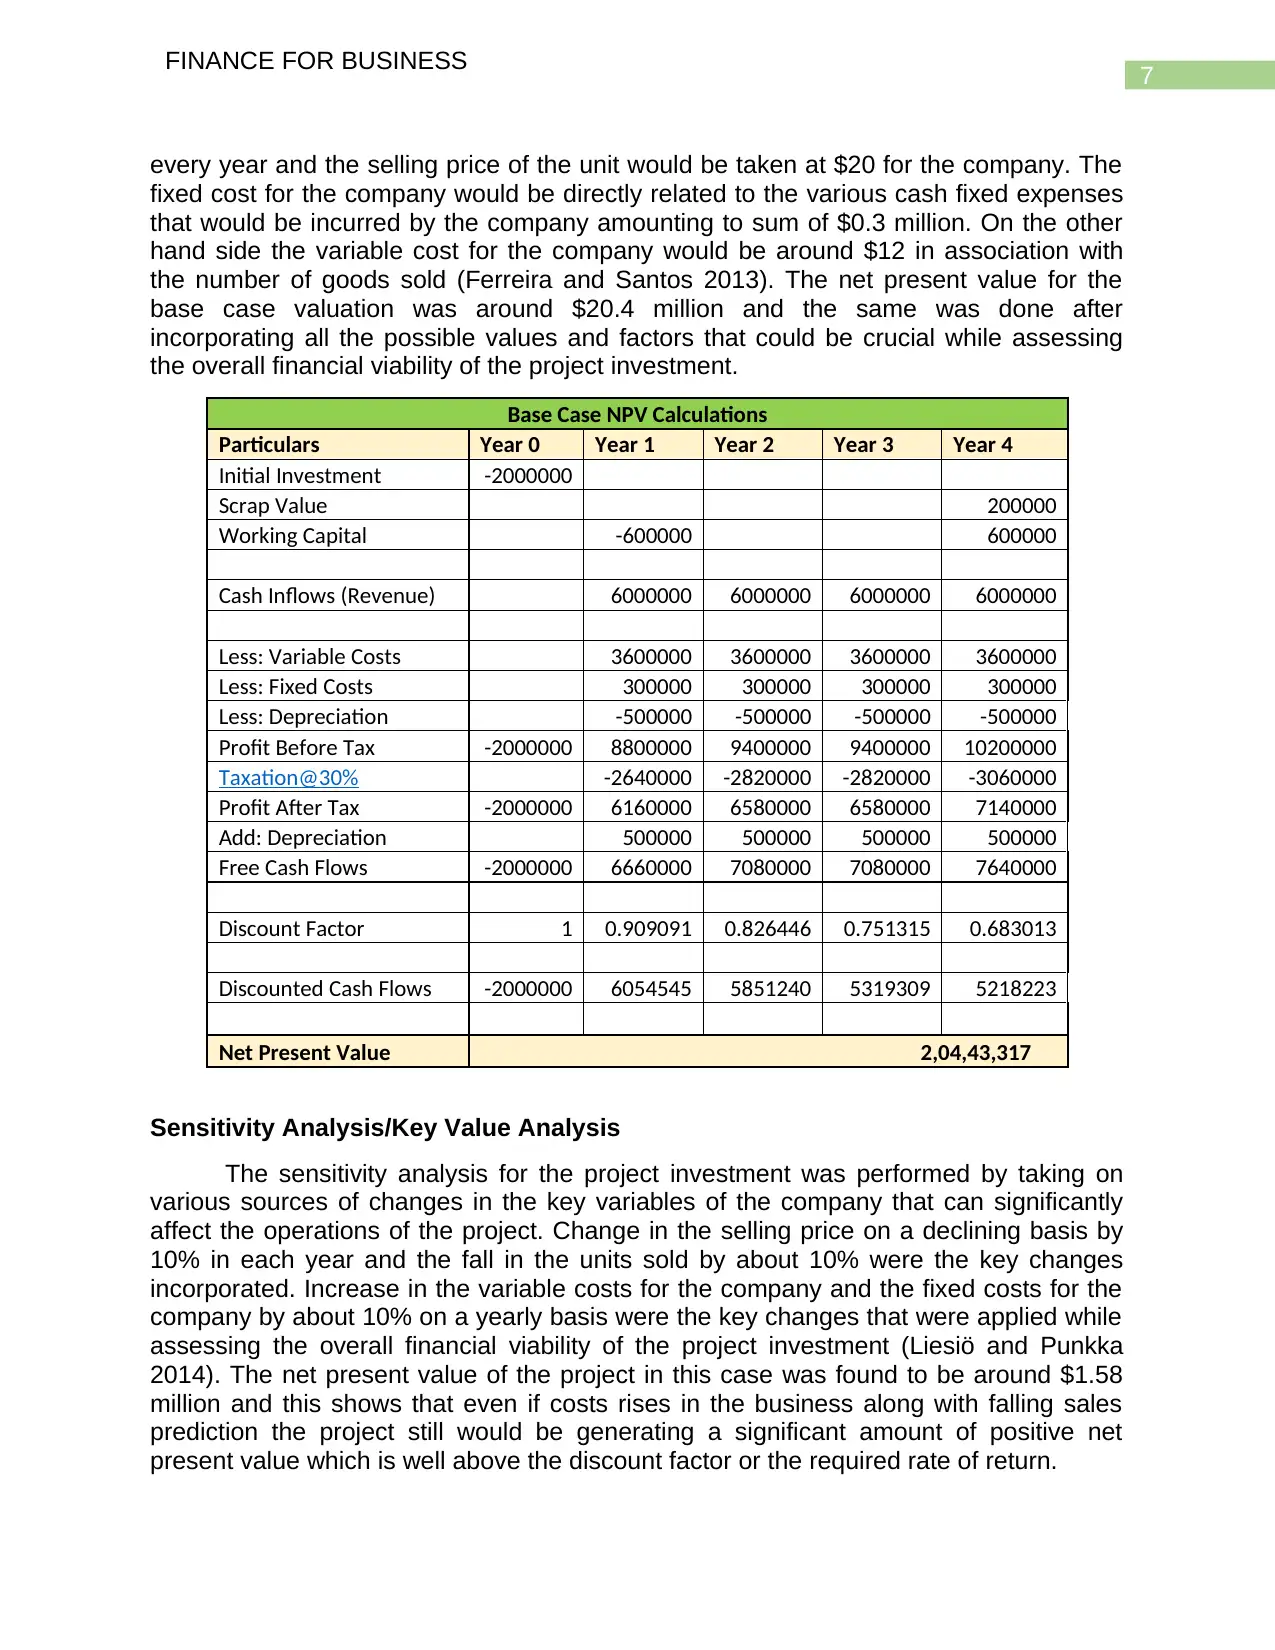
the number of goods sold (Ferreira and Santos 2013). The net present value for the
base case valuation was around $20.4 million and the same was done after
incorporating all the possible values and factors that could be crucial while assessing
the overall financial viability of the project investment.
Base Case NPV Calculations
Particulars Year 0 Year 1 Year 2 Year 3 Year 4
Initial Investment -2000000
Scrap Value 200000
Working Capital -600000 600000
Cash Inflows (Revenue) 6000000 6000000 6000000 6000000
Less: Variable Costs 3600000 3600000 3600000 3600000
Less: Fixed Costs 300000 300000 300000 300000
Less: Depreciation -500000 -500000 -500000 -500000
Profit Before Tax -2000000 8800000 9400000 9400000 10200000
Taxation@30% -2640000 -2820000 -2820000 -3060000
Profit After Tax -2000000 6160000 6580000 6580000 7140000
Add: Depreciation 500000 500000 500000 500000
Free Cash Flows -2000000 6660000 7080000 7080000 7640000
Discount Factor 1 0.909091 0.826446 0.751315 0.683013
Discounted Cash Flows -2000000 6054545 5851240 5319309 5218223
Net Present Value 2,04,43,317
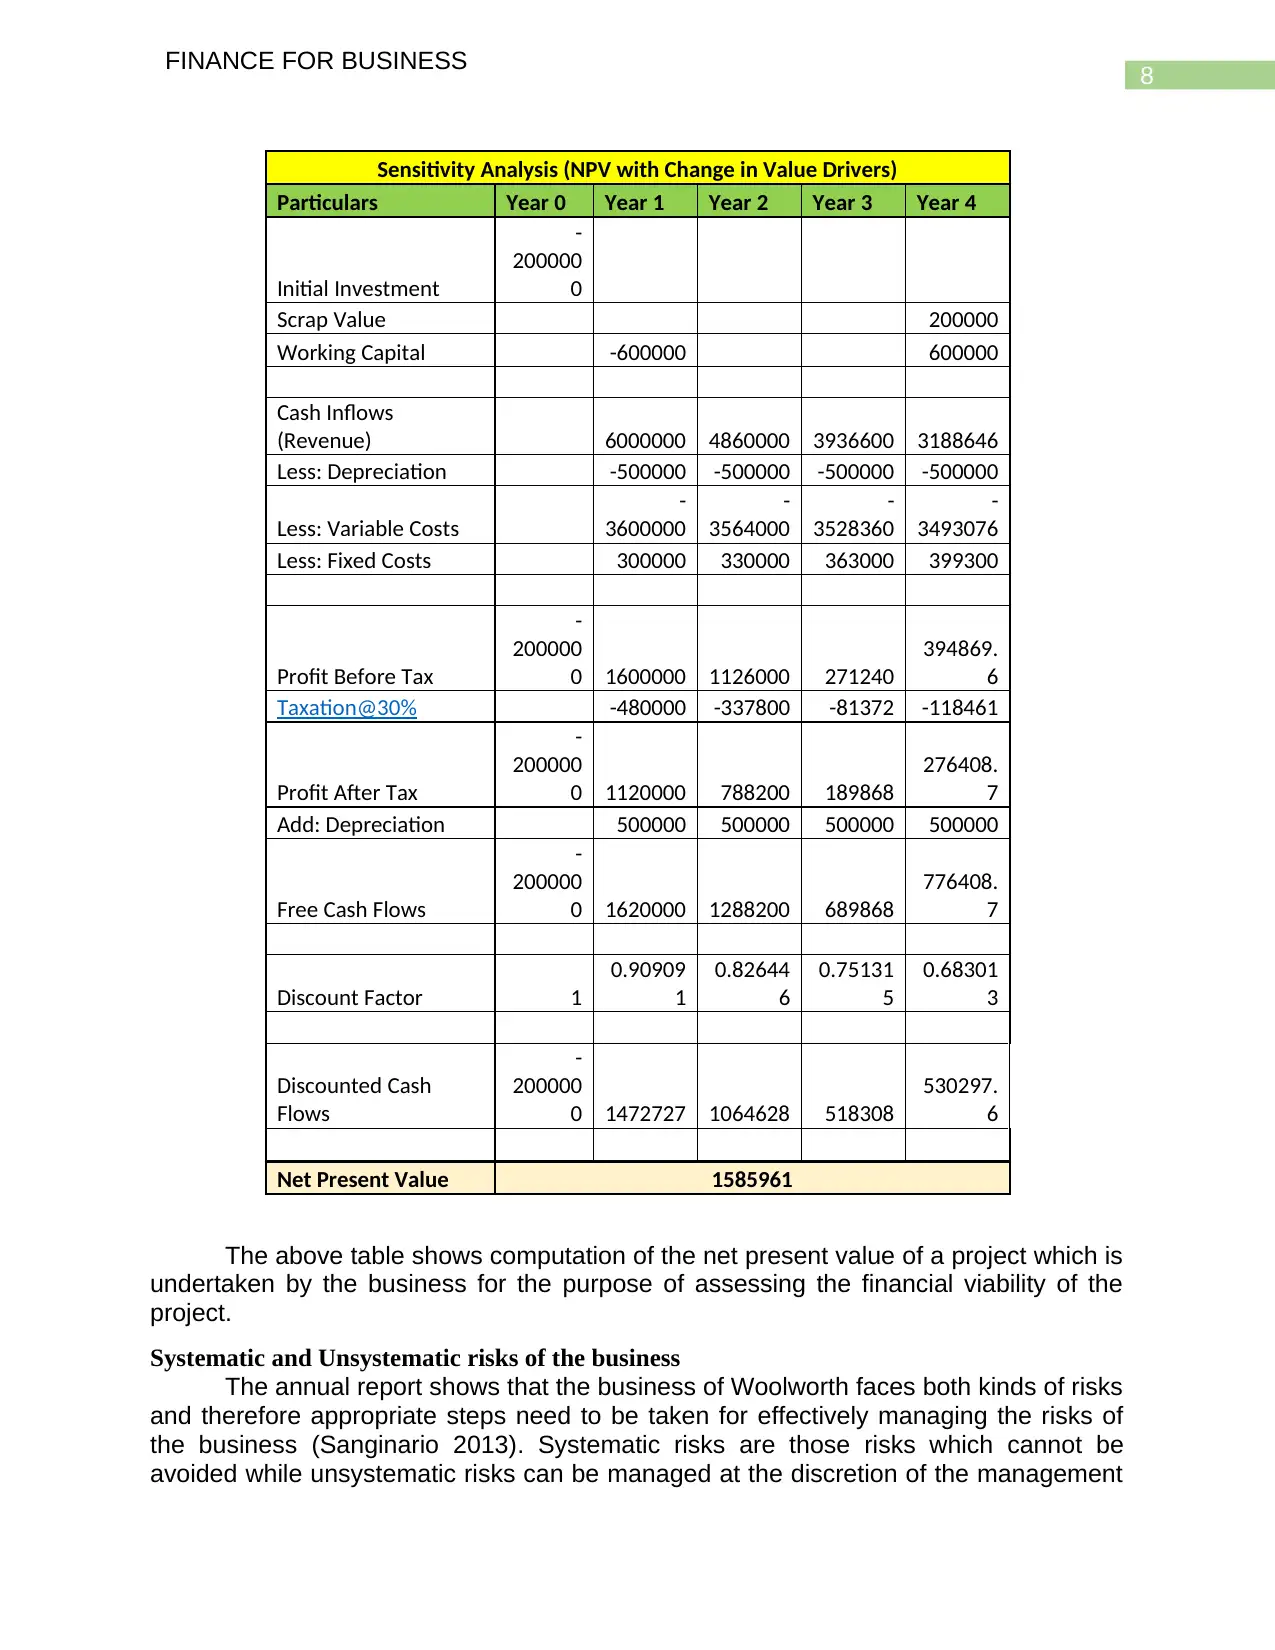
Sensitivity Analysis/Key Value Analysis
The sensitivity analysis for the project investment was performed by taking on
various sources of changes in the key variables of the company that can significantly
affect the operations of the project. Change in the selling price on a declining basis by
10% in each year and the fall in the units sold by about 10% were the key changes
incorporated. Increase in the variable costs for the company and the fixed costs for the
company by about 10% on a yearly basis were the key changes that were applied while
assessing the overall financial viability of the project investment (Liesiö and Punkka
2014). The net present value of the project in this case was found to be around $1.58
million and this shows that even if costs rises in the business along with falling sales
prediction the project still would be generating a significant amount of positive net
present value which is well above the discount factor or the required rate of return.
FINANCE FOR BUSINESS
every year and the selling price of the unit would be taken at $20 for the company. The
fixed cost for the company would be directly related to the various cash fixed expenses
that would be incurred by the company amounting to sum of $0.3 million. On the other
hand side the variable cost for the company would be around $12 in association with
the number of goods sold (Ferreira and Santos 2013). The net present value for the
base case valuation was around $20.4 million and the same was done after
incorporating all the possible values and factors that could be crucial while assessing
the overall financial viability of the project investment.
Base Case NPV Calculations
Particulars Year 0 Year 1 Year 2 Year 3 Year 4
Initial Investment -2000000
Scrap Value 200000
Working Capital -600000 600000
Cash Inflows (Revenue) 6000000 6000000 6000000 6000000
Less: Variable Costs 3600000 3600000 3600000 3600000
Less: Fixed Costs 300000 300000 300000 300000
Less: Depreciation -500000 -500000 -500000 -500000
Profit Before Tax -2000000 8800000 9400000 9400000 10200000
Taxation@30% -2640000 -2820000 -2820000 -3060000
Profit After Tax -2000000 6160000 6580000 6580000 7140000
Add: Depreciation 500000 500000 500000 500000
Free Cash Flows -2000000 6660000 7080000 7080000 7640000
Discount Factor 1 0.909091 0.826446 0.751315 0.683013
Discounted Cash Flows -2000000 6054545 5851240 5319309 5218223
Net Present Value 2,04,43,317
Sensitivity Analysis/Key Value Analysis
The sensitivity analysis for the project investment was performed by taking on
various sources of changes in the key variables of the company that can significantly
affect the operations of the project. Change in the selling price on a declining basis by
10% in each year and the fall in the units sold by about 10% were the key changes
incorporated. Increase in the variable costs for the company and the fixed costs for the
company by about 10% on a yearly basis were the key changes that were applied while
assessing the overall financial viability of the project investment (Liesiö and Punkka
2014). The net present value of the project in this case was found to be around $1.58
million and this shows that even if costs rises in the business along with falling sales
prediction the project still would be generating a significant amount of positive net
present value which is well above the discount factor or the required rate of return.
8
FINANCE FOR BUSINESS
Sensitivity Analysis (NPV with Change in Value Drivers)
Particulars Year 0 Year 1 Year 2 Year 3 Year 4
Initial Investment
-
200000
0
Scrap Value 200000
Working Capital -600000 600000
Cash Inflows
(Revenue) 6000000 4860000 3936600 3188646
Less: Depreciation -500000 -500000 -500000 -500000
Less: Variable Costs
-
3600000
-
3564000
-
3528360
-
3493076
Less: Fixed Costs 300000 330000 363000 399300
Profit Before Tax
-
200000
0 1600000 1126000 271240
394869.
6
Taxation@30% -480000 -337800 -81372 -118461
Profit After Tax
-
200000
0 1120000 788200 189868
276408.
7
Add: Depreciation 500000 500000 500000 500000
Free Cash Flows
-
200000
0 1620000 1288200 689868
776408.
7
Discount Factor 1
0.90909
1
0.82644
6
0.75131
5
0.68301
3
Discounted Cash
Flows
-
200000
0 1472727 1064628 518308
530297.
6
Net Present Value 1585961
The above table shows computation of the net present value of a project which is
undertaken by the business for the purpose of assessing the financial viability of the
project.
Systematic and Unsystematic risks of the business
The annual report shows that the business of Woolworth faces both kinds of risks
and therefore appropriate steps need to be taken for effectively managing the risks of
the business (Sanginario 2013). Systematic risks are those risks which cannot be
avoided while unsystematic risks can be managed at the discretion of the management
⊘ This is a preview!⊘
Do you want full access?
Subscribe today to unlock all pages.
Trusted by 1+ million students worldwide
9
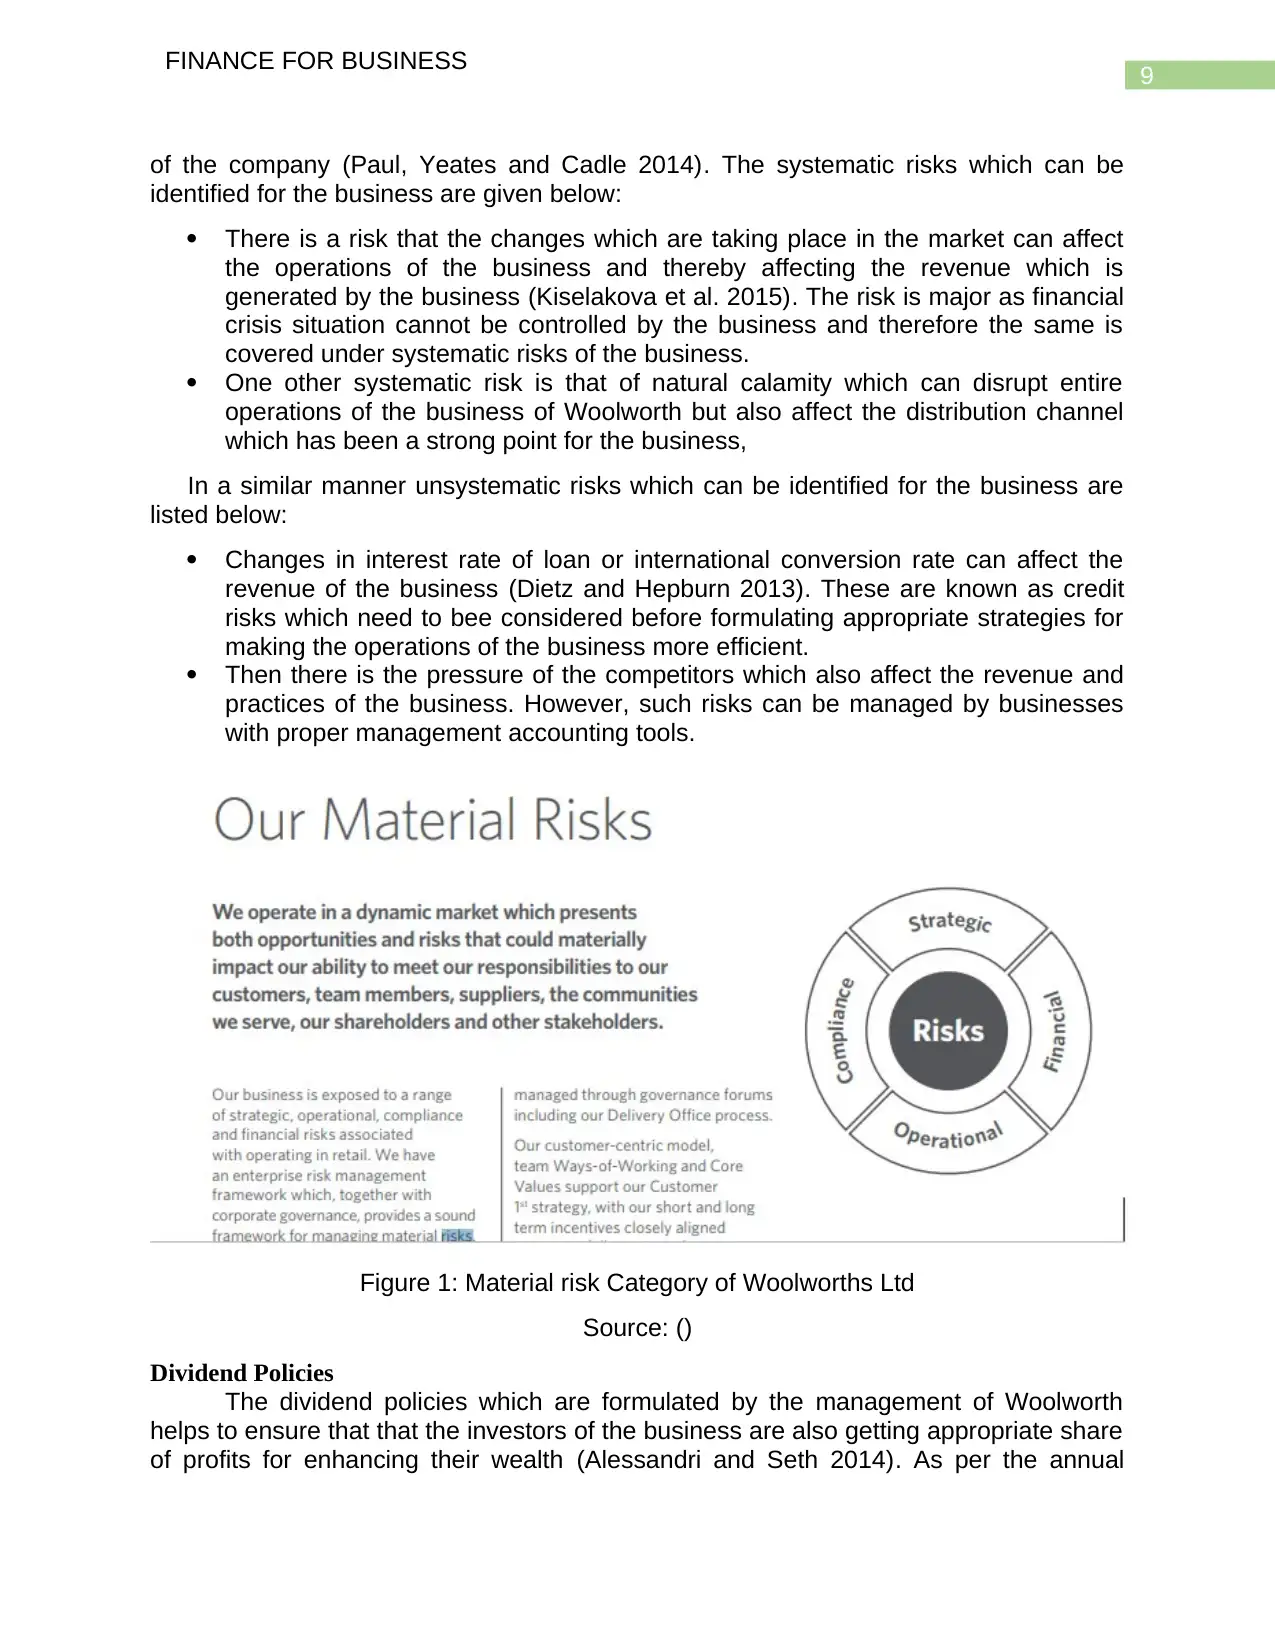
FINANCE FOR BUSINESS
of the company (Paul, Yeates and Cadle 2014). The systematic risks which can be
identified for the business are given below:
There is a risk that the changes which are taking place in the market can affect
the operations of the business and thereby affecting the revenue which is
generated by the business (Kiselakova et al. 2015). The risk is major as financial
crisis situation cannot be controlled by the business and therefore the same is
covered under systematic risks of the business.
One other systematic risk is that of natural calamity which can disrupt entire
operations of the business of Woolworth but also affect the distribution channel
which has been a strong point for the business,
In a similar manner unsystematic risks which can be identified for the business are
listed below:
Changes in interest rate of loan or international conversion rate can affect the
revenue of the business (Dietz and Hepburn 2013). These are known as credit
risks which need to bee considered before formulating appropriate strategies for
making the operations of the business more efficient.
Then there is the pressure of the competitors which also affect the revenue and
practices of the business. However, such risks can be managed by businesses
with proper management accounting tools.
Figure 1: Material risk Category of Woolworths Ltd
Source: ()
Dividend Policies
The dividend policies which are formulated by the management of Woolworth
helps to ensure that that the investors of the business are also getting appropriate share
of profits for enhancing their wealth (Alessandri and Seth 2014). As per the annual
Paraphrase This Document
Need a fresh take? Get an instant paraphrase of this document with our AI Paraphraser
10
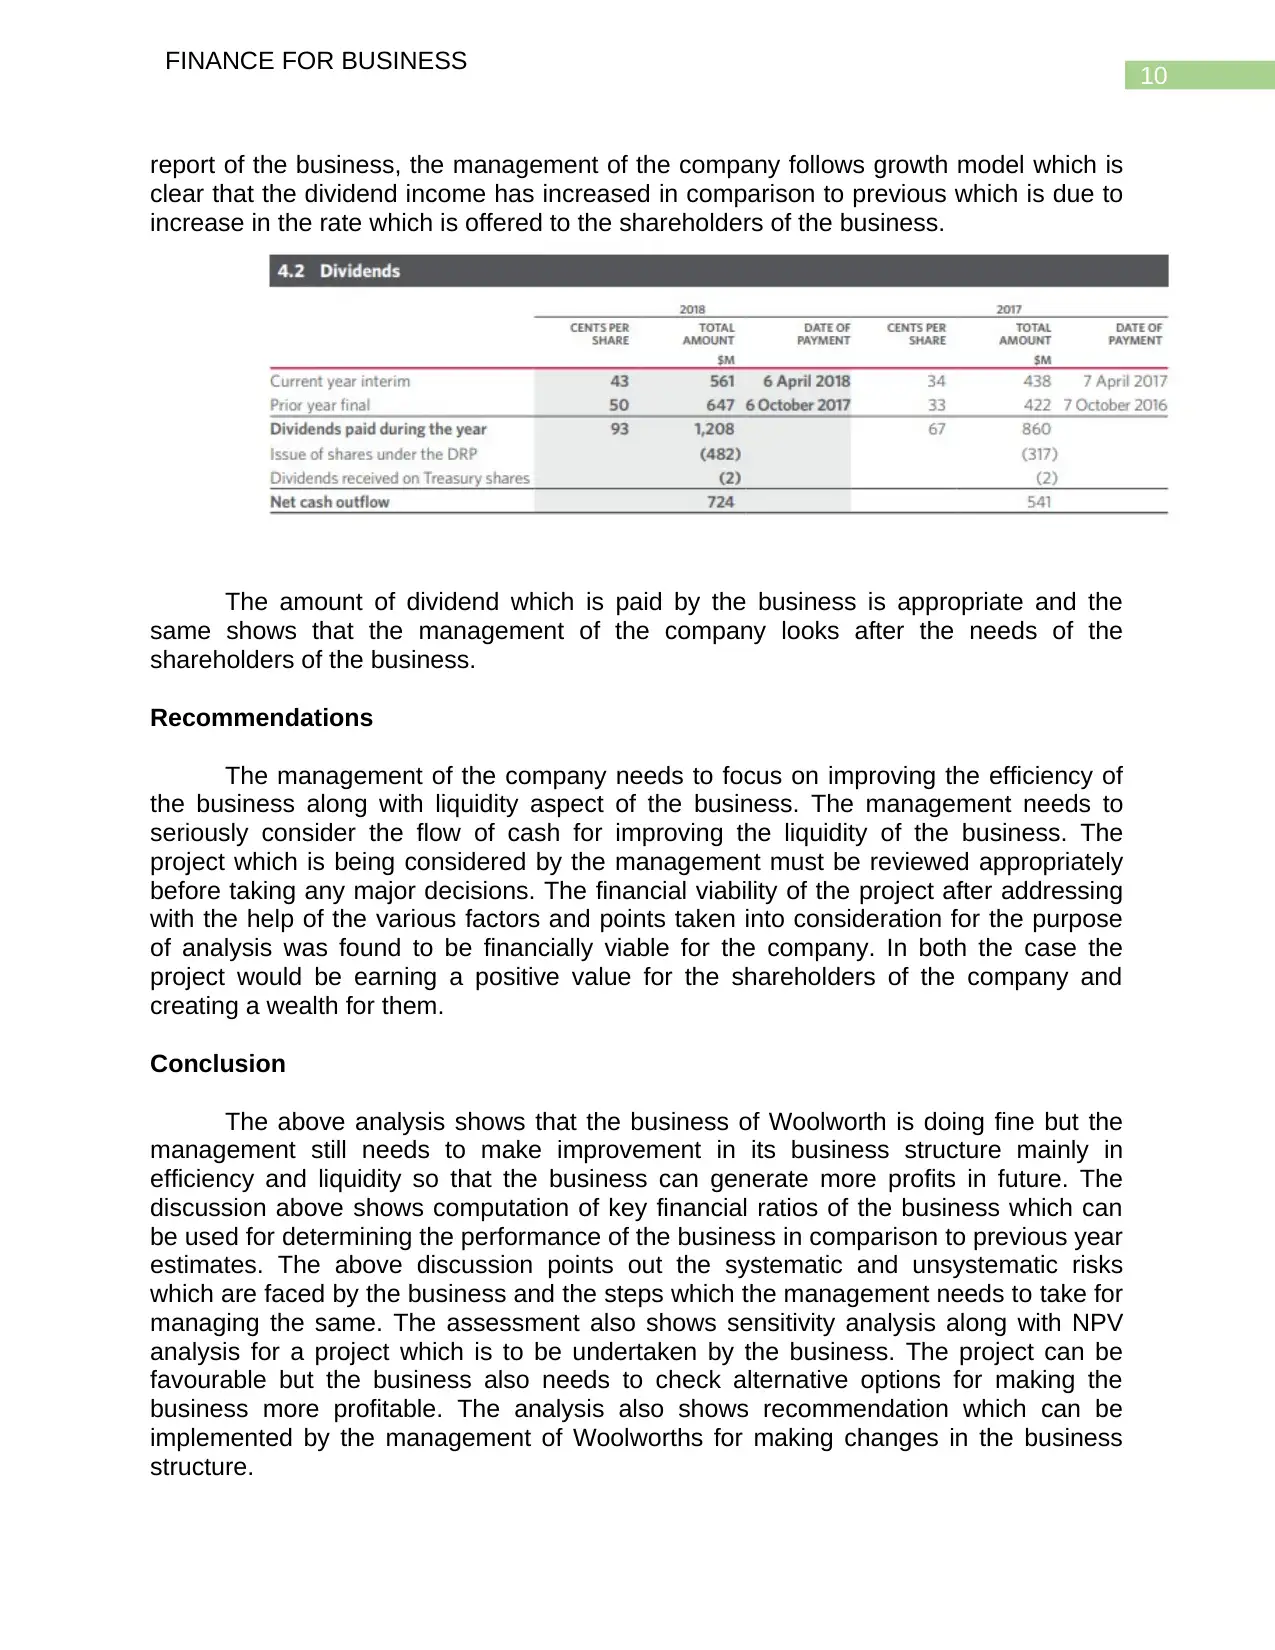
FINANCE FOR BUSINESS
report of the business, the management of the company follows growth model which is
clear that the dividend income has increased in comparison to previous which is due to
increase in the rate which is offered to the shareholders of the business.
The amount of dividend which is paid by the business is appropriate and the
same shows that the management of the company looks after the needs of the
shareholders of the business.
Recommendations
The management of the company needs to focus on improving the efficiency of
the business along with liquidity aspect of the business. The management needs to
seriously consider the flow of cash for improving the liquidity of the business. The
project which is being considered by the management must be reviewed appropriately
before taking any major decisions. The financial viability of the project after addressing
with the help of the various factors and points taken into consideration for the purpose
of analysis was found to be financially viable for the company. In both the case the
project would be earning a positive value for the shareholders of the company and
creating a wealth for them.
Conclusion
The above analysis shows that the business of Woolworth is doing fine but the
management still needs to make improvement in its business structure mainly in
efficiency and liquidity so that the business can generate more profits in future. The
discussion above shows computation of key financial ratios of the business which can
be used for determining the performance of the business in comparison to previous year
estimates. The above discussion points out the systematic and unsystematic risks
which are faced by the business and the steps which the management needs to take for
managing the same. The assessment also shows sensitivity analysis along with NPV
analysis for a project which is to be undertaken by the business. The project can be
favourable but the business also needs to check alternative options for making the
business more profitable. The analysis also shows recommendation which can be
implemented by the management of Woolworths for making changes in the business
structure.
11
FINANCE FOR BUSINESS
Reference
Alessandri, T.M. and Seth, A., 2014. The effects of managerial ownership on
international and business diversification: Balancing incentives and risks. Strategic
Management Journal, 35(13), pp.2064-2075.
Babalola, Y.A. and Abiola, F.R., 2013. Financial ratio analysis of firms: A tool for
decision making. International journal of management sciences, 1(4), pp.132-137.
Delen, D., Kuzey, C. and Uyar, A., 2013. Measuring firm performance using financial
ratios: A decision tree approach. Expert Systems with Applications, 40(10), pp.3970-
3983.
Dietz, S. and Hepburn, C., 2013. Benefit–cost analysis of non-marginal climate and
energy projects. Energy Economics, 40, pp.61-71.
Ehiedu, V.C., 2014. The impact of liquidity on profitability of some selected companies:
the financial statement analysis (FSA) approach. Research Journal of Finance and
Accounting, 5(5), pp.81-90.
Ferreira, A. and Santos, J., 2013. Life-cycle cost analysis system for pavement
management at project level: sensitivity analysis to the discount rate. International
Journal of Pavement Engineering, 14(7), pp.655-673.
Harrison, F. and Lock, D., 2017. Advanced project management: a structured approach.
Routledge.
Kiselakova, D., Horvathova, J., Sofrankova, B. and Soltes, M., 2015. Analysis of risks
and their impact on enterprise performance by creating Enterprise Risk Model. Polish
Journal of Management Studies, 11.
Liesiö, J. and Punkka, A., 2014. Baseline value specification and sensitivity analysis in
multiattribute project portfolio selection. European Journal of Operational
Research, 237(3), pp.946-956.
Paul, D., Yeates, D. and Cadle, J. eds., 2014. Business analysis. BCS, The Chartered
Institute for IT.
Sanginario, K.J., 2013. The valuation business: A strategic road map for success. A
professional development journal for the consulting disciplines, pp.20-28.
Woolworthsgroup.com.au. (2019). [online] Available at:
https://www.woolworthsgroup.com.au/icms_docs/195396_annual-report-2018.pdf
[Accessed 30 May 2019].
Zaimah, R., Masud, J., Haron, S.A., Othman, M., Awang, A.H. and Sarmila, M.D., 2013.
Financial well-being: Financial ratio analysis of married public sector workers in
Malaysia. Asian Social Science, 9(14), p.1.
⊘ This is a preview!⊘
Do you want full access?
Subscribe today to unlock all pages.
Trusted by 1+ million students worldwide
1 out of 12
Related Documents


Your All-in-One AI-Powered Toolkit for Academic Success.
+13062052269
info@desklib.com
Available 24*7 on WhatsApp / Email
![[object Object]](/_next/static/media/star-bottom.7253800d.svg)
Unlock your academic potential
Copyright © 2020–2026 A2Z Services. All Rights Reserved. Developed and managed by ZUCOL.