HI5002 - Financial Performance Analysis & Investment Advice Report
VerifiedAdded on 2023/06/12
|18
|3717
|225
Report
AI Summary
This report provides a financial analysis of Emergent Resources Limited (EMG.AX), an iron ore exploration company listed on the ASX, to provide investment advice. It analyzes the company's financial performance using data from 2016 and 2017, focusing on liquidity, profitability, efficiency, and stock market performance. Key financial ratios are computed and analyzed, including short-term and long-term solvency, asset utilization, profitability, and market value ratios. The report also examines the movement in monthly share prices compared to the All Ordinaries Index (^AORD), identifies factors influencing the share price, and calculates the company's beta and expected rate of return using the CAPM model. The analysis concludes that, based on the current financial performance, a conservative investment in Emergent Resources is not recommended due to the company's financial instability and poor performance indicators.
Running head: FINANCE FOR BUSINESS
Finance for Business
Name of the Student
Name of the University
Authors Note
Course ID
Finance for Business
Name of the Student
Name of the University
Authors Note
Course ID
Paraphrase This Document
Need a fresh take? Get an instant paraphrase of this document with our AI Paraphraser
1
Table of Contents
Introduction:...............................................................................................................................3
Description of Company:...........................................................................................................3
Ownership and structure of governance of the company:..........................................................4
Main Substantial Shareholders:..............................................................................................4
Main people involved in Company’s Governance:................................................................5
Computation of Fundamental Ratios:........................................................................................6
Short Term Solvency:............................................................................................................6
Long Term Solvency:.............................................................................................................7
Asset Utilization:....................................................................................................................7
Profitability Ratios:................................................................................................................7
Market Value Ratios:.............................................................................................................8
Graphical Descriptions of Results:.............................................................................................9
Movement in Monthly Share Price:.......................................................................................9
Comparative Analysis of Movement in Share Price Index to All Ords Index:..........................9
Identifications of factors that influences the share price of the company:...........................10
Calculations of Beta and the Expected Rate of Returns using CAPM:...................................11
Computed Beta of the Company:.........................................................................................11
Calculations of the required rate of Return using CAPM Model:.......................................11
Justification behind the “Conservative Investment”............................................................12
Explanation of WACC has on management evaluation of investment prospective:...............13
Debt Ratio:...............................................................................................................................14
Dividend policy:.......................................................................................................................14
Letter of Recommendations.....................................................................................................14
Conclusion:..............................................................................................................................15
References................................................................................................................................16
2
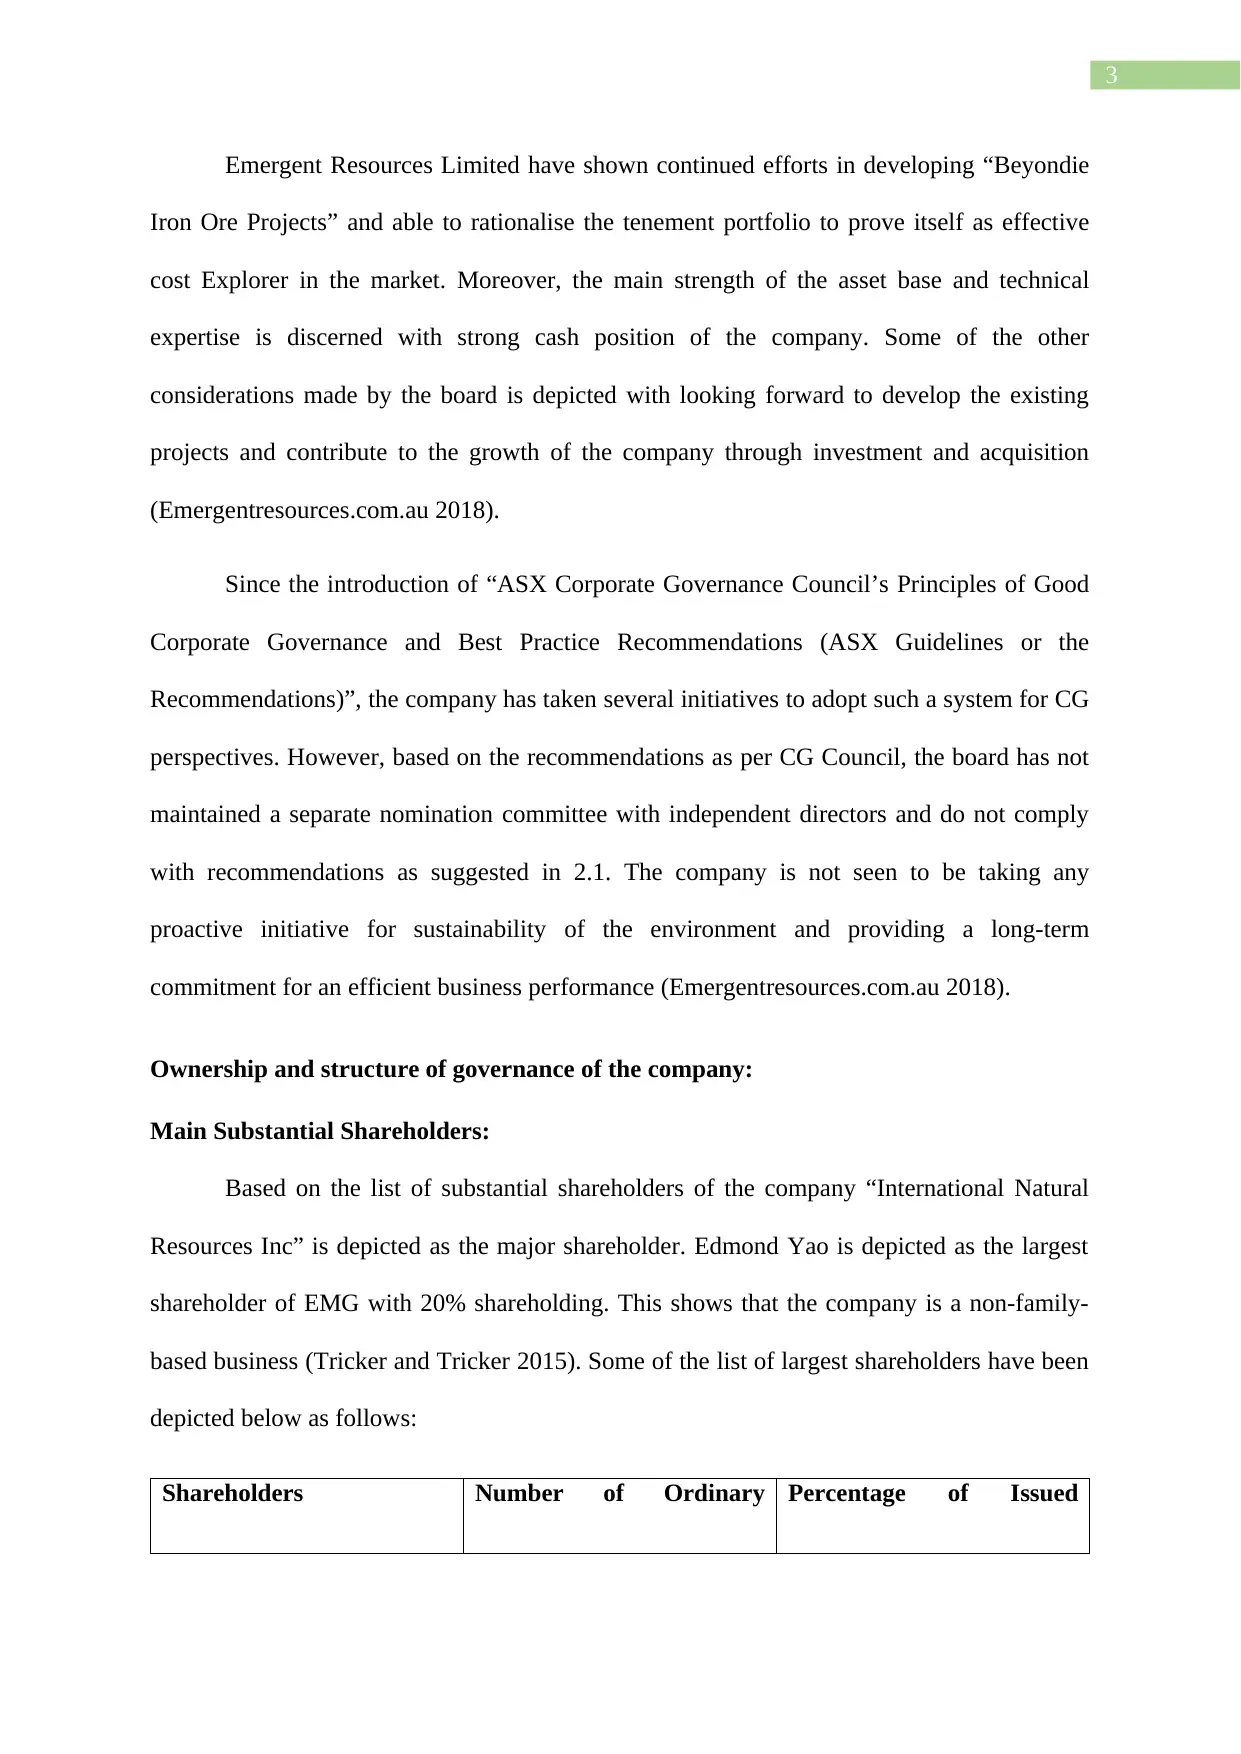
Introduction:
The important learnings from the study have analysed the financial perspectives of
Emergent Resources Limited and prepared a financial advisory report. Emergent resources
Ltd is identified as an iron ore exploration and mining company listed under ASX with the
code EMG.AX. The main depictions of financial performance have been taken into account
with stock market performance and depiction of other financial areas such as liquidity,
profitability and efficiency.
The competition of the common financial ratios is performed by considering the
excerpts from the financial reports published in 2017 and 2016. The analysis of the share
price movement is considered with the change in closing share price of the company in the
last two years and compared the same with changes with ^AORD index. The important
understanding of capital structure has been taken into account with “weighted average cost of
capital” which is conducive for suggesting the rationale for investment decision. In addition
to this the consideration of solvency ratios along with dividend policy structure is also
evaluated for investing in the shares of the company (Emergentresources.com.au 2018).
Description of Company:
Emergent Resources Limited was inaugurated in 2007 at Subiaco, Australia. The
company is depicted to engage in exploration activities related to “iron, base metal, and
precious metal properties” in various regions of Western Australia. The Company's
“Beyondie Iron Project is located adjacent to the Great Northern Highway and Goldfields
Gas Pipeline in the northern part of Western Australia's mid-west iron ore precinct”.
Emergent Resources Limited is also depicted to explore manganese and vanadium deposits. It
has been further discerned to comprise “E52/2215 iron-ore tenement” with more than 46
blocks covering an area of “142 km2 located in Western Australia”. The company is listed
under ASX with the code EMG.AX.
⊘ This is a preview!⊘
Do you want full access?
Subscribe today to unlock all pages.
Trusted by 1+ million students worldwide
3
Emergent Resources Limited have shown continued efforts in developing “Beyondie
Iron Ore Projects” and able to rationalise the tenement portfolio to prove itself as effective
cost Explorer in the market. Moreover, the main strength of the asset base and technical
expertise is discerned with strong cash position of the company. Some of the other
considerations made by the board is depicted with looking forward to develop the existing
projects and contribute to the growth of the company through investment and acquisition
(Emergentresources.com.au 2018).
Since the introduction of “ASX Corporate Governance Council’s Principles of Good
Corporate Governance and Best Practice Recommendations (ASX Guidelines or the
Recommendations)”, the company has taken several initiatives to adopt such a system for CG
perspectives. However, based on the recommendations as per CG Council, the board has not
maintained a separate nomination committee with independent directors and do not comply
with recommendations as suggested in 2.1. The company is not seen to be taking any
proactive initiative for sustainability of the environment and providing a long-term
commitment for an efficient business performance (Emergentresources.com.au 2018).
Ownership and structure of governance of the company:
Main Substantial Shareholders:
Based on the list of substantial shareholders of the company “International Natural
Resources Inc” is depicted as the major shareholder. Edmond Yao is depicted as the largest
shareholder of EMG with 20% shareholding. This shows that the company is a non-family-
based business (Tricker and Tricker 2015). Some of the list of largest shareholders have been
depicted below as follows:
Shareholders Number of Ordinary Percentage of Issued
Paraphrase This Document
Need a fresh take? Get an instant paraphrase of this document with our AI Paraphraser
4
Shares Held Capital
“International Natural
Resources Inc”
25150000 11.08%
“International Natural
Resources Inc”
20244609 8.92%
“Advanced Endeavor
Enterprises Limited”
20000000 8.81%
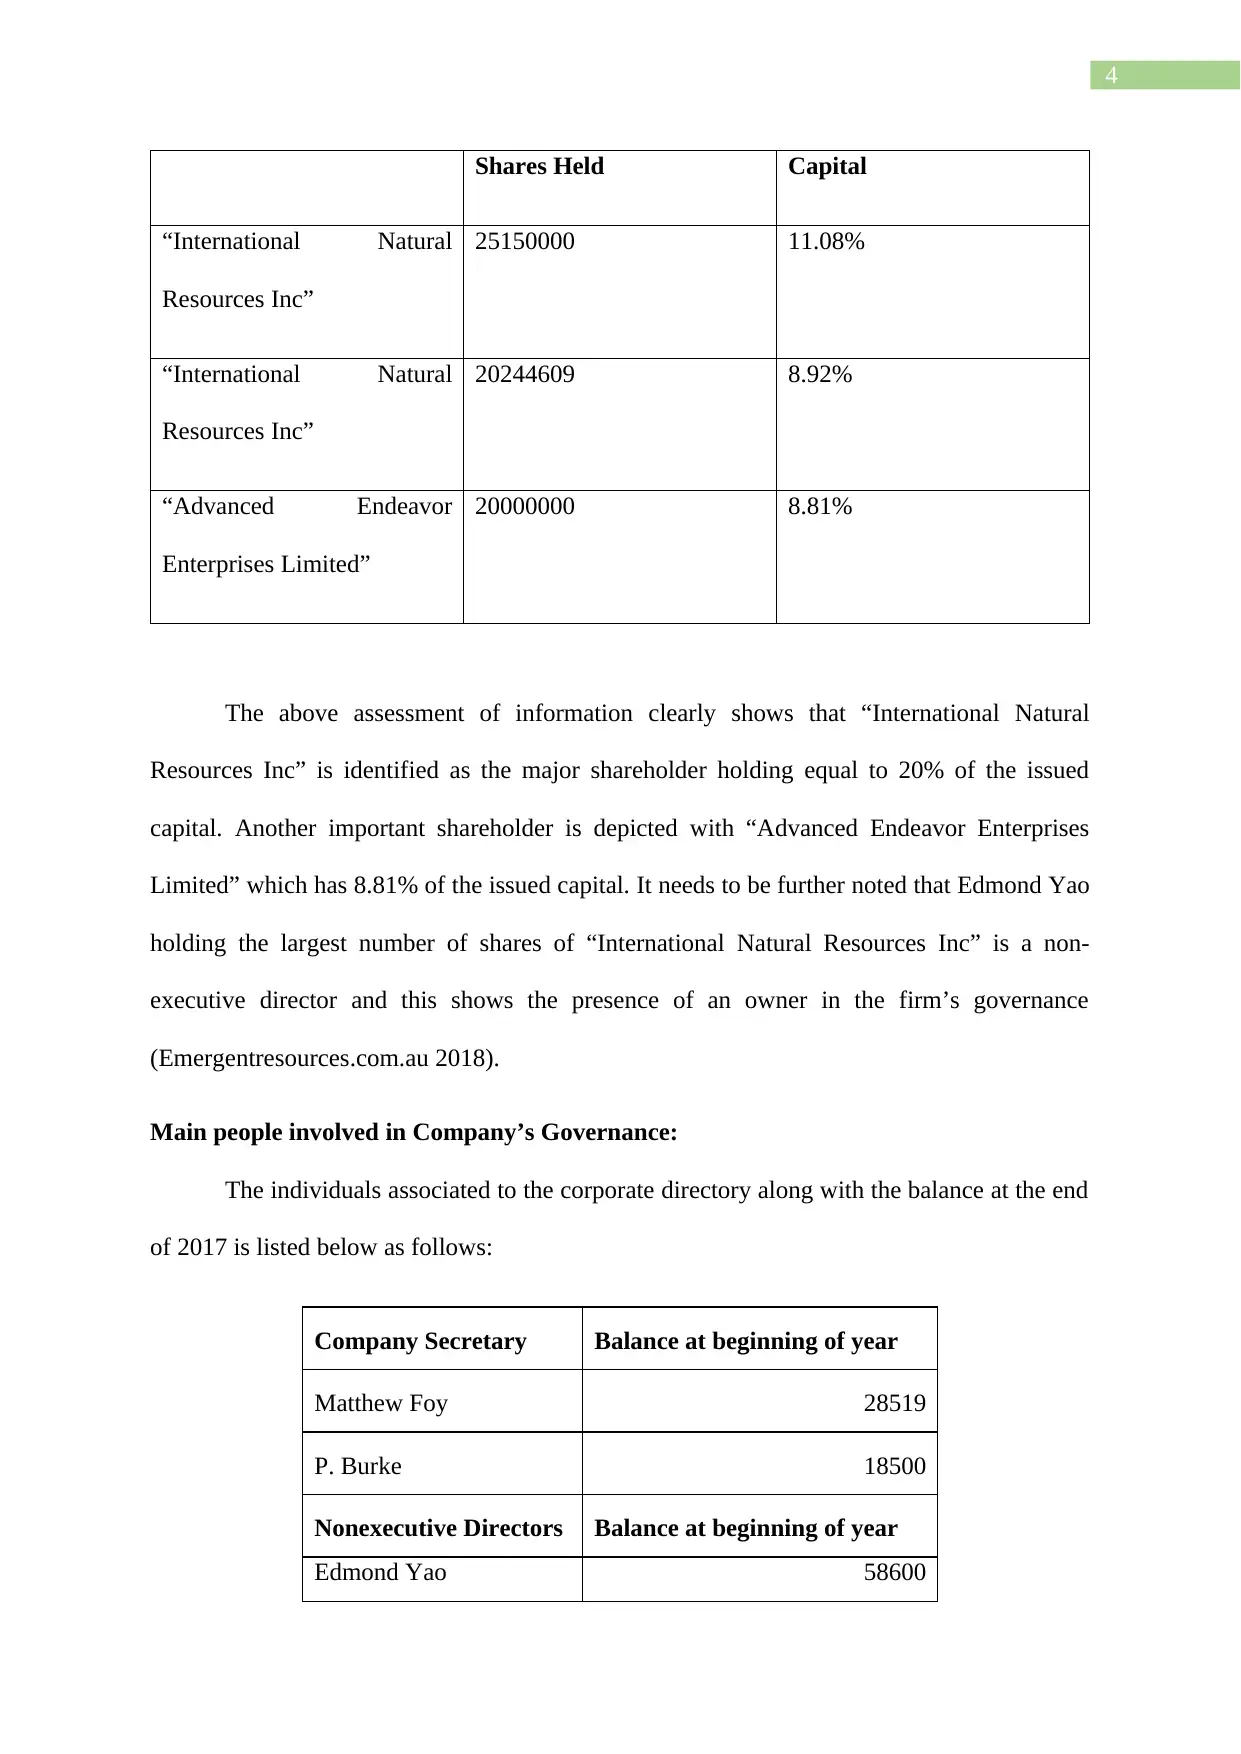
The above assessment of information clearly shows that “International Natural
Resources Inc” is identified as the major shareholder holding equal to 20% of the issued
capital. Another important shareholder is depicted with “Advanced Endeavor Enterprises
Limited” which has 8.81% of the issued capital. It needs to be further noted that Edmond Yao
holding the largest number of shares of “International Natural Resources Inc” is a non-
executive director and this shows the presence of an owner in the firm’s governance
(Emergentresources.com.au 2018).
Main people involved in Company’s Governance:
The individuals associated to the corporate directory along with the balance at the end
of 2017 is listed below as follows:
Company Secretary Balance at beginning of year
Matthew Foy 28519
P. Burke 18500
Nonexecutive Directors Balance at beginning of year
Edmond Yao 58600
Shares Held Capital
“International Natural
Resources Inc”
25150000 11.08%
“International Natural
Resources Inc”
20244609 8.92%
“Advanced Endeavor
Enterprises Limited”
20000000 8.81%
The above assessment of information clearly shows that “International Natural
Resources Inc” is identified as the major shareholder holding equal to 20% of the issued
capital. Another important shareholder is depicted with “Advanced Endeavor Enterprises
Limited” which has 8.81% of the issued capital. It needs to be further noted that Edmond Yao
holding the largest number of shares of “International Natural Resources Inc” is a non-
executive director and this shows the presence of an owner in the firm’s governance
(Emergentresources.com.au 2018).
Main people involved in Company’s Governance:
The individuals associated to the corporate directory along with the balance at the end
of 2017 is listed below as follows:
Company Secretary Balance at beginning of year
Matthew Foy 28519
P. Burke 18500
Nonexecutive Directors Balance at beginning of year
Edmond Yao 58600
5
Bevan Tarratt 64110
Jian-Hua Sang 68110
David Rod 23519
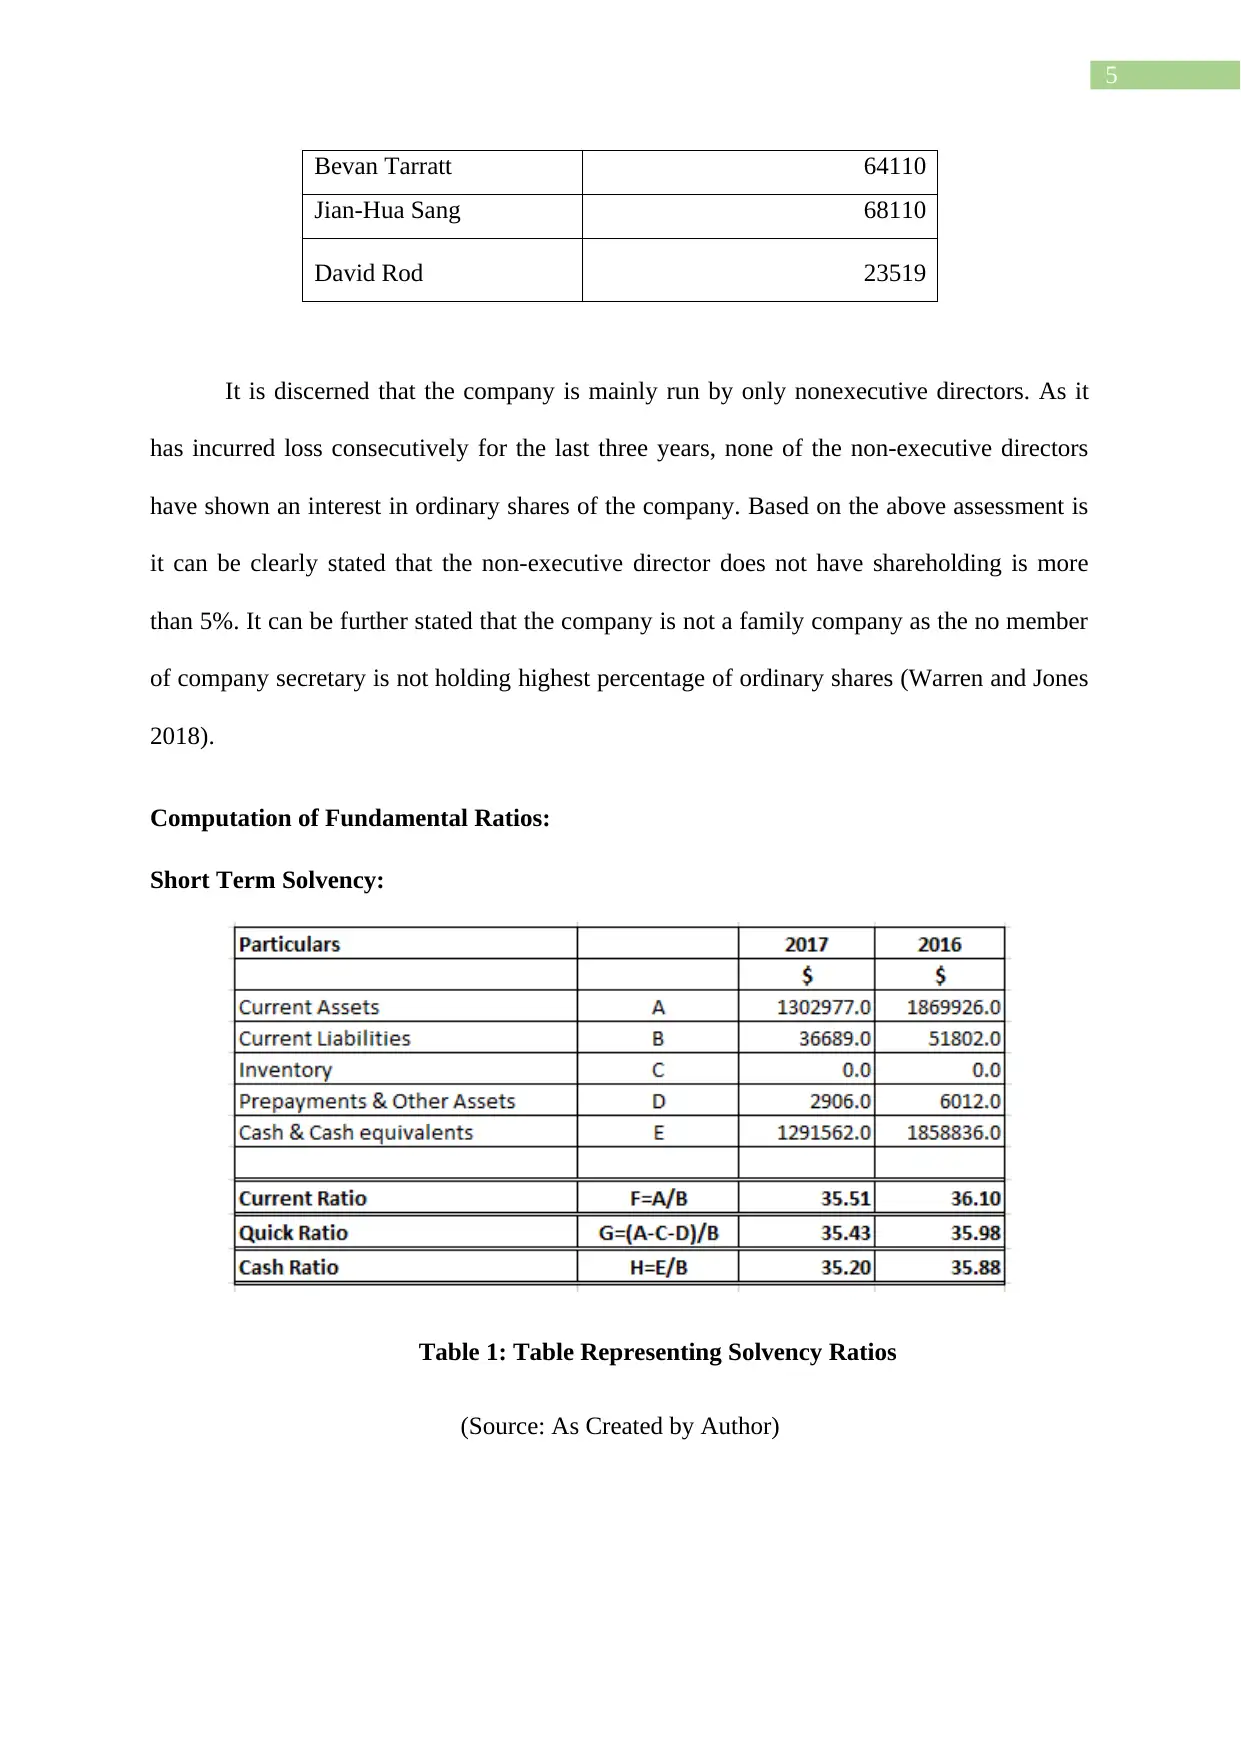
It is discerned that the company is mainly run by only nonexecutive directors. As it
has incurred loss consecutively for the last three years, none of the non-executive directors
have shown an interest in ordinary shares of the company. Based on the above assessment is
it can be clearly stated that the non-executive director does not have shareholding is more
than 5%. It can be further stated that the company is not a family company as the no member
of company secretary is not holding highest percentage of ordinary shares (Warren and Jones
2018).
Computation of Fundamental Ratios:
Short Term Solvency:
Table 1: Table Representing Solvency Ratios
(Source: As Created by Author)
Bevan Tarratt 64110
Jian-Hua Sang 68110
David Rod 23519
It is discerned that the company is mainly run by only nonexecutive directors. As it
has incurred loss consecutively for the last three years, none of the non-executive directors
have shown an interest in ordinary shares of the company. Based on the above assessment is
it can be clearly stated that the non-executive director does not have shareholding is more
than 5%. It can be further stated that the company is not a family company as the no member
of company secretary is not holding highest percentage of ordinary shares (Warren and Jones
2018).
Computation of Fundamental Ratios:
Short Term Solvency:
Table 1: Table Representing Solvency Ratios
(Source: As Created by Author)
⊘ This is a preview!⊘
Do you want full access?
Subscribe today to unlock all pages.
Trusted by 1+ million students worldwide
6
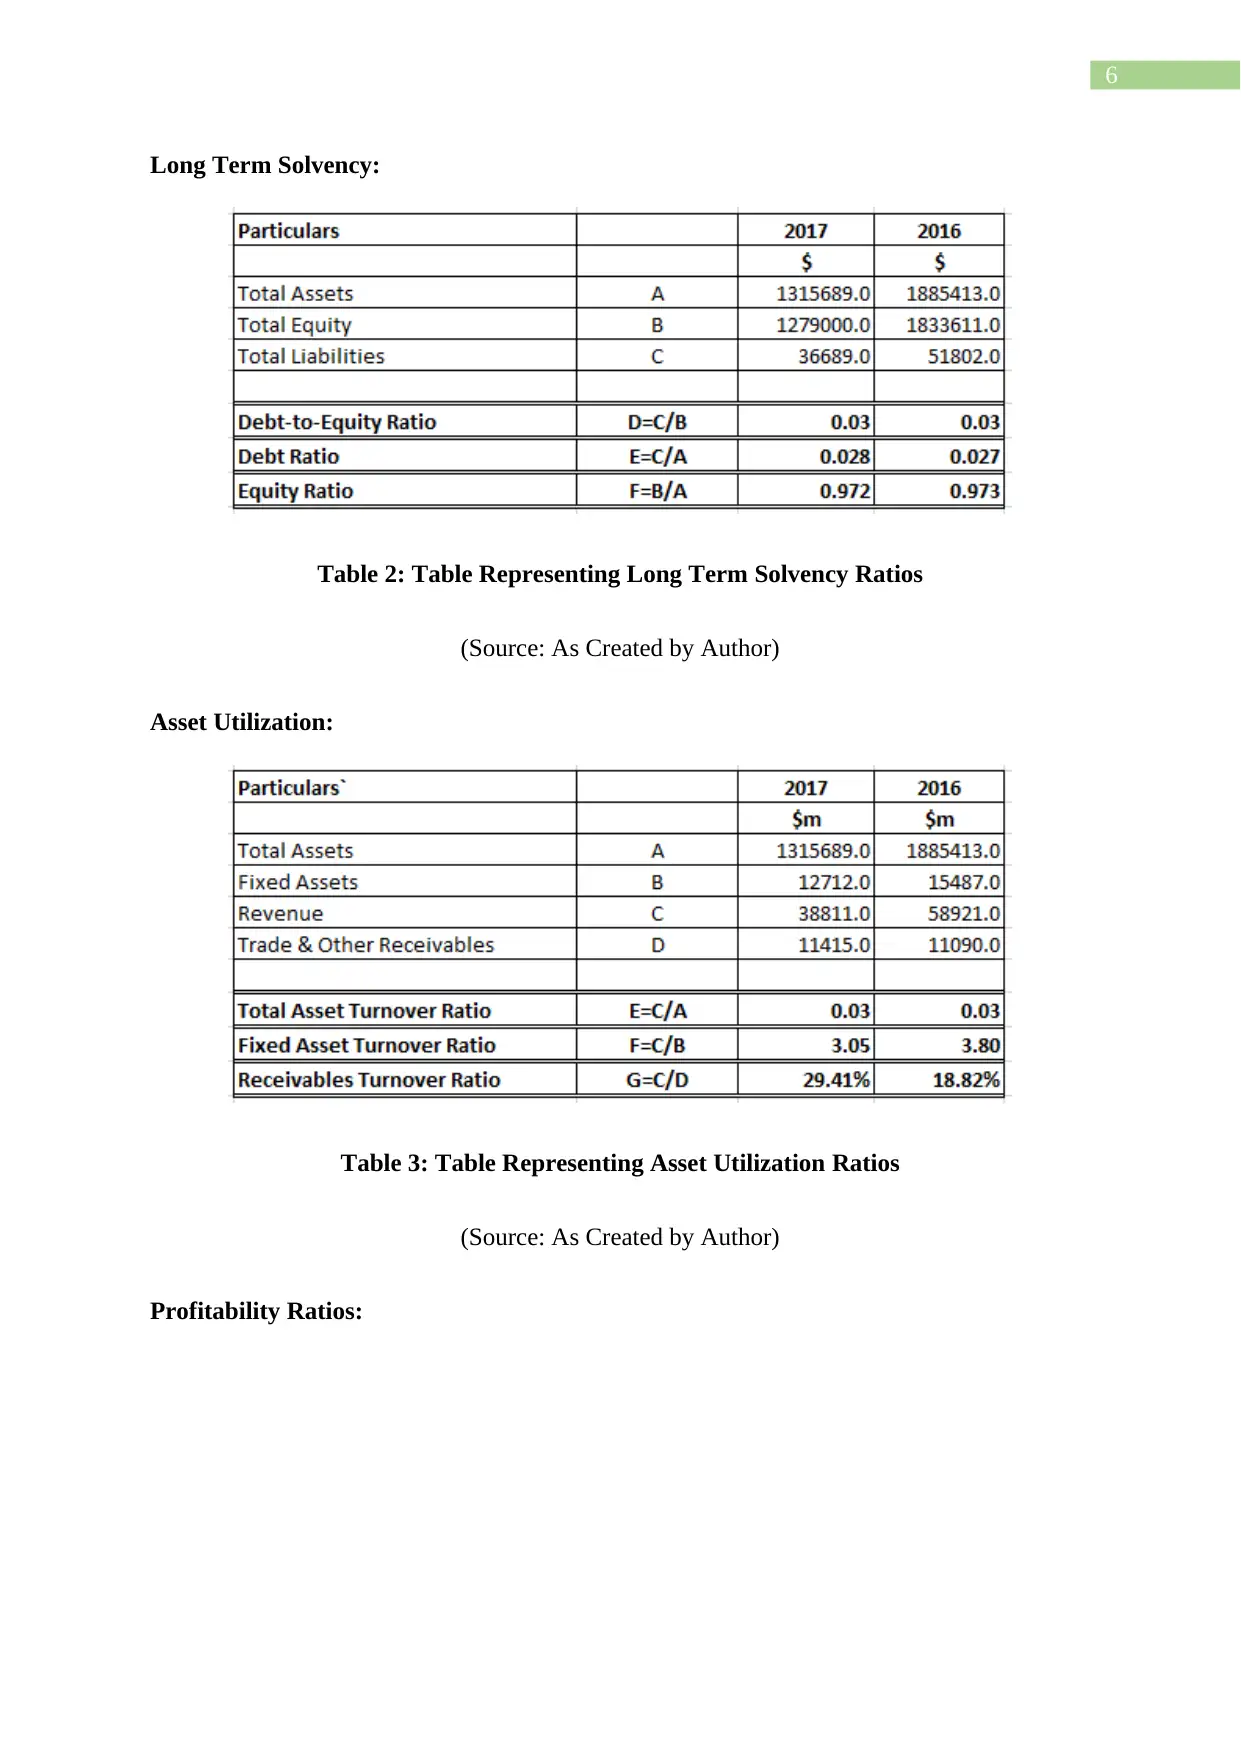
Long Term Solvency:
Table 2: Table Representing Long Term Solvency Ratios
(Source: As Created by Author)
Asset Utilization:
Table 3: Table Representing Asset Utilization Ratios
(Source: As Created by Author)
Profitability Ratios:
Long Term Solvency:
Table 2: Table Representing Long Term Solvency Ratios
(Source: As Created by Author)
Asset Utilization:
Table 3: Table Representing Asset Utilization Ratios
(Source: As Created by Author)
Profitability Ratios:
Paraphrase This Document
Need a fresh take? Get an instant paraphrase of this document with our AI Paraphraser
7
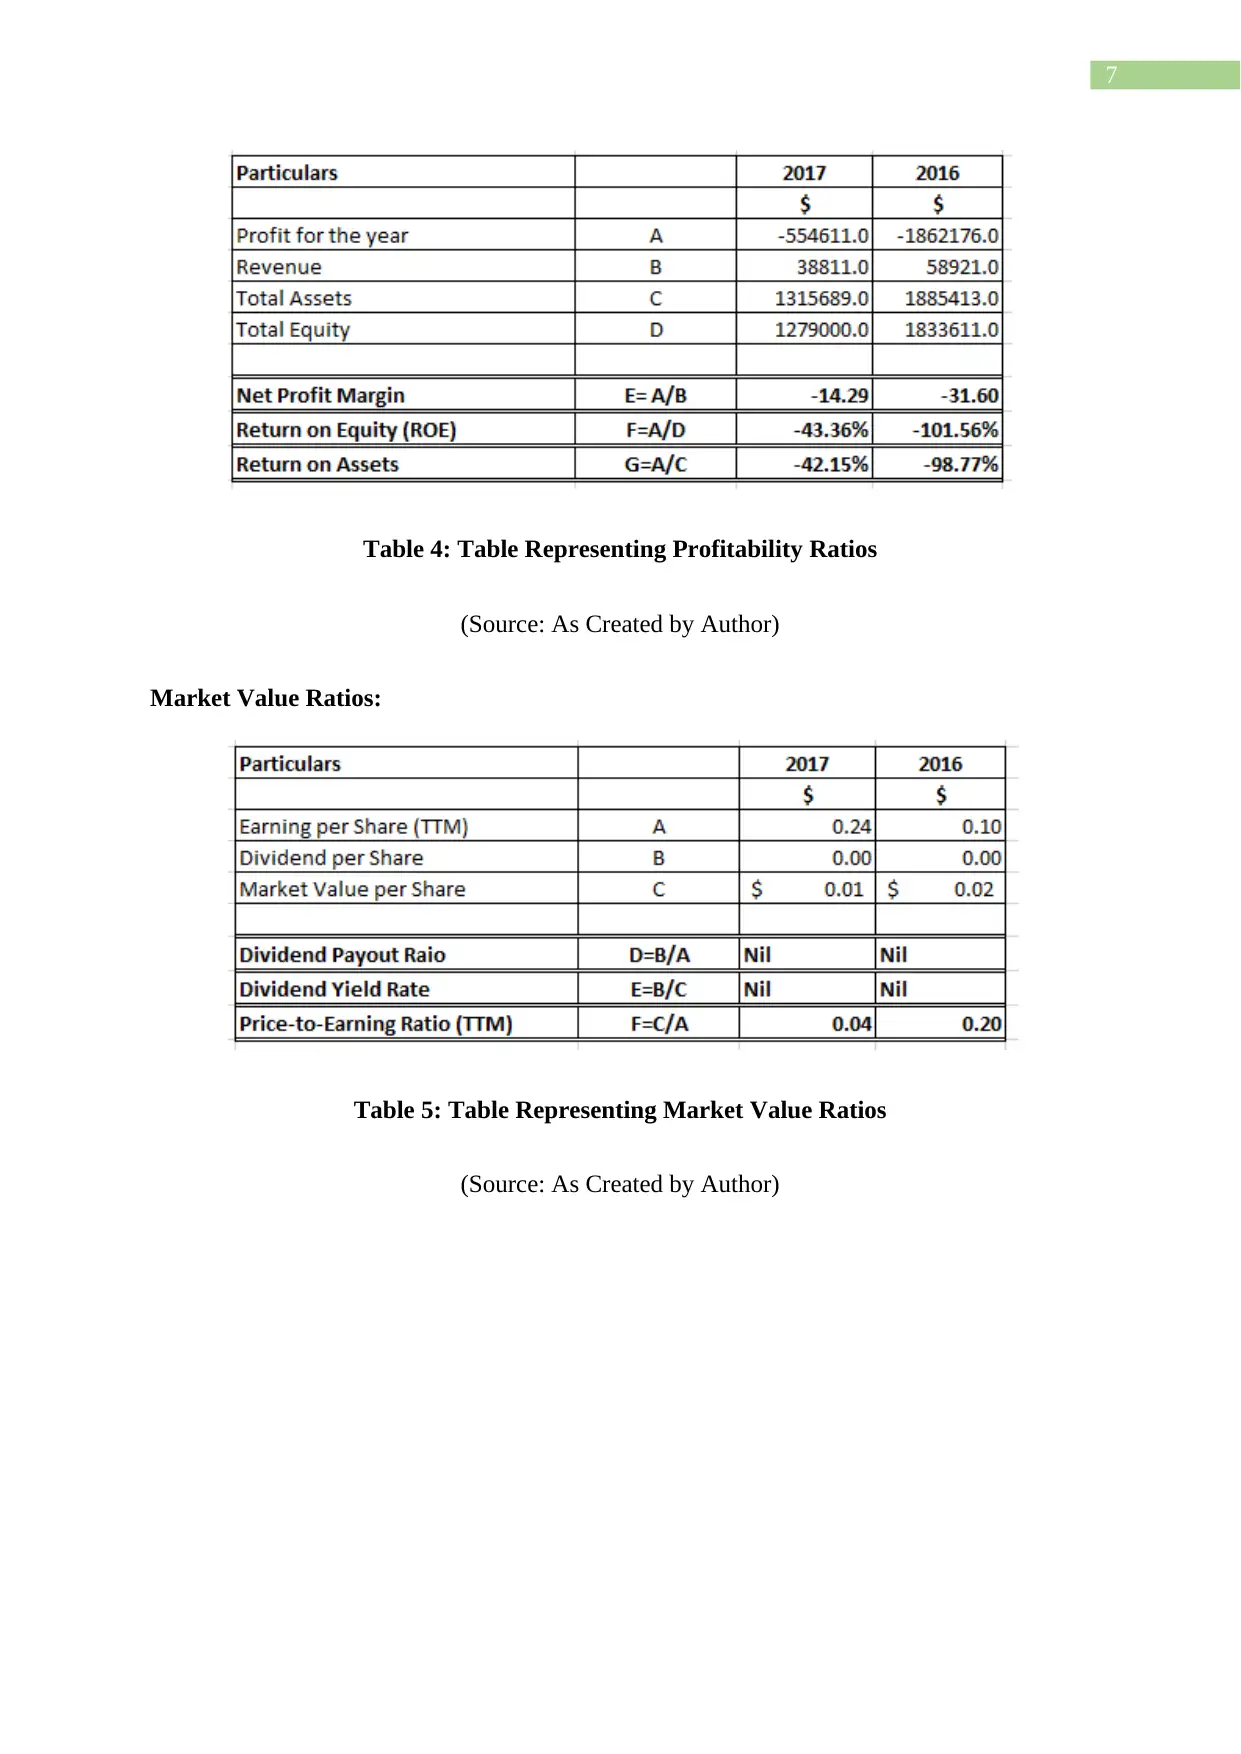
Table 4: Table Representing Profitability Ratios
(Source: As Created by Author)
Market Value Ratios:
Table 5: Table Representing Market Value Ratios
(Source: As Created by Author)
Table 4: Table Representing Profitability Ratios
(Source: As Created by Author)
Market Value Ratios:
Table 5: Table Representing Market Value Ratios
(Source: As Created by Author)
8
Graphical Descriptions of Results:
Movement in Monthly Share Price:
5/1/2016
7/1/2016
9/1/2016
11/1/2016
1/1/2017
3/1/2017
5/1/2017
7/1/2017
9/1/2017
11/1/2017
1/1/2018
3/1/2018
-40.00%
-20.00%
0.00%
20.00%
40.00%
60.00%
80.00%
100.00%
Stock Price Movements
Percentage Monthly Change Emergent Resources Limited
Percentage Monthly Change ^AORD
Figure 1: Figure Representing Movement in Share Price of Emergent Resources
Limited
(Source: As Created by Author)
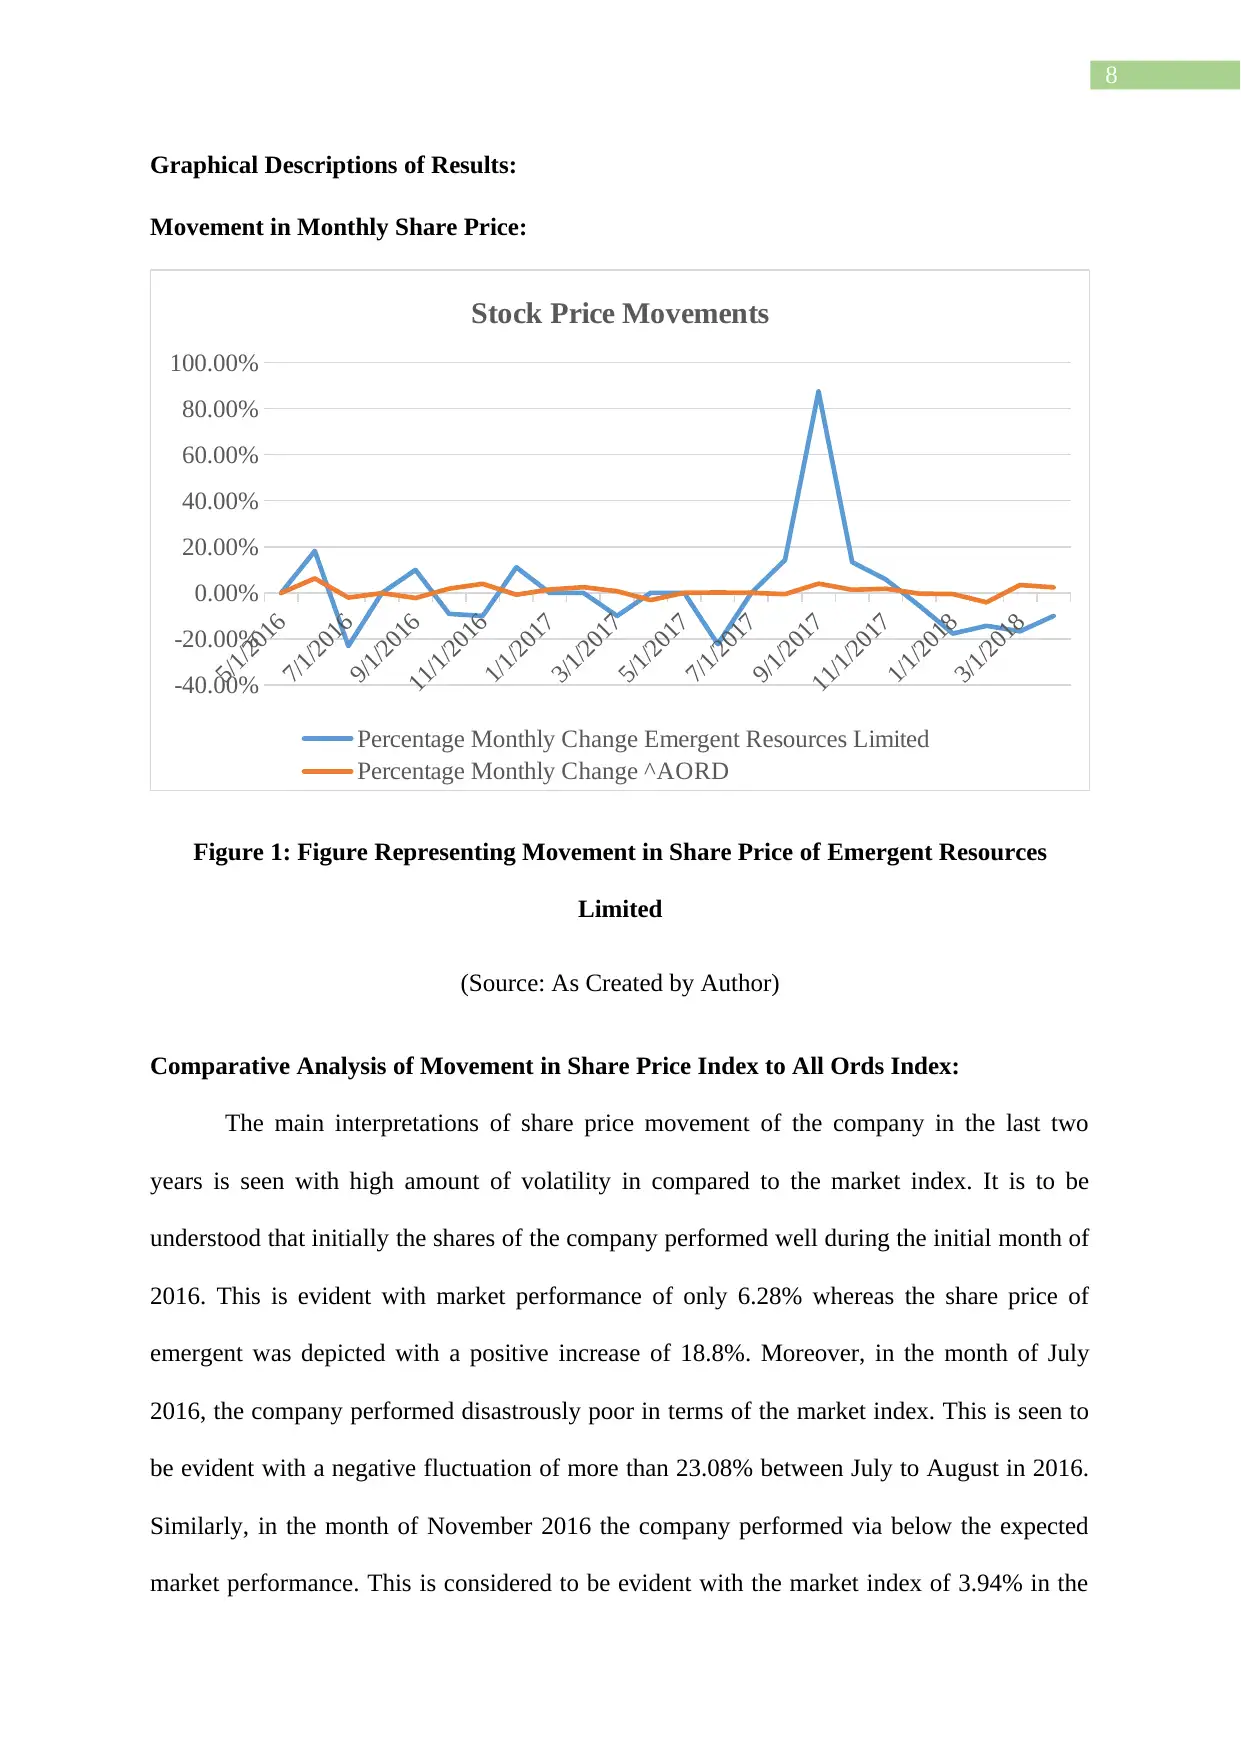
Comparative Analysis of Movement in Share Price Index to All Ords Index:
The main interpretations of share price movement of the company in the last two
years is seen with high amount of volatility in compared to the market index. It is to be
understood that initially the shares of the company performed well during the initial month of
2016. This is evident with market performance of only 6.28% whereas the share price of
emergent was depicted with a positive increase of 18.8%. Moreover, in the month of July
2016, the company performed disastrously poor in terms of the market index. This is seen to
be evident with a negative fluctuation of more than 23.08% between July to August in 2016.
Similarly, in the month of November 2016 the company performed via below the expected
market performance. This is considered to be evident with the market index of 3.94% in the
Graphical Descriptions of Results:
Movement in Monthly Share Price:
5/1/2016
7/1/2016
9/1/2016
11/1/2016
1/1/2017
3/1/2017
5/1/2017
7/1/2017
9/1/2017
11/1/2017
1/1/2018
3/1/2018
-40.00%
-20.00%
0.00%
20.00%
40.00%
60.00%
80.00%
100.00%
Stock Price Movements
Percentage Monthly Change Emergent Resources Limited
Percentage Monthly Change ^AORD
Figure 1: Figure Representing Movement in Share Price of Emergent Resources
Limited
(Source: As Created by Author)
Comparative Analysis of Movement in Share Price Index to All Ords Index:
The main interpretations of share price movement of the company in the last two
years is seen with high amount of volatility in compared to the market index. It is to be
understood that initially the shares of the company performed well during the initial month of
2016. This is evident with market performance of only 6.28% whereas the share price of
emergent was depicted with a positive increase of 18.8%. Moreover, in the month of July
2016, the company performed disastrously poor in terms of the market index. This is seen to
be evident with a negative fluctuation of more than 23.08% between July to August in 2016.
Similarly, in the month of November 2016 the company performed via below the expected
market performance. This is considered to be evident with the market index of 3.94% in the
⊘ This is a preview!⊘
Do you want full access?
Subscribe today to unlock all pages.
Trusted by 1+ million students worldwide
9
month of November whereas the company’s decrease in percentage with the fluctuations of
share price was seen with -9.09% (Davies 2016.)
In December 2016, the share price experienced less market volatility and depicted
with an increase of 11%. However, in the beginning of 2017 the market experienced several
negative fluctuations with more than 10% decrease in compared to the market index. In the
month of July 2017, the company performed poorly with negative increase of -22.2%. It
needs to be noted that there was a significant increase of percentage change in the closing
price of shares between the months July to November 2017, with market fluctuations
reaching as high as 87.50%. However, this is mainly due to the fact that company was on the
verge of liquidation and many shareholders at that time sold the shares of Emergent
Resources Limited. Since December 2017, the company has experienced only negative
changes as per the market index. Despite of such a poor performance in the stock market it
has recently shown some signs of improvement with a positive increase of 4.67% in the
changing share prices (Berk and Van Binsbergen 2016.)
Identifications of factors that influences the share price of the company:
Some of the main factors associated to the changing share prices at “Emergent
Resources Limited” has been identified with industry related factors such as “changes in
company focus, management earnings forecasts and macroeconomic factors”. Some of the
main interpretation of the “industry wide factors” has been identified with operating
strategies of expansion of the business on a particular domain such as in this case it is
identified with continued efforts in developing “Beyondie Iron Ore Projects” and able to
rationalise the tenement portfolio to prove itself as effective cost Explorer in the market. In
various situations, the businesses dependent on approval from state agreements. However, the
company has not shown much improvement in the industry wide factors and henceforth
Paraphrase This Document
Need a fresh take? Get an instant paraphrase of this document with our AI Paraphraser
10
investor should be particularly cautious before investing in the shares of “Emergent
Resources Limited”.
The other extent of changes on the share prices associated with “changes in company
focus”, this is seen to be having a relevance with the vertical integration such as
“downstream aggregates, iron ore, logistics and masonry businesses”. It is to be discerned
that Emergent Resources Limited has significantly underperformed in compared to its peers
such as BHP Billiton, Iluka Resources, Rio Tinto and South32. Due to such reasons, several
investors may be willing to buy the shares of other companies instead of investing in the
shares of “Emergent Resources Limited”.
The significant decisions related to management earnings forecasts also influence the
changes in share price. Some of the main rationale for the changes relating to “management
earnings forecasts” has been identified with investments in several types of new upcoming
projects and more exploration activities of manganese and vanadium deposits. It has been
further discerned to comprise “E52/2215 iron-ore tenement” with more than 46 blocks
covering an area of “142 km2 located in Western Australia” (Ijiri 2018).
Calculations of Beta and the Expected Rate of Returns using CAPM:
Computed Beta of the Company:
The beta value of “Emergent Resources Limited” is computed as 1.64.
11
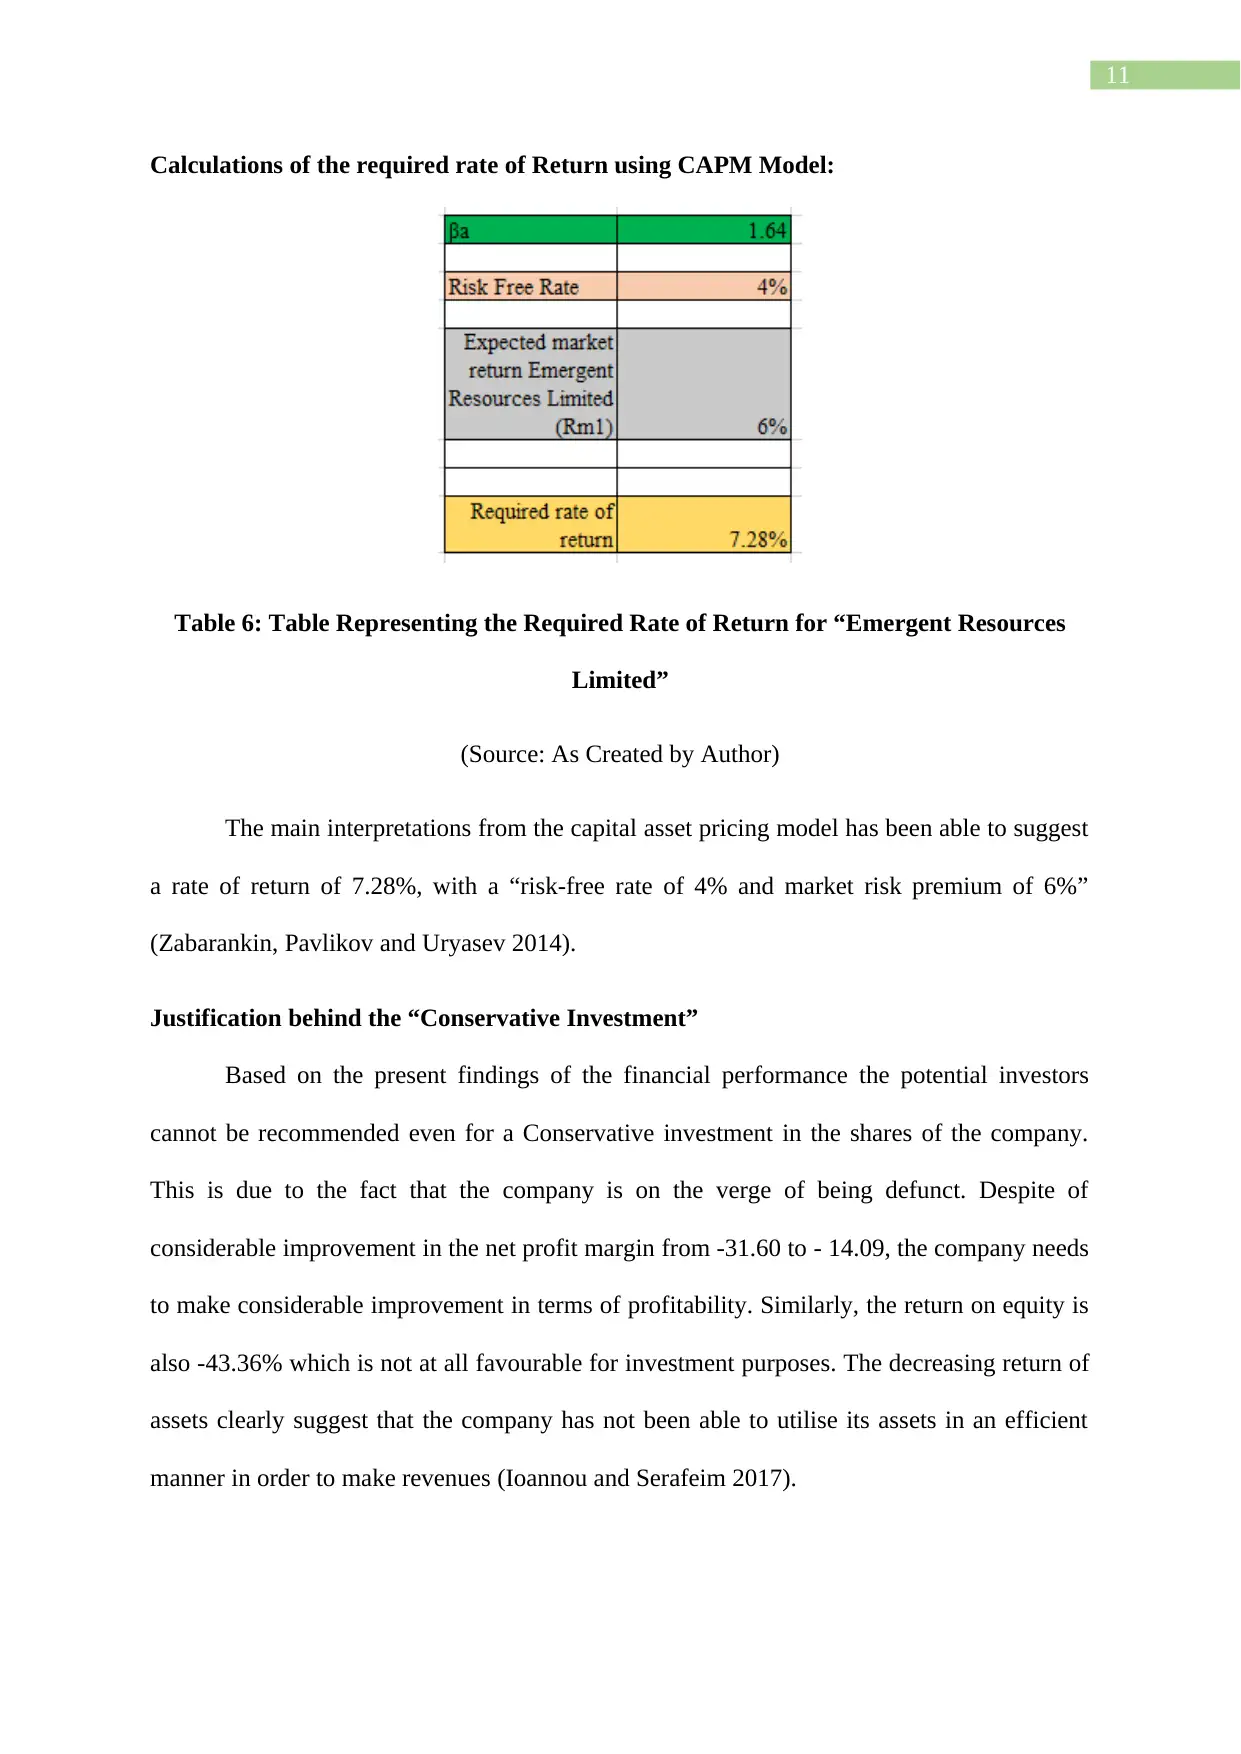
Calculations of the required rate of Return using CAPM Model:
Table 6: Table Representing the Required Rate of Return for “Emergent Resources
Limited”
(Source: As Created by Author)
The main interpretations from the capital asset pricing model has been able to suggest
a rate of return of 7.28%, with a “risk-free rate of 4% and market risk premium of 6%”
(Zabarankin, Pavlikov and Uryasev 2014).
Justification behind the “Conservative Investment”
Based on the present findings of the financial performance the potential investors
cannot be recommended even for a Conservative investment in the shares of the company.
This is due to the fact that the company is on the verge of being defunct. Despite of
considerable improvement in the net profit margin from -31.60 to - 14.09, the company needs
to make considerable improvement in terms of profitability. Similarly, the return on equity is
also -43.36% which is not at all favourable for investment purposes. The decreasing return of
assets clearly suggest that the company has not been able to utilise its assets in an efficient
manner in order to make revenues (Ioannou and Serafeim 2017).
⊘ This is a preview!⊘
Do you want full access?
Subscribe today to unlock all pages.
Trusted by 1+ million students worldwide
1 out of 18
Related Documents


Your All-in-One AI-Powered Toolkit for Academic Success.
+13062052269
info@desklib.com
Available 24*7 on WhatsApp / Email
![[object Object]](/_next/static/media/star-bottom.7253800d.svg)
Unlock your academic potential
Copyright © 2020–2026 A2Z Services. All Rights Reserved. Developed and managed by ZUCOL.