HI5002 Finance for Business Group Assignment: Telstra Financial Report

Verified

Added on  2023/06/13

|22
|4358
|452
Report
AI Summary
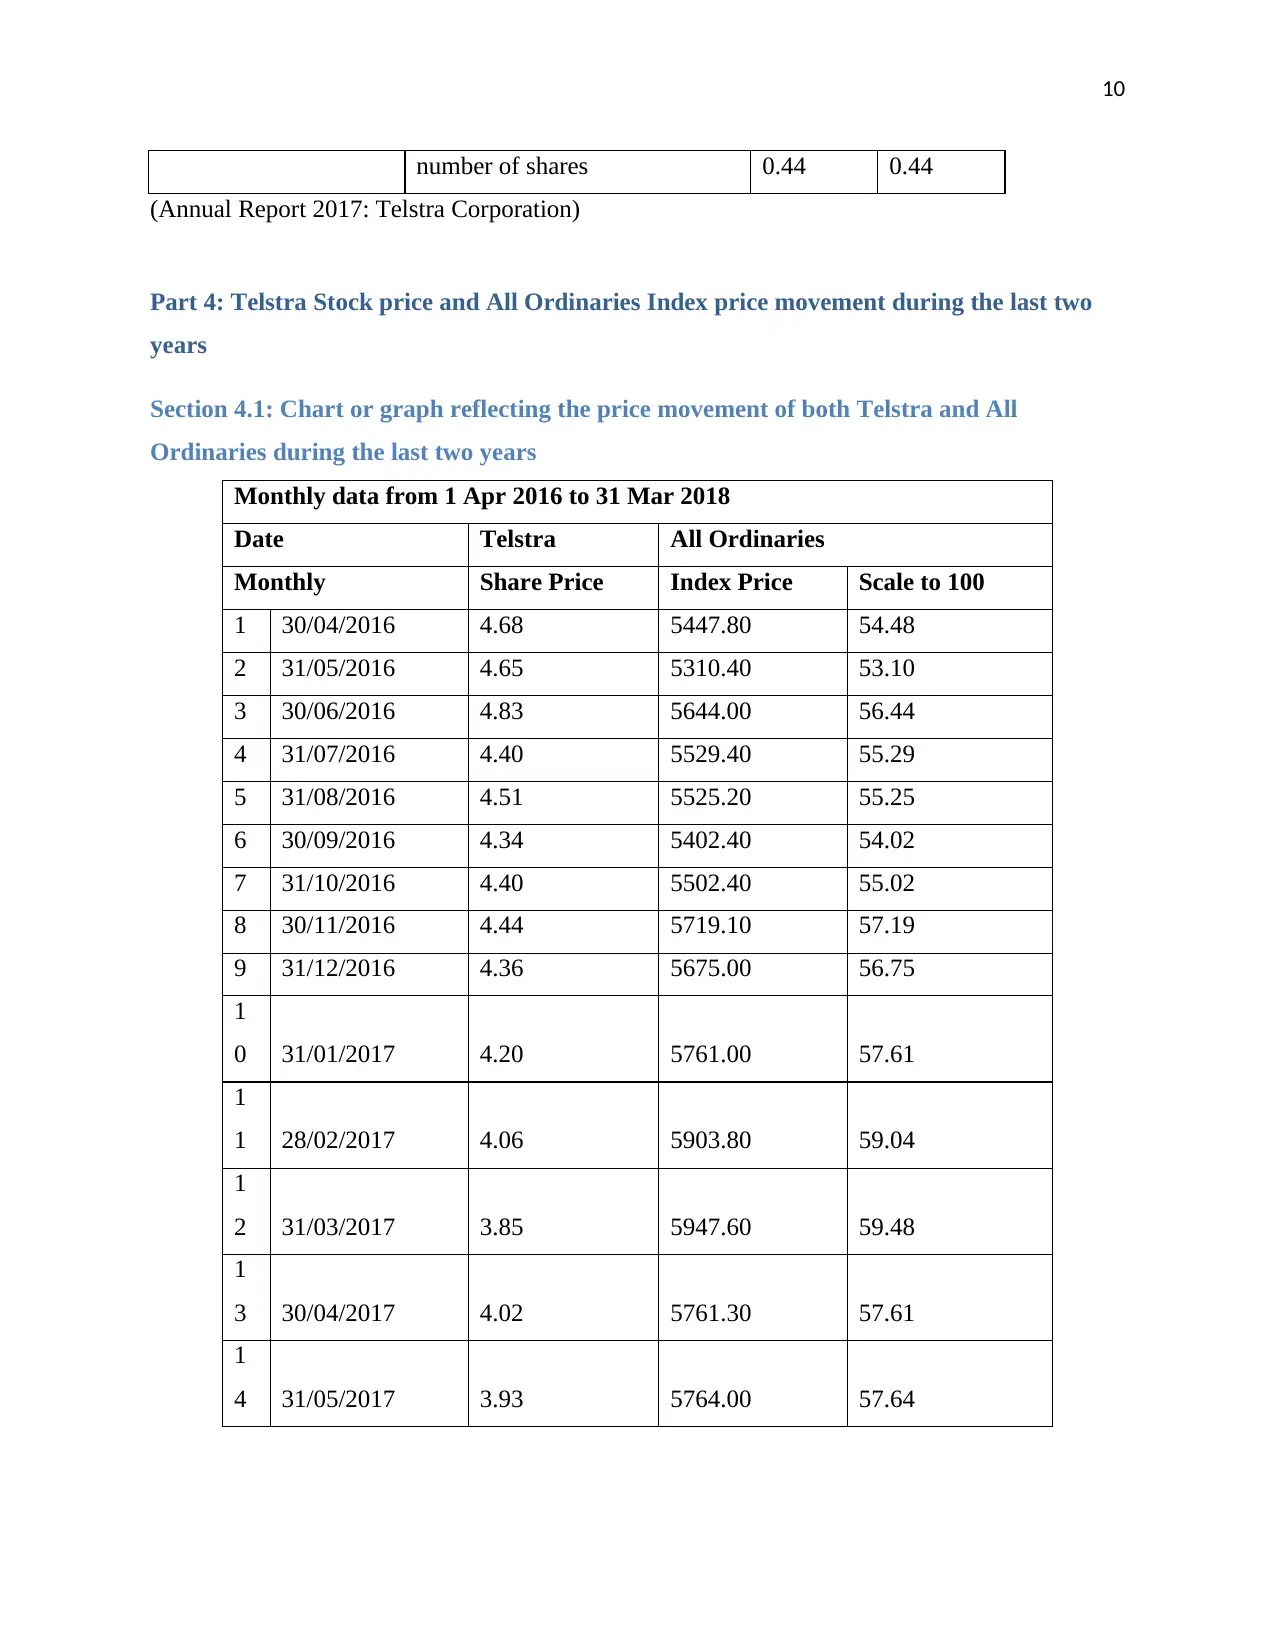
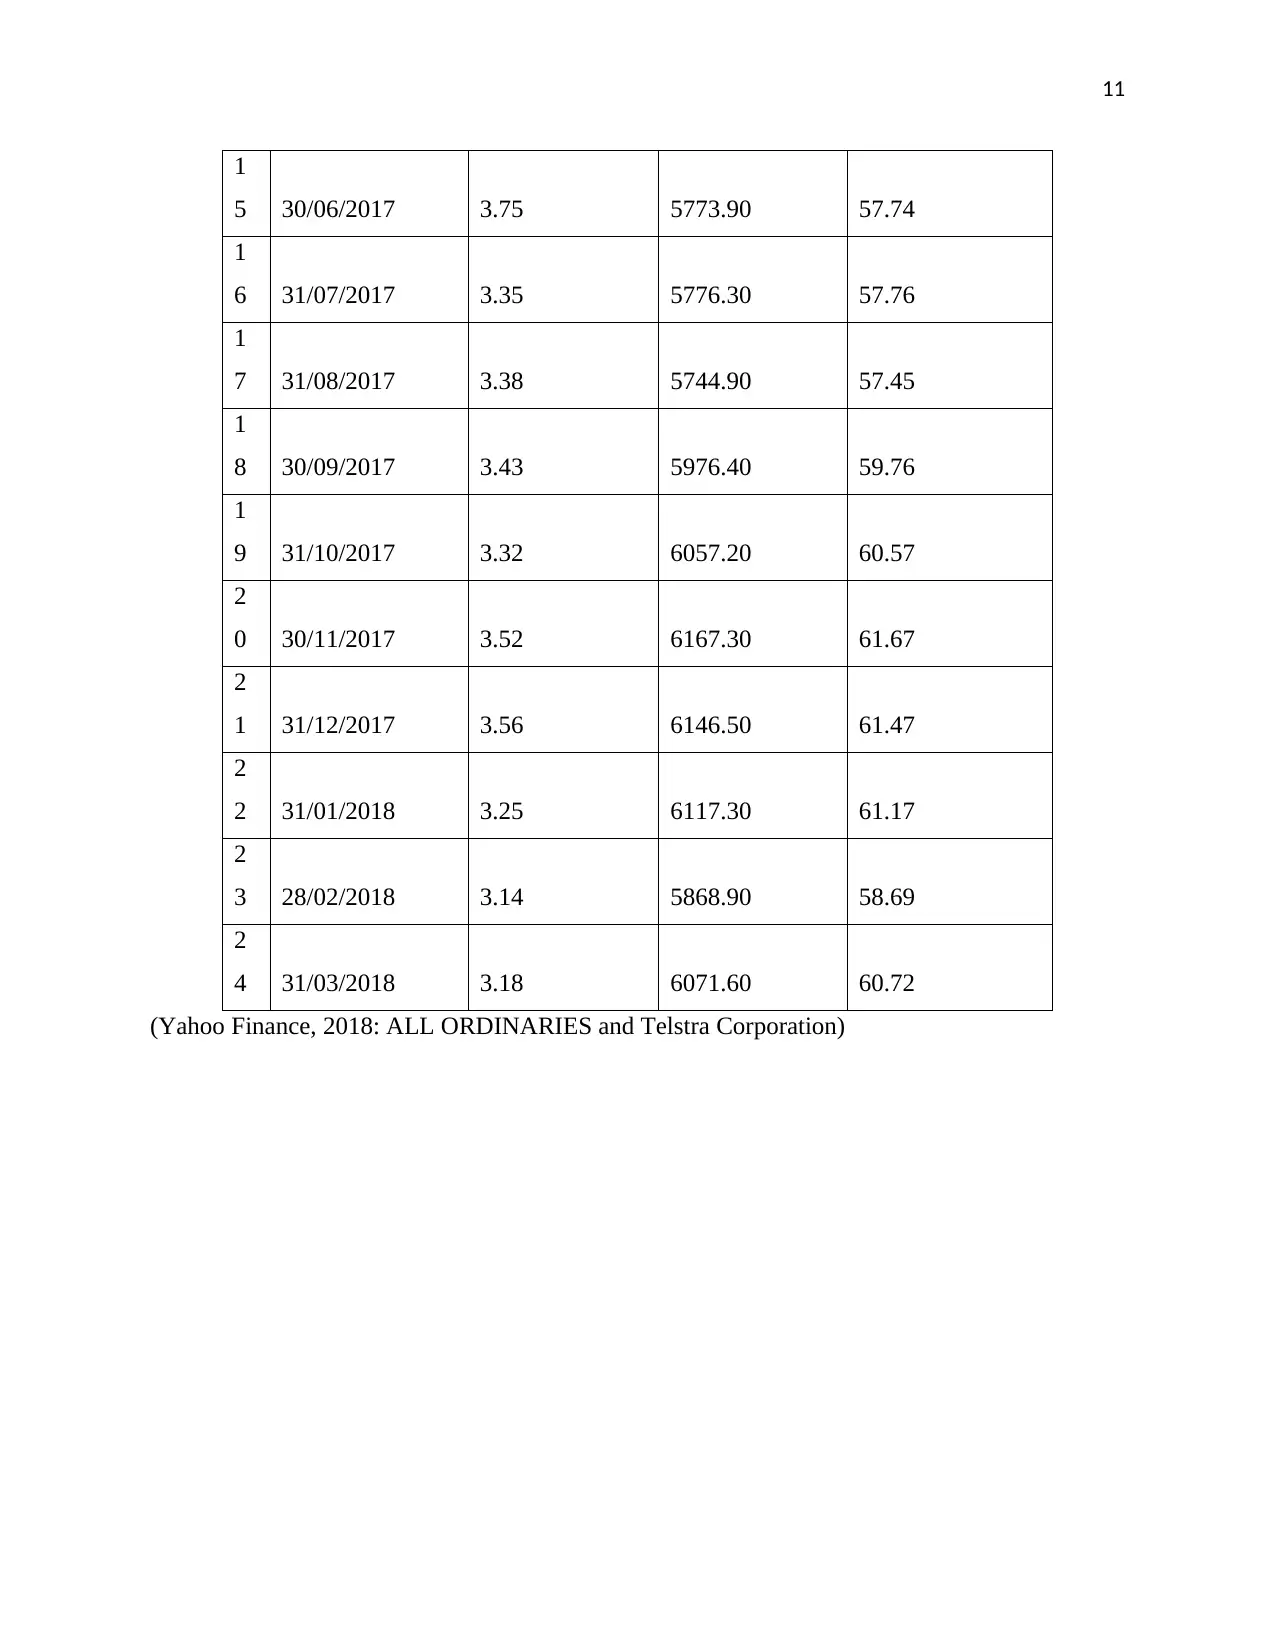
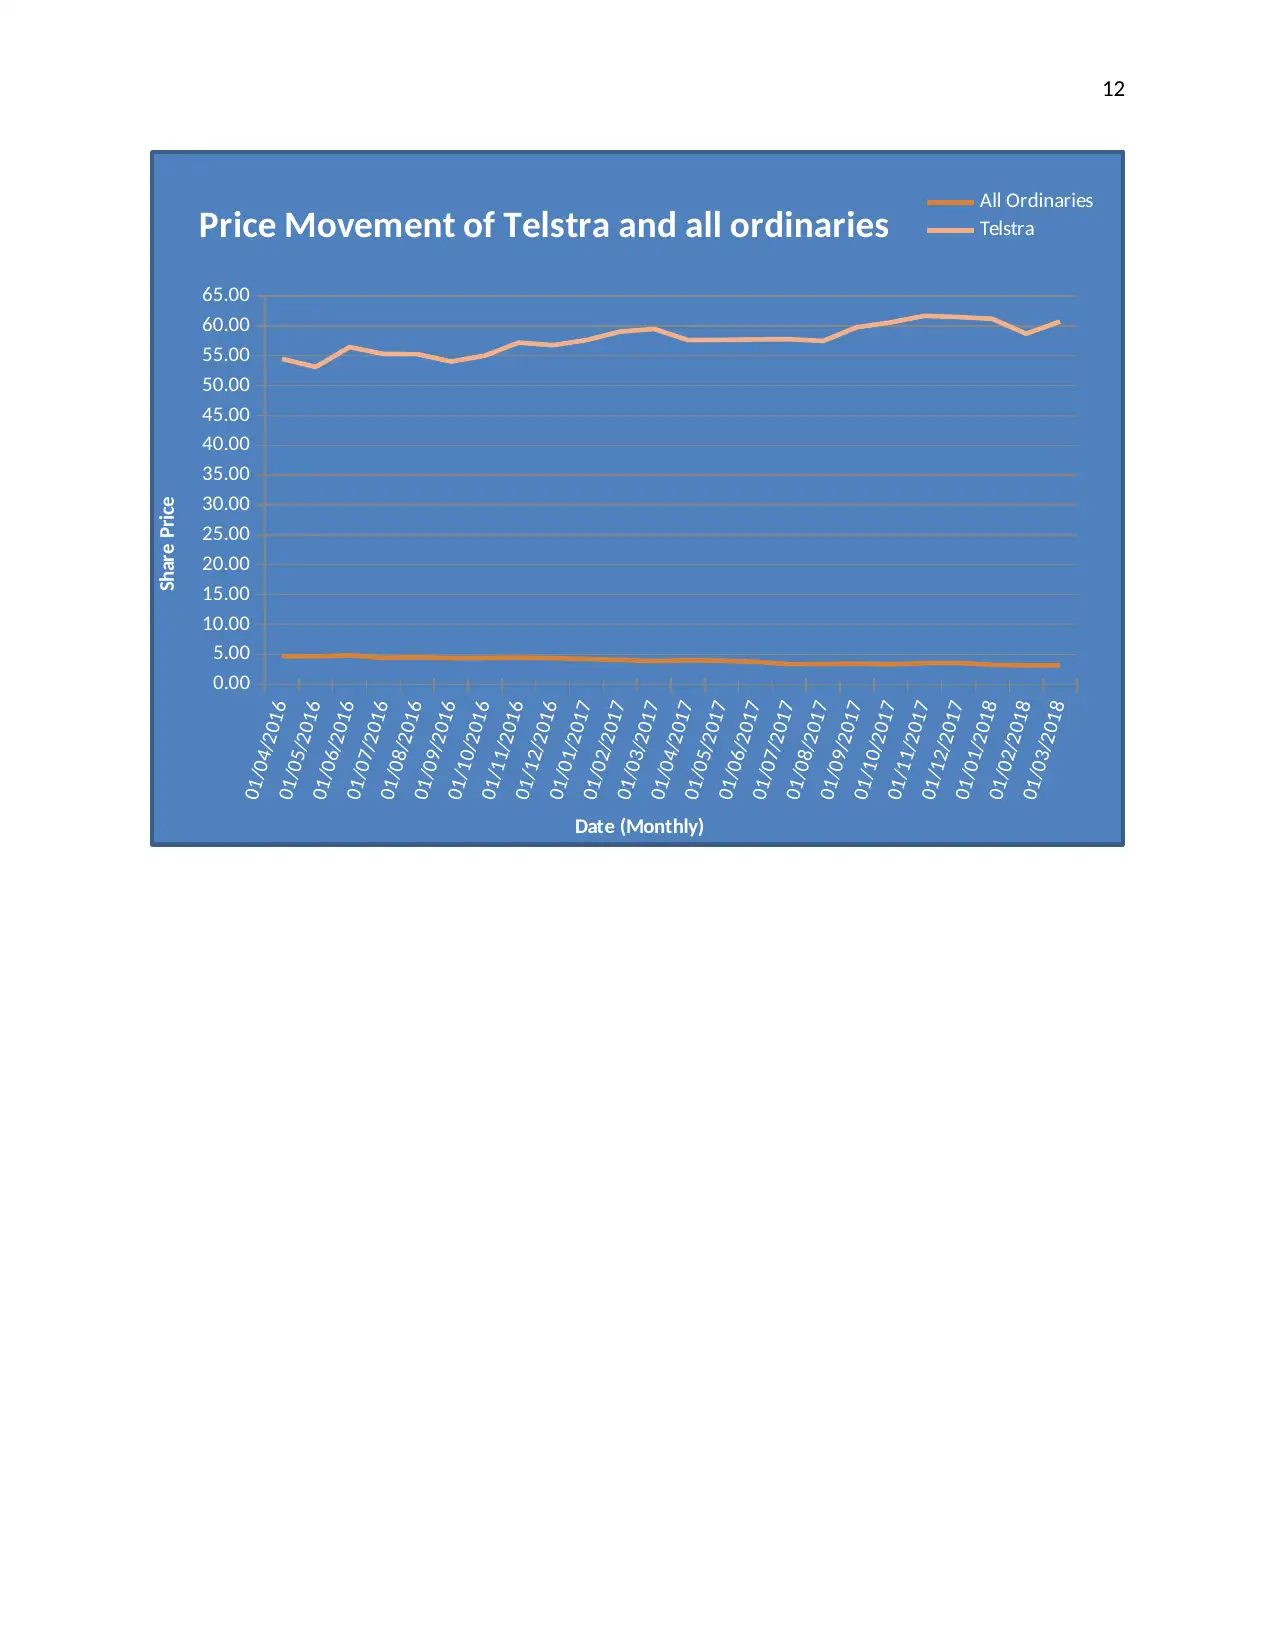
This report provides a comprehensive financial analysis of Telstra Corporation Limited, evaluating its performance to offer investment advice. The analysis includes an examination of the company's ownership and governance structure, followed by an in-depth ratio analysis covering liquidity, solvency, profitability, and market ratios. The report also explores the movement of Telstra's stock price against the All Ordinaries Index, calculating correlation and volatility. Furthermore, it applies the Capital Asset Pricing Model (CAPM) to determine the required rate of return and calculates the Weighted Average Cost of Capital (WACC). The capital structure and dividend policy are also discussed. Finally, the report provides a recommendation report for investors, guiding their investment decisions. The analysis is based on financial data from 2016 to 2018 and includes relevant financial and business publications. The report is designed to provide financial assistance to a wealthy investor considering investment in Telstra.
Document Page
1
HI5002: Finance for Business
Group Assignment
tabler-icon-diamond-filled.svg

Paraphrase This Document

Need a fresh take? Get an instant paraphrase of this document with our AI Paraphraser
Document Page
2
Executive Summary
The report is developed in the context of providing an understanding of the importance of
financial analysis to examine the potential of a company for investment purpose. In this context,
the report has presented an evaluation of the financial performance of Telstra Corporations
Limited by the use of performance ratios, weighted average cost of capital, debt ratios and
calculation of beta for examining the market risk. The report has also discussed the dividend
policy and provided the letter of recommendation to the investors for guiding their investment
making decisions.
Document Page
3
Contents
Executive Summary.........................................................................................................................2
Introduction......................................................................................................................................4
Part 1: Description of the company.................................................................................................4
Part 2: Ownership Governance Structure........................................................................................5
Part 3: Use of ratio analysis as the fundamental tool to evaluate the financial performance of the
Telstra Corporation..........................................................................................................................6
Part 4: Telstra Stock price and All Ordinaries Index price movement during the last two years. . .9
Section 4.1: Chart or graph reflecting the price movement of both Telstra and All Ordinaries
during the last two years..............................................................................................................9
Section 4.2: Report that present the description on price movement Telstra Stock to all
Ordinaries Index- Insight of Correlation and Volatility of the stock.........................................11
Part 5: Research Regarding the Financial or Business Publications.............................................12
Part 6: Use of CAPM model to estimate the required rate of return of Telstra Corporation.........14
Section 6.1: Identification of Beta of Telstra Corporation.........................................................14
Section 6.2: Application of CAPM Model.................................................................................14
Section 6.3: Discussion on whether Telstra is good for the conservative investment...............14
Part 7: Identification of Weighted average cost of capital............................................................14
Section 7.1: Application of WACC...........................................................................................14
Section 7.2: Impact on higher rate of WACC on the prospective investment projects of Telstra
....................................................................................................................................................16
8. Capital Structure of Telstra Corporations Limited....................................................................16
Section 8.1: Optimal Capital Structure......................................................................................16
Section 8.2: Impact on Gearing Ratio........................................................................................16
Part 9: Dividend Policy..................................................................................................................16
Document Page
4
Part 10: Recommendation Report..................................................................................................17
References......................................................................................................................................18
tabler-icon-diamond-filled.svg

Paraphrase This Document

Need a fresh take? Get an instant paraphrase of this document with our AI Paraphraser
Document Page
5
Introduction
This report is carried out in context of providing financial assistance to a wealthy investor
regarding the investment in a selected company listed on ASX. The financial assistance is
provided on the basis of analysis of financial performance of the company. The financial
performance analysis is carried out on the basis of the performance ratios that are, liquidity, and
profitability, solvency and market ratios. The calculation of the ratios has facilitated in assessing
the performance of the company at present and therefore providing a prediction of its future
growth potential. Also, the calculation of weighted average cost of capital has facilitated in
gaining an insight into the type of capital structure mainlined by the company. The debt ratios
and the beta calculation have also provided an assessment of the financial risk associated with
the company. At last, the report has provided a letter of recommendation for the investors to
guide their investment making decisions in the company. The selected company for carrying out
the overall report is Telstra Corporations Limited.
Part 1: Description of the company
Telstra is recognized as leading telecommunication and technology Company within
Australia involved in providing telecommunication services. The company was established in
the year 1975 and since then has developed its competency position in providing
telecommunication and information services to businesses, governments, communities and
individuals. The major products and services provided by the company include markets voice,
mobile and internet access and different types of entertainment products and services. It is
regarded to be the largest telecommunication company within Australia and has attained this
position by providing innovating communication services to customers for improving the ways
in which they live and work. It carries out its business activities by Telstra Retail, global
enterprise and services, Telstra wholesale and Telstra operations segments. It provides its
telecommunication products and services to businesses, governments, communities and
individuals across Australia and at international level. The company listed on ASX carries out its
business operations on strong purpose and values that has facilitated in promoting its growth and
development (Telstra: Annual Report, 2017).
Document Page
6
Part 2: Ownership Governance Structure
(i): Major Shareholders
As depicted from its annual report, there are no shareholders having more than 20% of
the shareholdings in Telstra Corporation Limited. HSBC Custody Nominees (17.98%), JP
Morgan Nominees Australia Limited (10.89%) and Citicorp Nominees Pty Ltd (5.61%) are
having more than 5% of the shareholdings in Telstra. The firm can be regarded as non-family
company as the major shareholders are independent entities and the shareholders are not the
members of the governance team.
(ii): Main People Involved in Firm Governance
John Mullen, an independent non-executive director holds the position of the Chairman
of the company since the year 2016. The Chairman is responsible for overseeing the roles and
responsibilities of the Board. The below table depicts the board members of the Telstra
Corporation Limited:
Name of the Board Member Job Designation
Andrew R Penn Chief Executive Officer & Managing Director
Craig W Dunn Non-executive director
Peter R Hearl Non-executive director
Jane Hemstritch Non-executive director
Margaret Seale Non-executive director
Russell A Higgins Non-executive director
Nora L Scheinkestel Non-executive director
Steven M Vamos Non-executive director
Trae Vassallo Non-executive director
As depicted in the above table, Andrew R Penn is the Chief executive officer and
managing director of the company. It is early depicted from the board team members that they do
not have any role as the major shareholders of the company (Telstra: Annual Report, 2017). The
major shareholders of the company as depicted from its annual report are depicted as follows:
Document Page
7
(Source: https://www.telstra.com.au/content/dam/tcom/about-us/investors/pdf-e/Annual-Report-
2017.PDF)
Part 3: Use of ratio analysis as the fundamental tool to evaluate the financial performance
of the Telstra Corporation
Ratio Analysis is an important and widely used fundamental tool to assess financial
performance of any entity and also to comparison of same company in different years and
different companies in same years. Ratio analysis allows high level of flexibility to make
financial analysis but it has some limitations that impact the quality of financial analysis
(Glajnaric, 2016).
In this section ratio analysis of Telstra Corporation has been carried out for last two years
and results have been presented in below table:
Financial Data used to calculate the financial ratio
Telstra Company
Amount in $ million
Financial Items 2016 2017
Current Assets
$
9,340.00
$
7,862.00
Current Liabilities $ $
tabler-icon-diamond-filled.svg

Paraphrase This Document

Need a fresh take? Get an instant paraphrase of this document with our AI Paraphraser
Document Page
8
9,188.00 9,159.00
Inventories
$
557.00
$
893.00
Quick Assets
$
8,783.00
$
6,969.00
Long Term Debt
$
18,227.00
$
18,433.00
Shareholders' Equity
$
15,871.00
$
14,541.00
Total Assets
$
43,286.00
$
42,133.00
Interest Paid
$
796.00
$
729.00
EBIT
$
7,110.00
$
2,067.00
Account Receivable
$
3,343.00
$
3,635.00
Net Profit
$
5,780.00
$
3,891.00
Net Revenue (Credit Sales)
$
25,834.00
$
25,912.00
Weighted Average number
of ordinary shares (in
millions) 12215.00 11968.00
Cost of Goods Sold
$
7,247.00
$
10,958.00
Dividend Paid during the
year (Final and interim)
$
0.44
$
0.44
(Annual Report 2017: Telstra Corporation)
Financial Ratios Formulas 2016 2017
Short term solvency
Document Page
9
Current ratio
Current Assets/Current
Liabilities 1.02 0.86
Quick ratio
Quick Assets/Current
Liabilities 0.96 0.76
Long term solvency
Debt Ratio Long Term Debt/Total Assets 0.42 0.44
Debt to Equity Ratio
Long Term Debt/ Shareholders
Equity 1.15 1.27
Times interest earned
ratio EBIT/Interest Expenses 8.93 2.84
Asset utilization
Inventory Turnover
Ratio Cost of Goods Sold/Inventory 13.01 12.27
Total Asset turnover
ratio Net Revenue/Total assets 0.60 0.62
Account Receivable
Turnover ratio
Credit Sales/Account
Receivable 7.73 7.13
Profitability Ratios
Net Margin Ratio Net profit/Net Revenue 22.37% 15.02%
Return on total assets Net profit/Total Assets 13.35% 9.24%
Return on ordinary
shareholders’ equity Net profit/Shareholder's Equity 36.42% 26.76%
Market Value Ratios
Earnings Per Share
Net profit/weighted average
number of shares
$
0.47
$
0.33
Dividend Per Share Dividend/weighted average $ $
Document Page
10
number of shares 0.44 0.44
(Annual Report 2017: Telstra Corporation)
Part 4: Telstra Stock price and All Ordinaries Index price movement during the last two
years
Section 4.1: Chart or graph reflecting the price movement of both Telstra and All
Ordinaries during the last two years
Monthly data from 1 Apr 2016 to 31 Mar 2018
Date Telstra All Ordinaries
Monthly Share Price Index Price Scale to 100
1 30/04/2016 4.68 5447.80 54.48
2 31/05/2016 4.65 5310.40 53.10
3 30/06/2016 4.83 5644.00 56.44
4 31/07/2016 4.40 5529.40 55.29
5 31/08/2016 4.51 5525.20 55.25
6 30/09/2016 4.34 5402.40 54.02
7 31/10/2016 4.40 5502.40 55.02
8 30/11/2016 4.44 5719.10 57.19
9 31/12/2016 4.36 5675.00 56.75
1
0 31/01/2017 4.20 5761.00 57.61
1
1 28/02/2017 4.06 5903.80 59.04
1
2 31/03/2017 3.85 5947.60 59.48
1
3 30/04/2017 4.02 5761.30 57.61
1
4 31/05/2017 3.93 5764.00 57.64
tabler-icon-diamond-filled.svg

Paraphrase This Document

Need a fresh take? Get an instant paraphrase of this document with our AI Paraphraser
Document Page
11
1
5 30/06/2017 3.75 5773.90 57.74
1
6 31/07/2017 3.35 5776.30 57.76
1
7 31/08/2017 3.38 5744.90 57.45
1
8 30/09/2017 3.43 5976.40 59.76
1
9 31/10/2017 3.32 6057.20 60.57
2
0 30/11/2017 3.52 6167.30 61.67
2
1 31/12/2017 3.56 6146.50 61.47
2
2 31/01/2018 3.25 6117.30 61.17
2
3 28/02/2018 3.14 5868.90 58.69
2
4 31/03/2018 3.18 6071.60 60.72
(Yahoo Finance, 2018: ALL ORDINARIES and Telstra Corporation)
Document Page
12
01/04/2016
01/05/2016
01/06/2016
01/07/2016
01/08/2016
01/09/2016
01/10/2016
01/11/2016
01/12/2016
01/01/2017
01/02/2017
01/03/2017
01/04/2017
01/05/2017
01/06/2017
01/07/2017
01/08/2017
01/09/2017
01/10/2017
01/11/2017
01/12/2017
01/01/2018
01/02/2018
01/03/2018
0.00
5.00
10.00
15.00
20.00
25.00
30.00
35.00
40.00
45.00
50.00
55.00
60.00
65.00
Price Movement of Telstra and all ordinaries All Ordinaries
Telstra
Date (Monthly)
Share Price
chevron_up_icon
1 out of 22
circle_padding
hide_on_mobile
zoom_out_icon
[object Object]