HI5002 Finance for Business: Analyzing Wesfarmers Ltd Performance
VerifiedAdded on 2023/03/30
|20
|4537
|154
Report
AI Summary
This report provides an in-depth financial analysis of Wesfarmers Ltd, an ASX-listed entity, using techniques like ratio analysis, cash management strategies, and sensitivity analysis. The evaluation covers the financial years 2016, 2017, and 2018, examining profitability, operating efficiency, systematic and unsystematic risks, and dividend policy. The analysis indicates Wesfarmers' strong future growth prospects and effective risk management, leading to a recommendation for investment by an institutional investor. The report also discusses the company's use of marketable securities for cash management and includes a capital budgeting scenario to illustrate sensitivity analysis.
HI5002: Group Assignment
1
1
Paraphrase This Document
Need a fresh take? Get an instant paraphrase of this document with our AI Paraphraser
Abstract
This report has been developed for the purpose of providing an insight into the financial
performance of an ASX listed entity, that is, Wesfarmers Ltd. The financial evaluation conducted
with the use of ratio analysis, systematic and unsystematic risks, dividend policy, cash
management and sensitivity analysis has revealed that Wesfarmers is having good future growth
prospects owing to its higher profitability position. It is also effectively managing its systematic
and unsystematic risks in an effective manner and providing good dividend to shareholders and
thus selected for an investment purpose by an institutional investor.
2
Contents
Abstract............................................................................................................................................2
Section I: Introduction to the report.................................................................................................4
Section II: Financial Analysis of Wesfarmers for last three years (2016, 2017 and 2018).............4
Section 2.1: Overview of the selected company..........................................................................4
Section 2.2: Ratio Analysis of Wesfarmers.................................................................................5
Profitability Analysis of Wesfarmers...........................................................................................5
Operating Efficiency Analysis of Wesfarmers............................................................................7
Section 2.3: Use of marketable securities by Wesfarmers for cash management purpose..........9
Section 2.4: Application of sensitivity analysis through using the capital budgeting scenario...9
Section 2.5: Information on systematic risks and unsystematic risks that impacts the
performance of Wesfarmers.......................................................................................................16
Systematic Risks........................................................................................................................16
Unsystematic Risks....................................................................................................................16
Section 2.6: Estimation of dividend payout ratio and identification of dividend policy used by
the management at Wesfarmers.................................................................................................17
Section III: Recommendation Letter.............................................................................................18
Section IV: Conclusion..................................................................................................................19
References......................................................................................................................................20
3
⊘ This is a preview!⊘
Do you want full access?
Subscribe today to unlock all pages.
Trusted by 1+ million students worldwide
Section I: Introduction to the report
The business entities tend to disclose the information relating to their financial
performance through the help of developing the financial statements. The financial statements
are analyzed by the end-users such as investors for gaining an insight into the present and future
growth of a company. This is largely required to take correct investment decisions and ensuring
that the wealth of the investors’ remains protected. This report has been developed for providing
support to an institutional investor aiming to invest within the Australian market. In this context,
an ASX listed entity having a promising future for investment in Australia has been selected for
the purpose of financial evaluation. The financial evaluation has been done by the use of
examination of the financial statements of the selected company with the use of technique such
as ratio analysis, cash management, and sensitivity analysis, discussion of systematic and
unsystematic risks, analysis of dividend payout ratio and providing recommendation to the
investors on the basis of financial evaluation carried out. The ASX listed entity that has been
selected for the purpose of financial evaluation is Wesfarmers Limited, a supermarket giant in
Australia.
Section II: Financial Analysis of Wesfarmers for last three years (2016, 2017 and 2018)
Section 2.1: Overview of the selected company
Wesfarmers Limited is a supermarket giant of Australia whose headquarter is located
Perth. The company is regarded to be in a conglomerate business as it is involved in different
businesses such as retail, chemicals, fertilizers, home improvement, outdoor living, apparel,
general merchandise and industrial safety products. As such, the major business segments have
been divided into following categories:
Home Improvements
Department Stores
Industrial Safety Products
Office Works
The company since its establishment in the year 1914 has been recognized as one of the
major retailing company within Australia. It is regarded as one of the largest employer within the
country. It conducts its diverse business operations with the help of its many subsidiaries such as
Bunning’s Warehouse, Kmart, Officeworks and others across Australia. The primary objective of
the company is to promote sustainable growth of its business through long-term management.
The company since its establishment has prioritized to become a sustainable company by
conducts its business operations in a responsible and ethical manner. The high emphasis placed
on sustainability has enabled the company to promote its long-term growth and development by
achieving a distinctive position in the retailing sector of Australia. It strong commitment towards
4
Paraphrase This Document
Need a fresh take? Get an instant paraphrase of this document with our AI Paraphraser
promoting the growth and development of local communities and reducing the environmental
impact has enabled it to create value over long-term (Wesfarmers Limited, 2019).
Section 2.2: Ratio Analysis of Wesfarmers
This section of the report will provide the detailed calculation of performance ratios
divided into two major categories profitability and operating efficiency. Firstly detailed
calculation has been made for ratios for last three years (2016, 2017 and 2018). All financial data
has been gathered from the annual reports available on company website under investor’s
relation section.
Profitability Analysis of Wesfarmers
The purpose of profitability ratios is to evaluate the profitability performance of the
company during the specific period and it also allows the comparisons of profitability among
two. It means current profitability performance of Wesfarmers can be compared with previous
year in to order to evaluate the trend in performance. Profitability ratios measure the ability of
company to earn the sales revenue through use of resources available with the company. Some of
the important profitability ratios are net profit ratio, gross profit ratio, return on assets and return
on equity.
Data extracted from the financial report of Wesfarmers for last three years
Items of finance Year 2015 Year 2016 Year 2017 Year 2018
Amount in $ Million
Profit before Interest
and tax
$
3,454.00
$
4,400.00
$
4,468.00
Net profit after tax
$
2,646.00
$
2,955.00
$
3,025.00
Net Revenue
$
66,085.00
$
68,648.00
$
67,152.00
Equity Shareholders
value
$
24,781.00
$
22,949.00
$
23,941.00
$
22,754.00
Average shareholder's
equity
$
23,865.00
$
23,445.00
$
23,347.50
Assets (Total)
$
40,402.00
$
40,783.00
$
40,115.00
$
36,933.00
Average total assets
$
40,592.50
$
40,449.00
$
38,524.00
(Wesfarmers Limited, 2018; Wesfarmers Limited. 2017 and Wesfarmers Limited. 2016)
Profitability Ratio (Wesfarmers)
Ratios Formula 2016 2017 2018
Profit earned (Return) on Total
Assets
Profit before Interest
and tax/Average assets
(Total)
8.51% 10.88% 11.60%
5
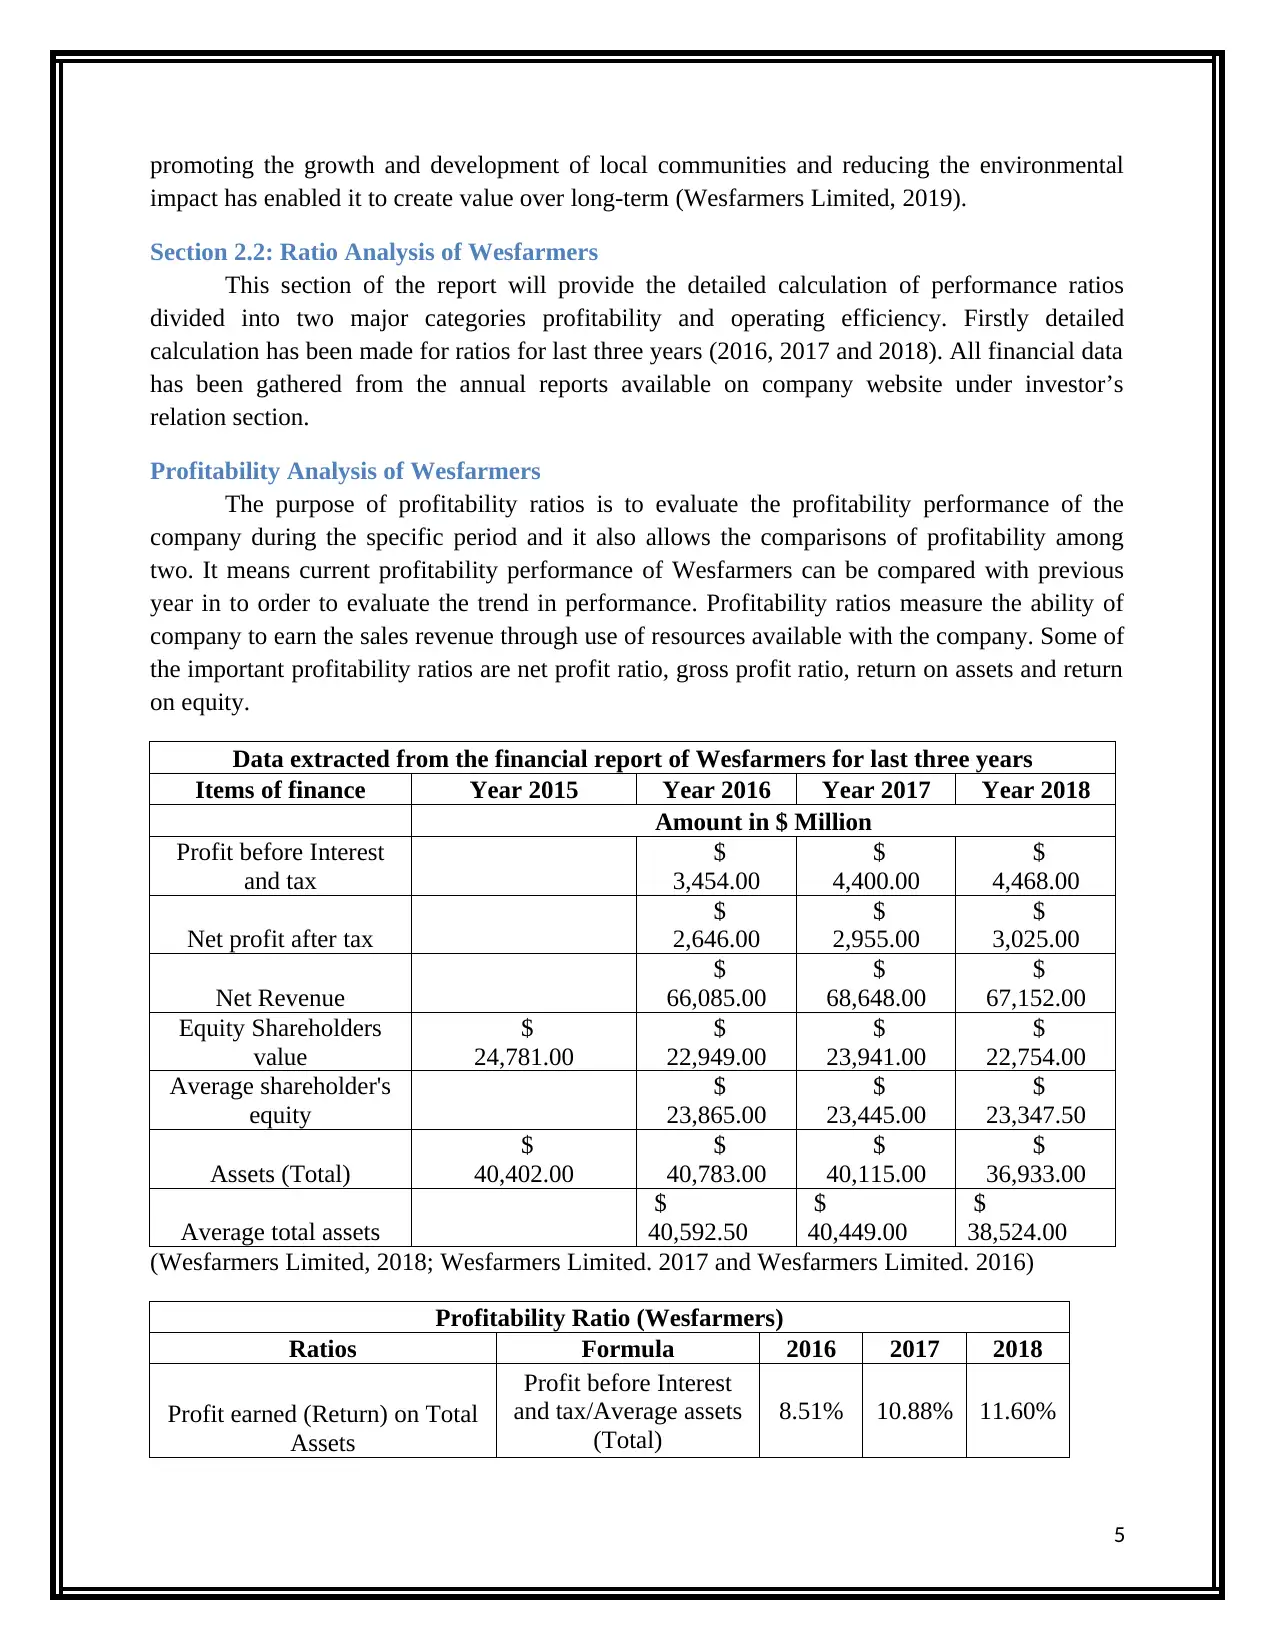
Net profit ratio Net Profit (After tax)/
Revenue (Net) 4.00% 4.30% 4.50%
Profit earned (Return) on Total
Equity
Net profit after
tax/Average
shareholder's equity
11.09% 12.60% 12.96%
(Brigham and Michael, 2013)
2016 2017 2018
0.00%
2.00%
4.00%
6.00%
8.00%
10.00%
12.00%
14.00%
8.51%
10.88%
11.60%
4.00% 4.30% 4.50%
11.09%
12.60% 12.96%
Profitability Ratio of Wesfarmers
Percentage
Profit earned (Return) on Total Assets: Percentage of earnings earned through use of
total assets implying how efficient management is using the assets to earn the earnings.
Return on total assets implies percentage of profits before tax and interest earned on
average total assets applied in the particular year. Wesfarmers has return on total assets of
8.51% in year 2016 that got increased to 10.88% in year 2017 and further increased to
11.60% in year 2018. It means there is positive increasing trend in this ratio from year
2016 to 2018. The main reason behind the increase in return on total assets was better
management policies and change in policies to utilize the assets available with the
company (Tracy, 2012).
Net profit ratio: Net profit ratio is very important as it provide percentage of earnings
left after all expenses including tax has been applied on total net revenue from the
particular period. This ratio is very important from the investor’s point of view as it
provides information on how return company has earned in particular period. Wesfarmers
has earned profit of 4% in year 2016, increased to 4.30% in year 2017 and further
6
⊘ This is a preview!⊘
Do you want full access?
Subscribe today to unlock all pages.
Trusted by 1+ million students worldwide
increased to 4.50% in year 2018 that implies positive increasing trend in net profit ratio in
last three years. The retail industry of Australia has faced tough times in last 5 years and
it is very hard to earn good net profit. This is the reason why profit is less as compared to
percentage of net profit in other industries. Wesfarmers has earned substantial net profit
during the past three years and there was increasing trend in this ratio.
Profit earned (Return) on Total Equity: The ratio denotes the profitability position of a
company by providing an assessment of the net income realized over the equity base of
its shareholders. The ROE of the company has depicted an increasing trend over the past
three years from 11.09% to 12.96% which means that it is generating increasing returns
over the equity resources of its shareholders (Arnold, 2013).
Operating Efficiency Analysis of Wesfarmers
Data extracted from the financial report of Wesfarmers for last three years
Items of finance Year 2015 Year 2016 Year 2017 Year 2018
Amount in $ Million
Net Revenue
$
66,085.00
$
68,648.00
$
67,152.00
Account Receivables
(Net)
$
1,463.00
$
1,628.00
$
1,633.00
$
1,657.00
Average account
receivable
$
1,545.50
$
1,630.50
$
1,645.00
Assets (Total)
$
40,402.00
$
40,783.00
$
40,115.00
$
36,933.00
Average total assets
$
40,592.50
$
40,449.00
$
38,524.00
Cost of Goods Sold
$
45,930.00
$
45,033.00
$
46,123.00
Inventory items
$
5,497.00
$
6,260.00
$
6,530.00
$
6,011.00
Average Inventory
$
5,878.50
$
6,395.00
$
6,270.50
(Wesfarmers Limited, 2018; Wesfarmers Limited. 2017 and Wesfarmers Limited. 2016)
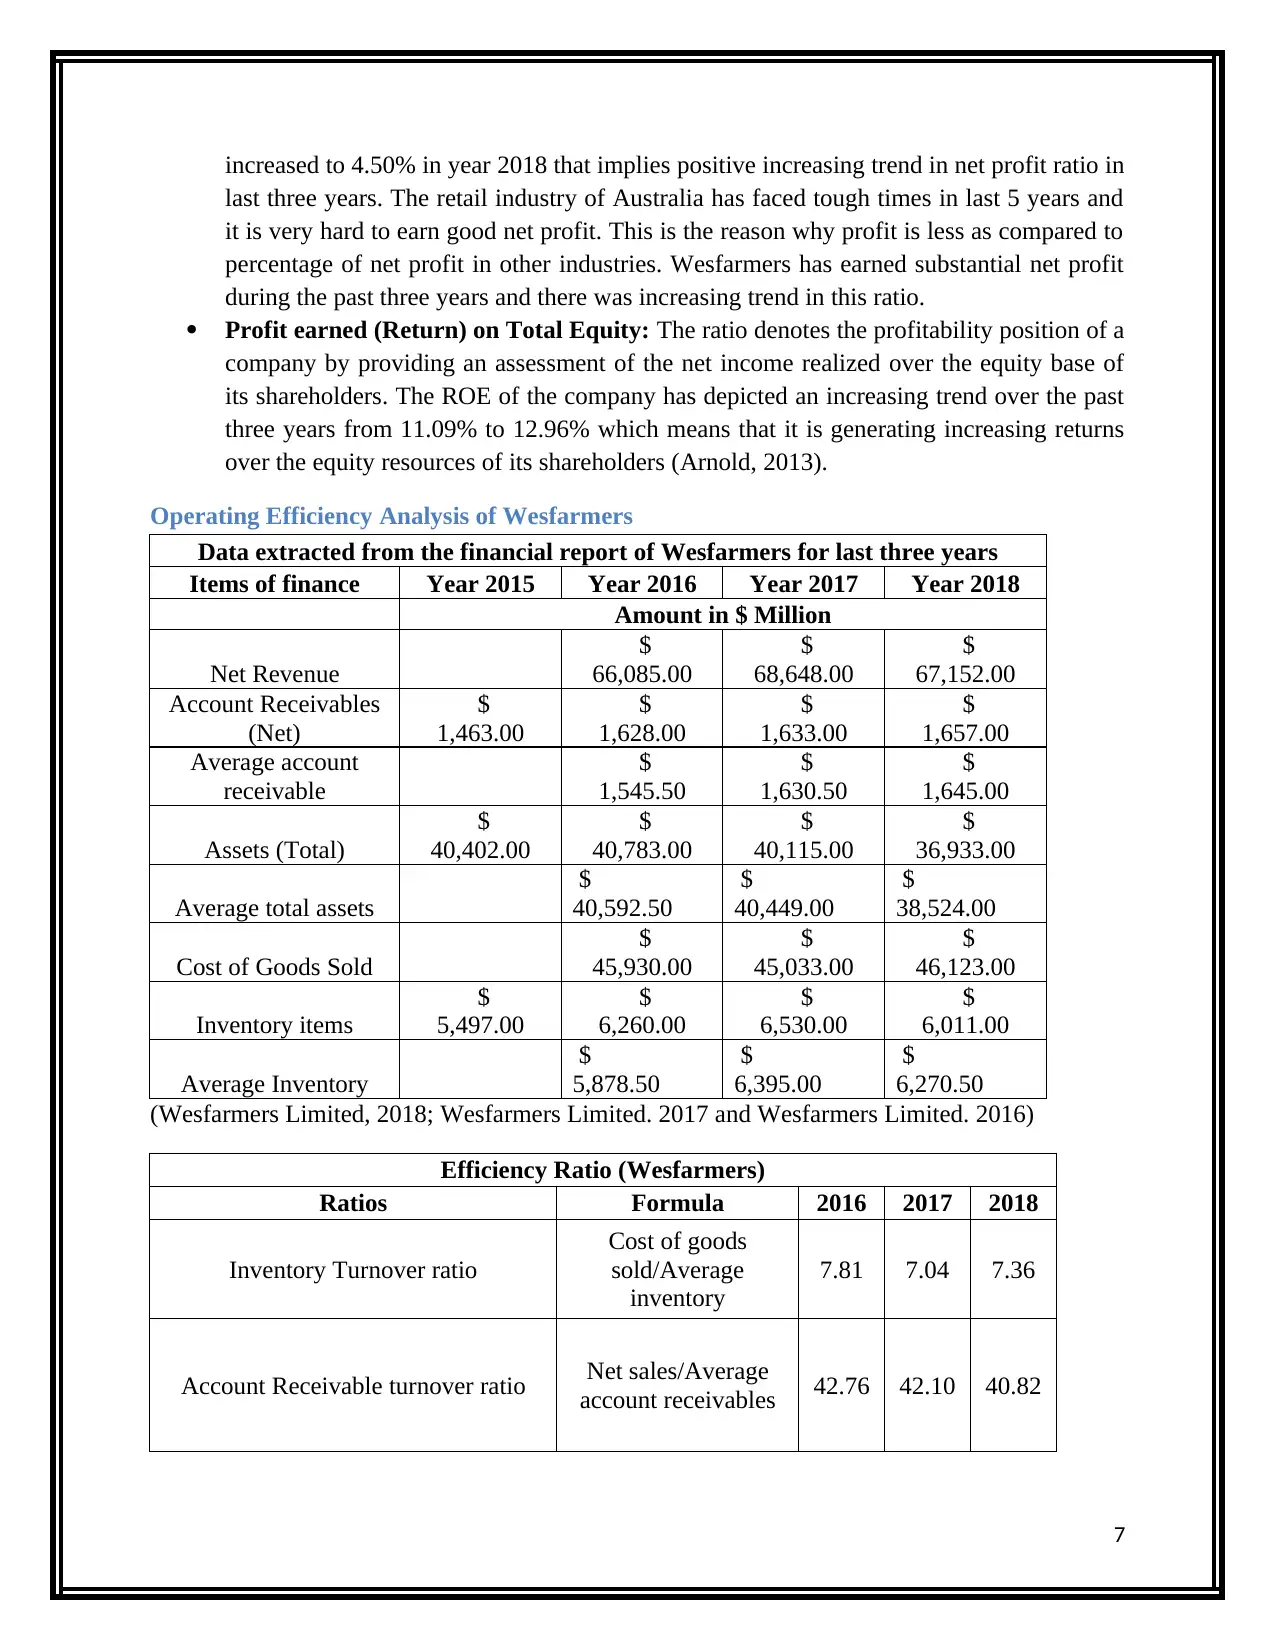
Efficiency Ratio (Wesfarmers)
Ratios Formula 2016 2017 2018
Inventory Turnover ratio
Cost of goods
sold/Average
inventory
7.81 7.04 7.36
Account Receivable turnover ratio Net sales/Average
account receivables 42.76 42.10 40.82
7
last three years. The retail industry of Australia has faced tough times in last 5 years and
it is very hard to earn good net profit. This is the reason why profit is less as compared to
percentage of net profit in other industries. Wesfarmers has earned substantial net profit
during the past three years and there was increasing trend in this ratio.
Profit earned (Return) on Total Equity: The ratio denotes the profitability position of a
company by providing an assessment of the net income realized over the equity base of
its shareholders. The ROE of the company has depicted an increasing trend over the past
three years from 11.09% to 12.96% which means that it is generating increasing returns
over the equity resources of its shareholders (Arnold, 2013).
Operating Efficiency Analysis of Wesfarmers
Data extracted from the financial report of Wesfarmers for last three years
Items of finance Year 2015 Year 2016 Year 2017 Year 2018
Amount in $ Million
Net Revenue
$
66,085.00
$
68,648.00
$
67,152.00
Account Receivables
(Net)
$
1,463.00
$
1,628.00
$
1,633.00
$
1,657.00
Average account
receivable
$
1,545.50
$
1,630.50
$
1,645.00
Assets (Total)
$
40,402.00
$
40,783.00
$
40,115.00
$
36,933.00
Average total assets
$
40,592.50
$
40,449.00
$
38,524.00
Cost of Goods Sold
$
45,930.00
$
45,033.00
$
46,123.00
Inventory items
$
5,497.00
$
6,260.00
$
6,530.00
$
6,011.00
Average Inventory
$
5,878.50
$
6,395.00
$
6,270.50
(Wesfarmers Limited, 2018; Wesfarmers Limited. 2017 and Wesfarmers Limited. 2016)
Efficiency Ratio (Wesfarmers)
Ratios Formula 2016 2017 2018
Inventory Turnover ratio
Cost of goods
sold/Average
inventory
7.81 7.04 7.36
Account Receivable turnover ratio Net sales/Average
account receivables 42.76 42.10 40.82
7
Paraphrase This Document
Need a fresh take? Get an instant paraphrase of this document with our AI Paraphraser
Asset Turnover ratio Net Sales/Average
total assets 1.63 1.70 1.74
2016 2017 2018
0.00
5.00
10.00
15.00
20.00
25.00
30.00
35.00
40.00
45.00
7.81 7.04 7.36
42.76 42.10 40.82
1.63 1.70 1.74
Effeciency Ratio of Wesfarmers
Times
Inventory Turnover ratio: The ratio depicts the efficiency a company to realize sales
from its inventory base. The ratio has depicted a decreasing trend from 7.81 to 7.36
which cannot be regarded as good for its future financial growth prospects. This is due to
decreeing ability of the company to replace inventory and realize sales. This would lead
to increasing the cost of goods sold and thus can have a negative impact on the long-term
profitability position of the company (Hitchner, 2011).
Account Receivable turnover ratio: It denotes the efficiency of a company to collect
payments over its outstanding invoices and bills. The ratio for Wesfarmers have also
depicted a decreasing trend from 42.76 to 40.82 over 2016-2018 which means that it
possess a liquidity risk of not able to realize cash from its accounts receivables in an
8
effective manner which can lead to reduction in its operational efficiency and thus long-
term profits,.
Asset Turnover ratio: The asset turnover ratio for the company has depicted an
increasing trend over the past three financial years from 1.63 to 1.74. The ratio is also
higher than 1 over the selected time-period which means that it possess good efficiency to
realize sales from the asset base (Baker and Powell, 2009).
Section 2.3: Use of marketable securities by Wesfarmers for cash management purpose
Marketable securities refer to the short term financial instruments that are easily
redeemable in the market and they can be easily brought and sold in the market. It means
maturity period of the marketable securities is less than 1 year. The purpose of using the
marketable securities is to make sure enough liquidated cash is available with the company that
can be used in one year time period to pay the current liabilities. Marketable securities can be
both debt securities and equity securities dependent upon the securities chosen by the company.
Investment in shares, bonds, and debentures are some of examples of marketable securities
(Krantz, 2016).
Wesfarmers Limited manages uses cash and cash equivalent such as capital market debt,
corporate bonds, financial instruments and other derivatives to manage their cash requirements.
All these marketable securities are being valued at fair value or carrying value depending upon
the value of marketable securities. So, it can be said that Wesfarmers make efficient use of
marketable securities to manage its cash requirements. Wesfarmers regularly trades in derivative
market and also in corporate bonds to get some benefit from the market. In addition to this
Wesfarmers have enough cash and cash equivalents to achieve the working capital requirements
(Wesfarmers Limited, 2018).
Section 2.4: Application of sensitivity analysis through using the capital budgeting scenario
Scenario Given
Total life of the project 4 Years
Initial Cost of Equipment
$
2,000,000.00
Residual Value of the equipment
$
200,000.00
Depreciation Method Straight Line
Equipment Life 4 Years
Depreciation each year
$
450,000.00
Working Capital required in year 0
$
600,000.00
Working capital recovered in year 4
Units sold
9
⊘ This is a preview!⊘
Do you want full access?
Subscribe today to unlock all pages.
Trusted by 1+ million students worldwide
Year 1 300000
Year 2 300000
Year 3 300000
Year 4 300000
Selling Price of product
$
20.00
Variable Cost of the product
$
12.00
Fixed Cost in each year
$
300,000.00
Discount Rate used to discount the cash flows 10%
Tax Rate 30%
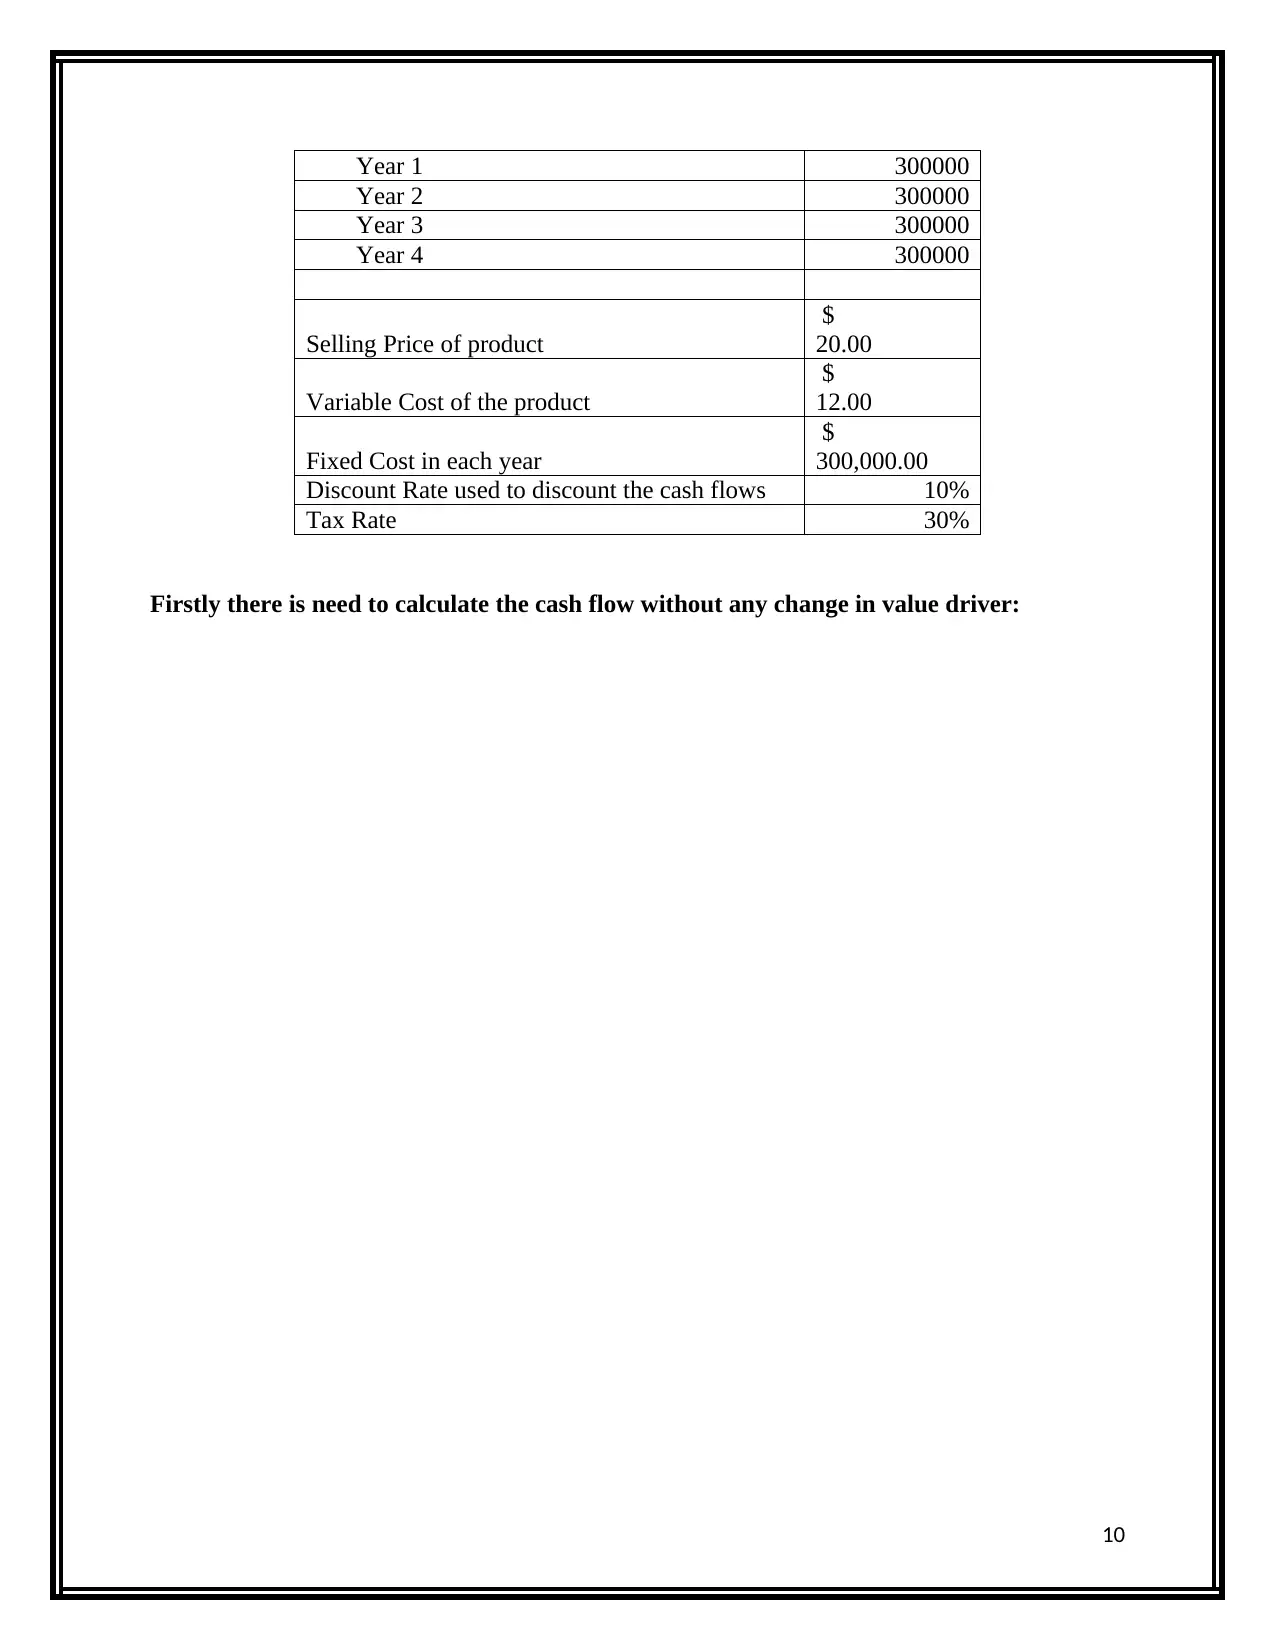
Firstly there is need to calculate the cash flow without any change in value driver:
10
Year 2 300000
Year 3 300000
Year 4 300000
Selling Price of product
$
20.00
Variable Cost of the product
$
12.00
Fixed Cost in each year
$
300,000.00
Discount Rate used to discount the cash flows 10%
Tax Rate 30%
Firstly there is need to calculate the cash flow without any change in value driver:
10
Paraphrase This Document
Need a fresh take? Get an instant paraphrase of this document with our AI Paraphraser

0 1 2 3 4
Cash Inflows
Units sold 300000 300000 300000 300000
Selling price 20$ 20$ 20$ 20$
Net Cash Inflows 6,000,000$ 6,000,000$ 6,000,000$ 6,000,000$
Cash Outflows
Variable Cost 3,600,000$ 3,600,000$ 3,600,000$ 3,600,000$
Fixed Cost 300,000$ 300,000$ 300,000$ 300,000$
Depreciation 450,000$ 450,000$ 450,000$ 450,000$
Total Cash outflows 4,350,000$ 4,350,000$ 4,350,000$ 4,350,000$
Cash flows before tax 1,650,000$ 1,650,000$ 1,650,000$ 1,650,000$
Less: Tax @ 30% 495,000$ 495,000$ 495,000$ 495,000$
Cash Flows after tax 1,155,000$ 1,155,000$ 1,155,000$ 1,155,000$
Add: Depreciation 450,000$ 450,000$ 450,000$ 450,000$
Cash Flows before
depreciation after tax 1,605,000$ 1,605,000$ 1,605,000$ 1,605,000$
Initial Equiment Cost (2,000,000)$
Salvage Value 200,000$
Working Capital
Initial Requirement (600,000)$
Recovery 600,000$
Net Cash Flows (2,600,000)$ 1,605,000$ 1,605,000$ 1,605,000$ 2,405,000$
PVF @ 10% 1.000 0.909 0.826 0.751 0.683
(2,600,000)$ 1,459,091$ 1,326,446$ 1,205,860$ 1,642,647$
Net Present Value 3,034,045$
Cash Flows during the life of the project in normal Case
Years
Particulars
11
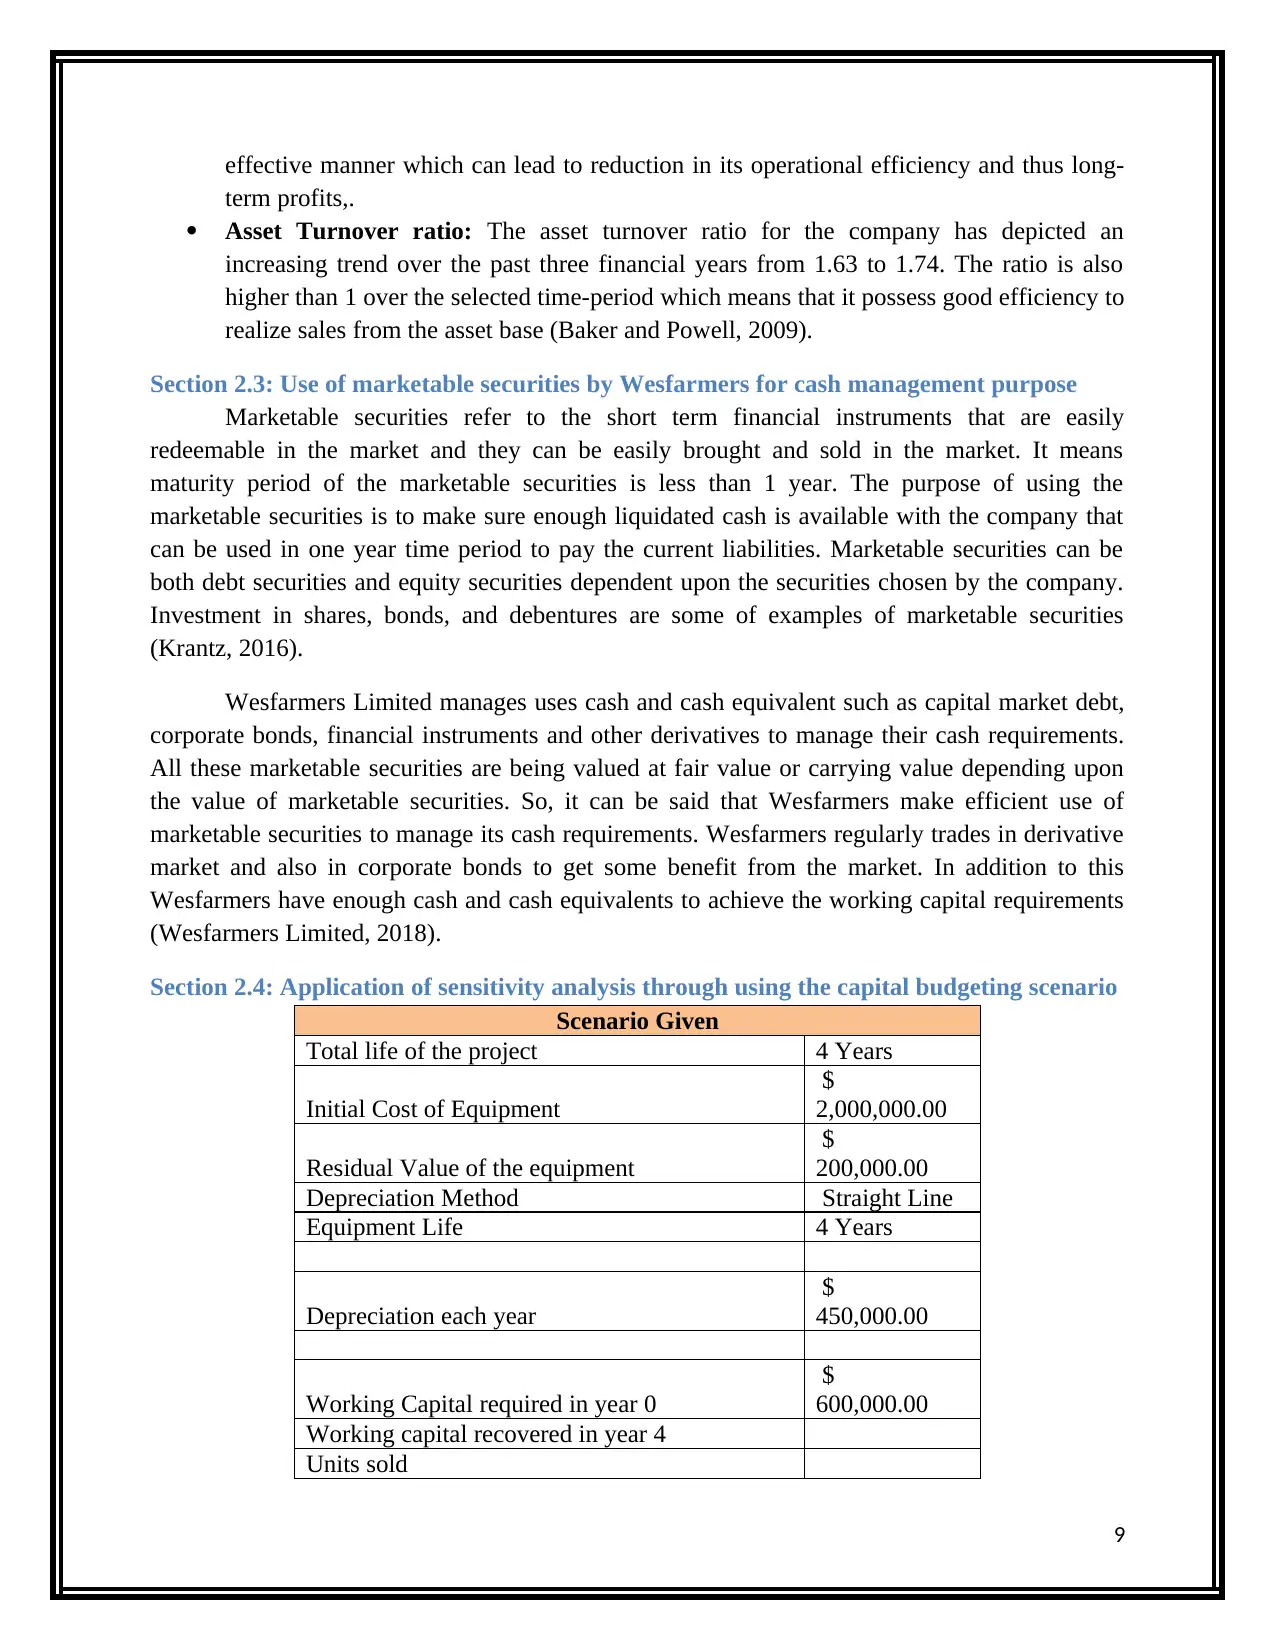
Sensitivity Case 1: When there is decrease in sales unit by 10%
0 1 2 3 4
Cash Inflows
Selling Units 270000 270000 270000 270000
Selling price 20.00$ 20.00$ 20.00$ 20.00$
Net Cash Inflows $5,400,000 $5,400,000 $5,400,000 $5,400,000
Cash Outflows
Variable Cost $3,240,000 $3,240,000 $3,240,000 $3,240,000
Fixed Cost $300,000 $300,000 $300,000 $300,000
Depreciation $450,000 $450,000 $450,000 $450,000
Total Cash outflows $3,990,000 $3,990,000 $3,990,000 $3,990,000
Cash flows before tax $1,410,000 $1,410,000 $1,410,000 $1,410,000
Less: Tax @ 30% $423,000 $423,000 $423,000 $423,000
Cash Flows after tax $987,000 $987,000 $987,000 $987,000
Add: Depreciation $450,000 $450,000 $450,000 $450,000
Cash Flows before
depreciation after tax $1,437,000 $1,437,000 $1,437,000 $1,437,000
Initial Equiment Cost (2,000,000)$
Salvage Value 200,000$
Working Capital
Initial Requirement (600,000)$
Recovery 600,000$
Net Cash Flows -$2,600,000 $1,437,000 $1,437,000 $1,437,000 $2,237,000
PVF @ 10% 1.000 0.909 0.826 0.751 0.683
(2,600,000)$ 1,306,364$ 1,187,603$ 1,079,639$ 1,527,901$
Net Present Value 2,501,507$
Statement of Cash flows when Unit sales decrease by 10%
Particulars Years
When the total units got decreased by 10% in each year then net present value has been
decreased to $ 2501507 as compared to net present value of $ 3034045 in normal case.
Sensitivity Case 2: When price per unit got decreased by 10% each year
12
⊘ This is a preview!⊘
Do you want full access?
Subscribe today to unlock all pages.
Trusted by 1+ million students worldwide
1 out of 20
Related Documents


Your All-in-One AI-Powered Toolkit for Academic Success.
+13062052269
info@desklib.com
Available 24*7 on WhatsApp / Email
![[object Object]](/_next/static/media/star-bottom.7253800d.svg)
Unlock your academic potential
Copyright © 2020–2026 A2Z Services. All Rights Reserved. Developed and managed by ZUCOL.