HI5003 - Examining the Trends of Unemployment in Australia (5 Years)
VerifiedAdded on 2024/04/25
|17
|3848
|90
Essay
AI Summary
This essay examines the unemployment rate trends in Australia over the past five years, highlighting key macroeconomic indicators and structural changes in the Australian economy. It discusses various types of unemployment, such as frictional, structural, and cyclical, and analyzes historical data and statistical representations to depict the variations in unemployment rates. The essay also includes a comparative analysis with the United Kingdom's unemployment data, evaluating the positive and negative impacts on both economies. Furthermore, it addresses Australia's youth unemployment rate and the impact of economic activities on jobless numbers. The analysis uses data from sources like the Australian Bureau of Statistics and Focus-Economics to provide a comprehensive overview of the unemployment situation in Australia.
Written Essay
(Topic - Unemployment in Australia last 5 years)
1
(Topic - Unemployment in Australia last 5 years)
1
Paraphrase This Document
Need a fresh take? Get an instant paraphrase of this document with our AI Paraphraser
Table of Contents
Essay Topic - Unemployment in Australia last 5 years.............................................................3
Discussing and analysing the research and the application.......................................................5
References................................................................................................................................17
2
Essay
Essay Topic - Unemployment in Australia last 5 years
In this essay and study, the past five-year trend of unemployment rate within Australia has
been discussed. Australia is among one of the rapidly growing economies and there are
various key macroeconomic performance indicators of it. Among various macroeconomic
indicators, the unemployment rate and trend have been shown in order to depict the
performance of Australia in last five years. For analysis of such thing, there are various
graphs, charts, figures, examples and many others have been used so as to generate the
reliable, authenticate and accurate results or outcome. The findings, analysis of various
research study and journal article has been made so those appropriate findings on the research
topic can be made. The conclusion has also been stated at the end of the essay which derives
the overall efficient meaning of the reported study.
Unemployment in Australia - According to the viewpoints and ideas of the author Chindamo
and Uren (2010), the unemployment refers to as the scourge among all of the countries
existing within each and every level of economic growth and development. It leads to
creating the poverty, disparity, and others from the on-going lifestyle of the human beings. In
addition to this, the Australian economy has gained of many experiences and observed a
major change in their structure. These changes are related to the technological up gradations,
increasing level of competitiveness, variations in the consumer consumption pattern and
behavior and many others. All of these changes have directly or indirectly impact on the
cause of unemployment in Australia (Chindamo and Uren, 2010).
The report study is aimed at analysing of the various trends and changes taking place in the
unemployment rate in Australia with the help of the statistical presentation.
3
⊘ This is a preview!⊘
Do you want full access?
Subscribe today to unlock all pages.
Trusted by 1+ million students worldwide
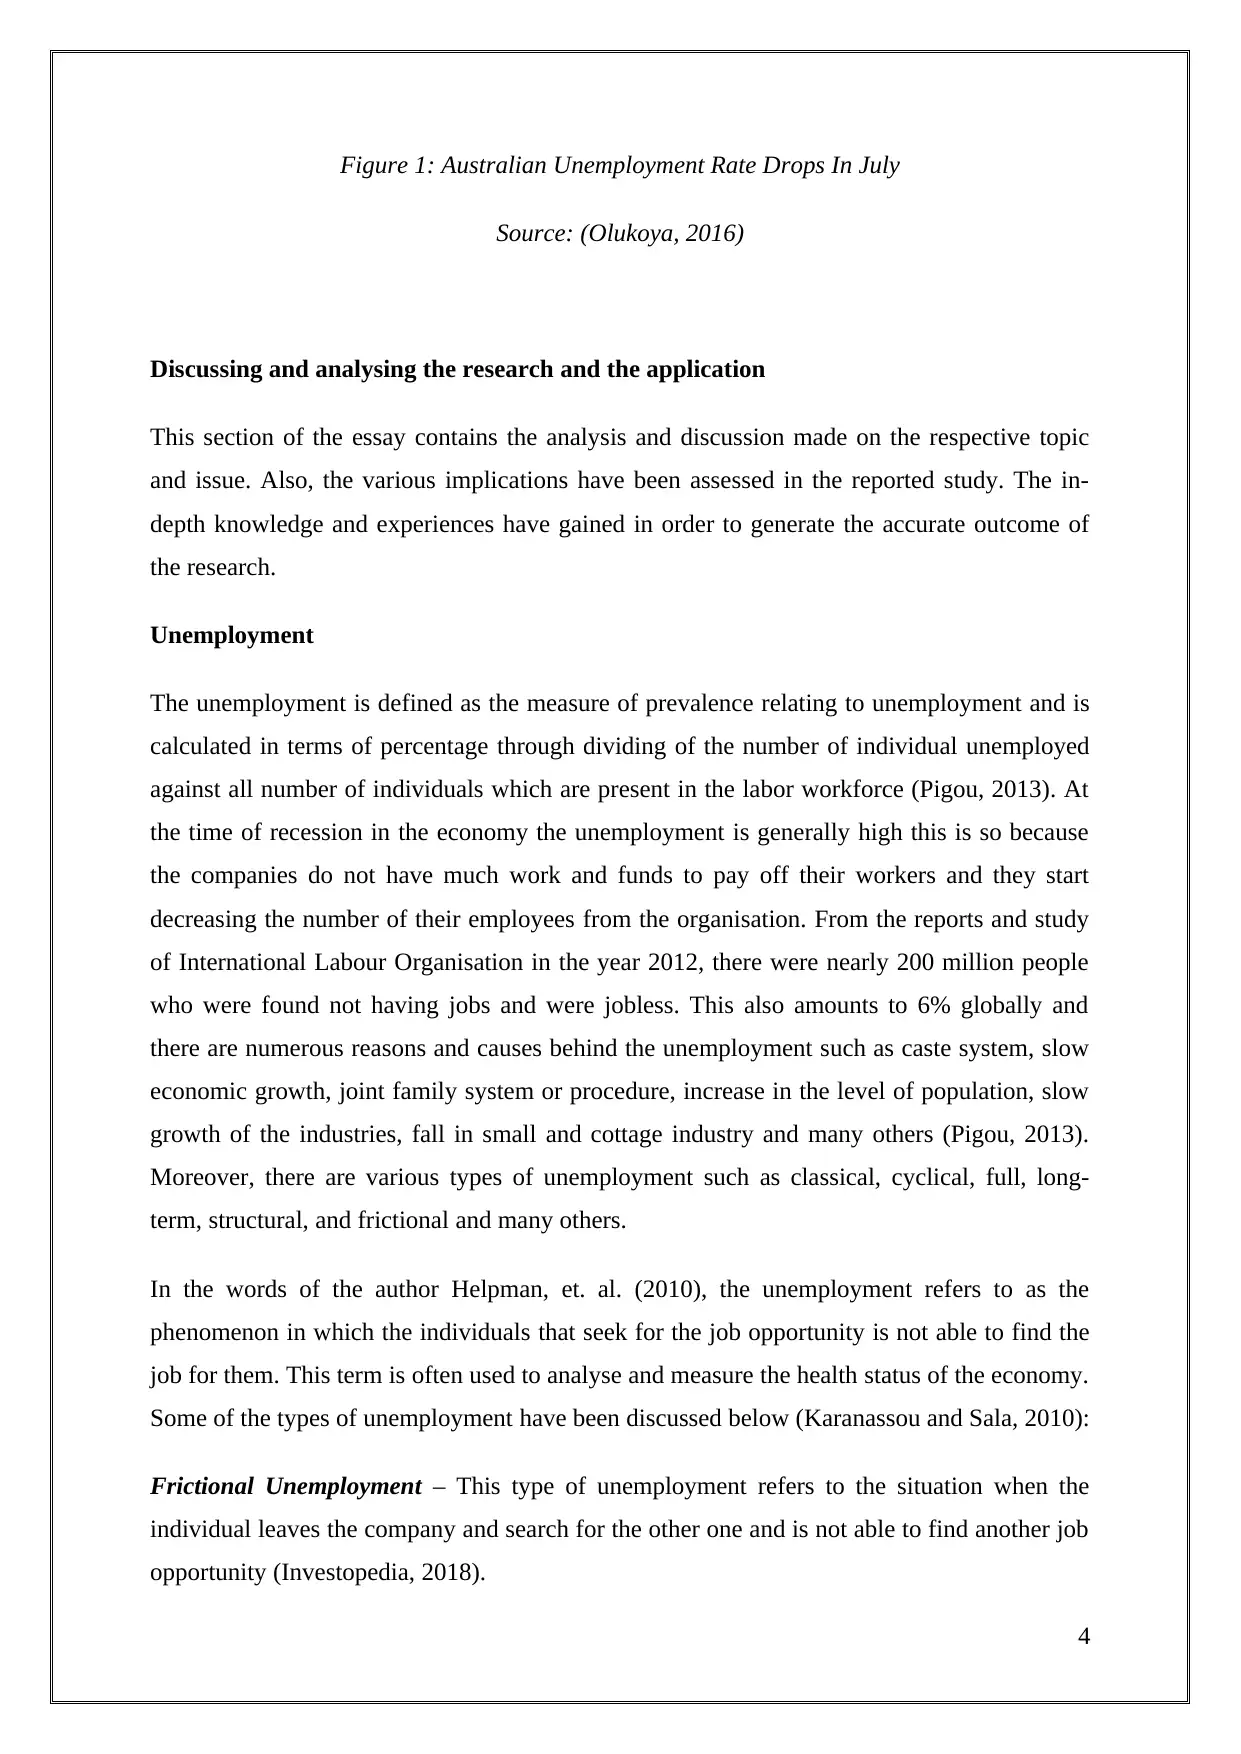
Figure 1: Australian Unemployment Rate Drops In July
Source: (Olukoya, 2016)
Discussing and analysing the research and the application
This section of the essay contains the analysis and discussion made on the respective topic
and issue. Also, the various implications have been assessed in the reported study. The in-
depth knowledge and experiences have gained in order to generate the accurate outcome of
the research.
Unemployment
The unemployment is defined as the measure of prevalence relating to unemployment and is
calculated in terms of percentage through dividing of the number of individual unemployed
against all number of individuals which are present in the labor workforce (Pigou, 2013). At
the time of recession in the economy the unemployment is generally high this is so because
the companies do not have much work and funds to pay off their workers and they start
decreasing the number of their employees from the organisation. From the reports and study
of International Labour Organisation in the year 2012, there were nearly 200 million people
who were found not having jobs and were jobless. This also amounts to 6% globally and
there are numerous reasons and causes behind the unemployment such as caste system, slow
economic growth, joint family system or procedure, increase in the level of population, slow
growth of the industries, fall in small and cottage industry and many others (Pigou, 2013).
Moreover, there are various types of unemployment such as classical, cyclical, full, long-
term, structural, and frictional and many others.
In the words of the author Helpman, et. al. (2010), the unemployment refers to as the
phenomenon in which the individuals that seek for the job opportunity is not able to find the
job for them. This term is often used to analyse and measure the health status of the economy.
Some of the types of unemployment have been discussed below (Karanassou and Sala, 2010):
Frictional Unemployment – This type of unemployment refers to the situation when the
individual leaves the company and search for the other one and is not able to find another job
opportunity (Investopedia, 2018).
4
Paraphrase This Document
Need a fresh take? Get an instant paraphrase of this document with our AI Paraphraser
Structural Unemployment – In this type of unemployment type the individuals are supposed
to leave their job because of their out-dated technological skills and knowledge. Due to the
technological advancements, the individuals lack to have the appropriate knowledge about
the learning and methods and have to leave their jobs (Chang, et. al., 2013).
Cyclical Unemployment – Such type of unemployment arises due to the business cycle such
as recession, depression, and others in which the growth rate of economy experiences a
downfall (Investopedia, 2018).
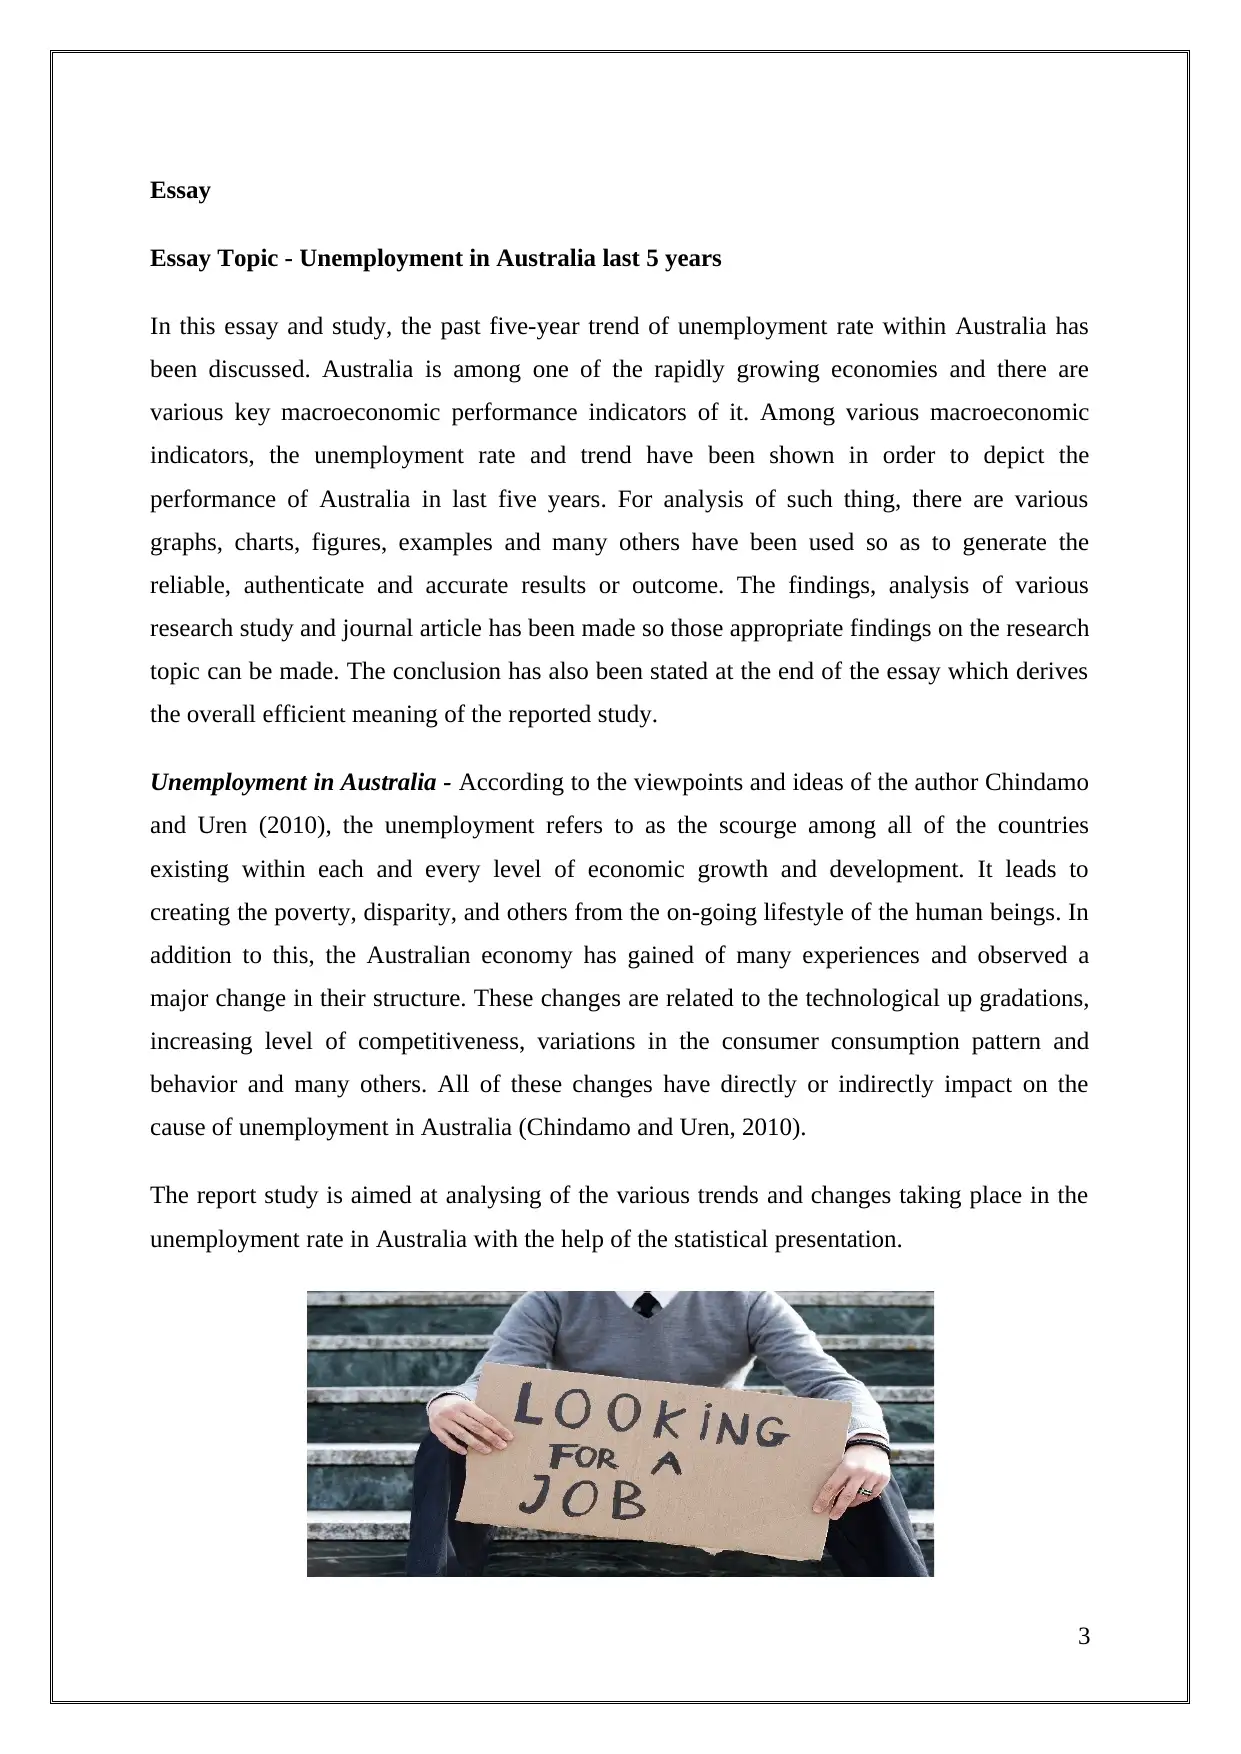
Figure 2: Kansas Dept. of Labor cracks down on unemployment fraud
Source: (Kan, 2017)
The unemployment in Australia has varied in the past few years and the recorded of 25 years
has also been observed as an example of the variations taking place in the unemployment.
Most of the workers in Australia belong to the male category and less number of female
workers is employed by the companies and also the women are paid less as compared to that
of males. For analysing the report in more authentic form the history of the unemployment
rate in Australia is shown below with the help of statistical graph.
Historical Graph
5
to leave their job because of their out-dated technological skills and knowledge. Due to the
technological advancements, the individuals lack to have the appropriate knowledge about
the learning and methods and have to leave their jobs (Chang, et. al., 2013).
Cyclical Unemployment – Such type of unemployment arises due to the business cycle such
as recession, depression, and others in which the growth rate of economy experiences a
downfall (Investopedia, 2018).
Figure 2: Kansas Dept. of Labor cracks down on unemployment fraud
Source: (Kan, 2017)
The unemployment in Australia has varied in the past few years and the recorded of 25 years
has also been observed as an example of the variations taking place in the unemployment.
Most of the workers in Australia belong to the male category and less number of female
workers is employed by the companies and also the women are paid less as compared to that
of males. For analysing the report in more authentic form the history of the unemployment
rate in Australia is shown below with the help of statistical graph.
Historical Graph
5
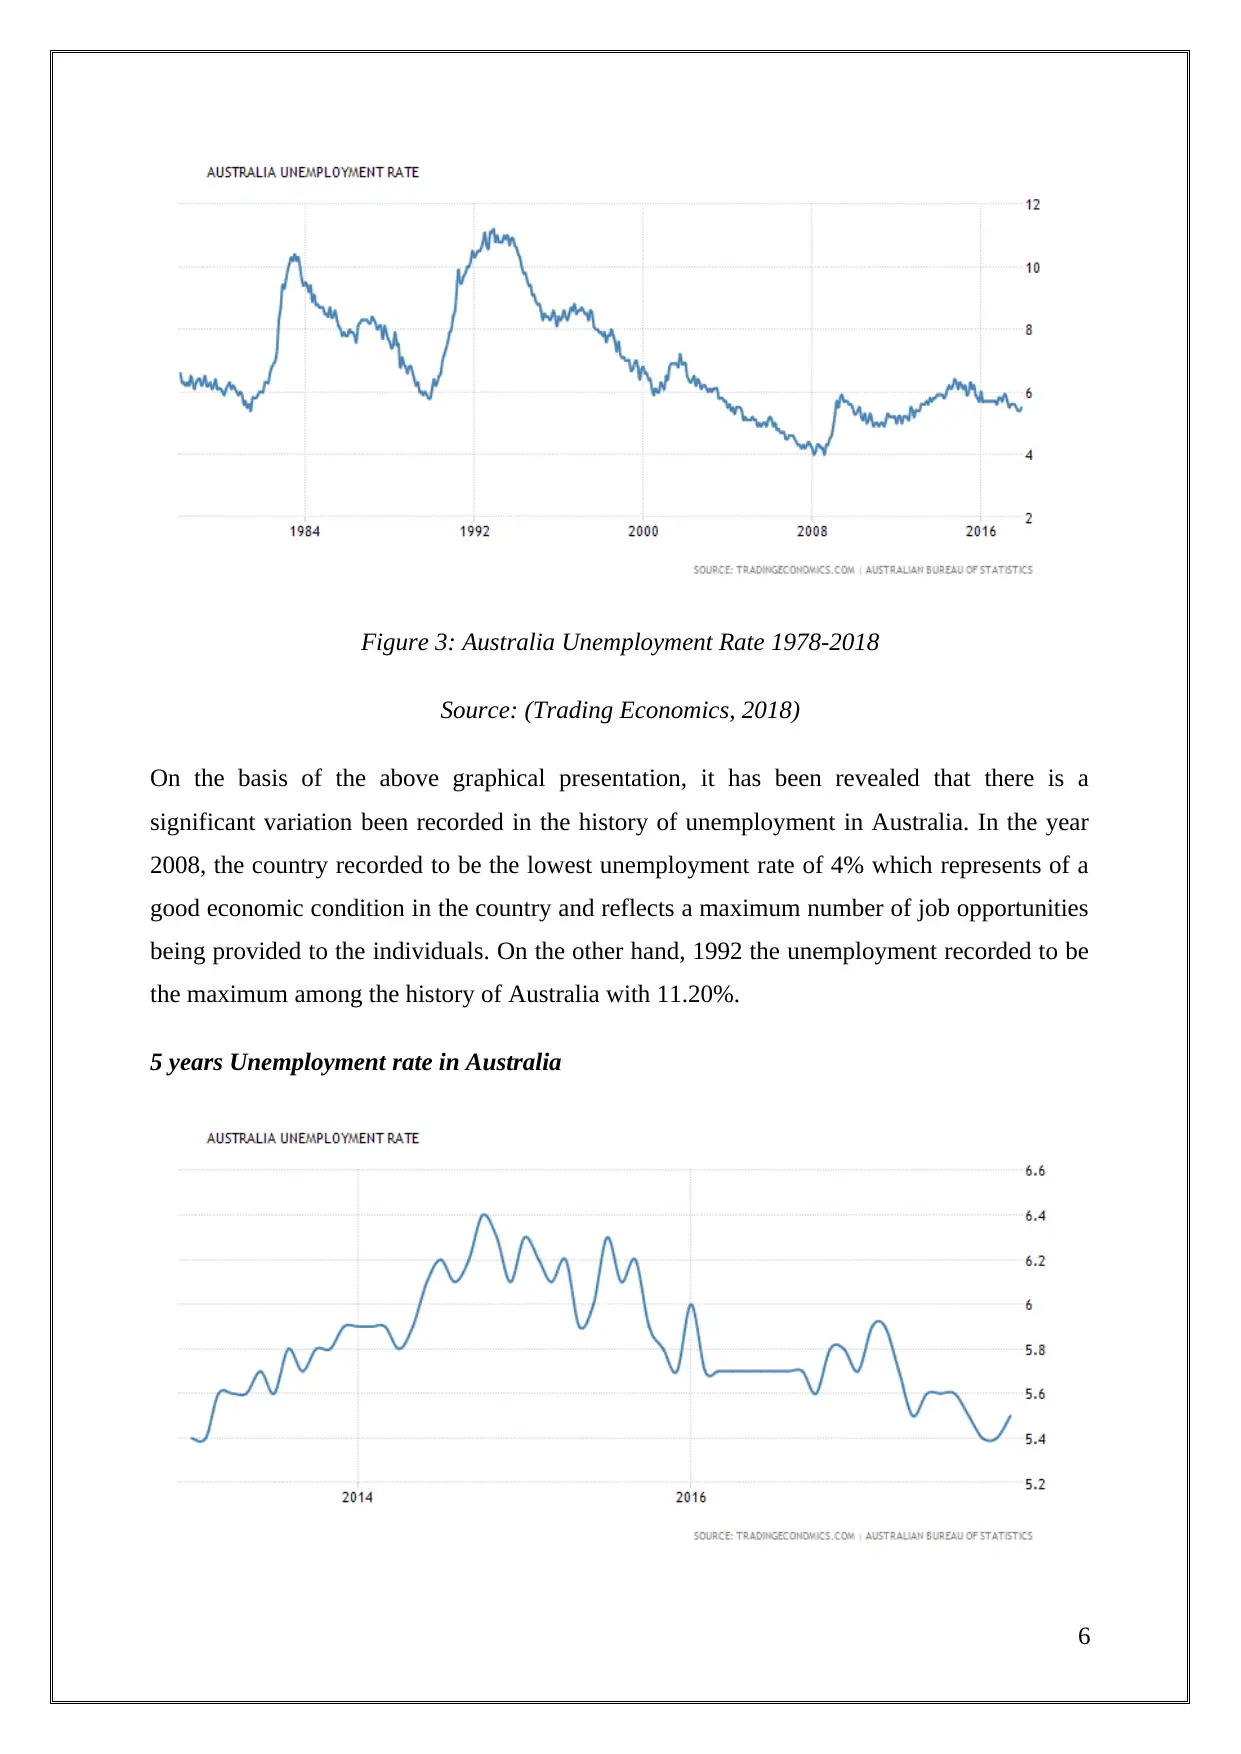
Figure 3: Australia Unemployment Rate 1978-2018
Source: (Trading Economics, 2018)
On the basis of the above graphical presentation, it has been revealed that there is a
significant variation been recorded in the history of unemployment in Australia. In the year
2008, the country recorded to be the lowest unemployment rate of 4% which represents of a
good economic condition in the country and reflects a maximum number of job opportunities
being provided to the individuals. On the other hand, 1992 the unemployment recorded to be
the maximum among the history of Australia with 11.20%.
5 years Unemployment rate in Australia
6
⊘ This is a preview!⊘
Do you want full access?
Subscribe today to unlock all pages.
Trusted by 1+ million students worldwide
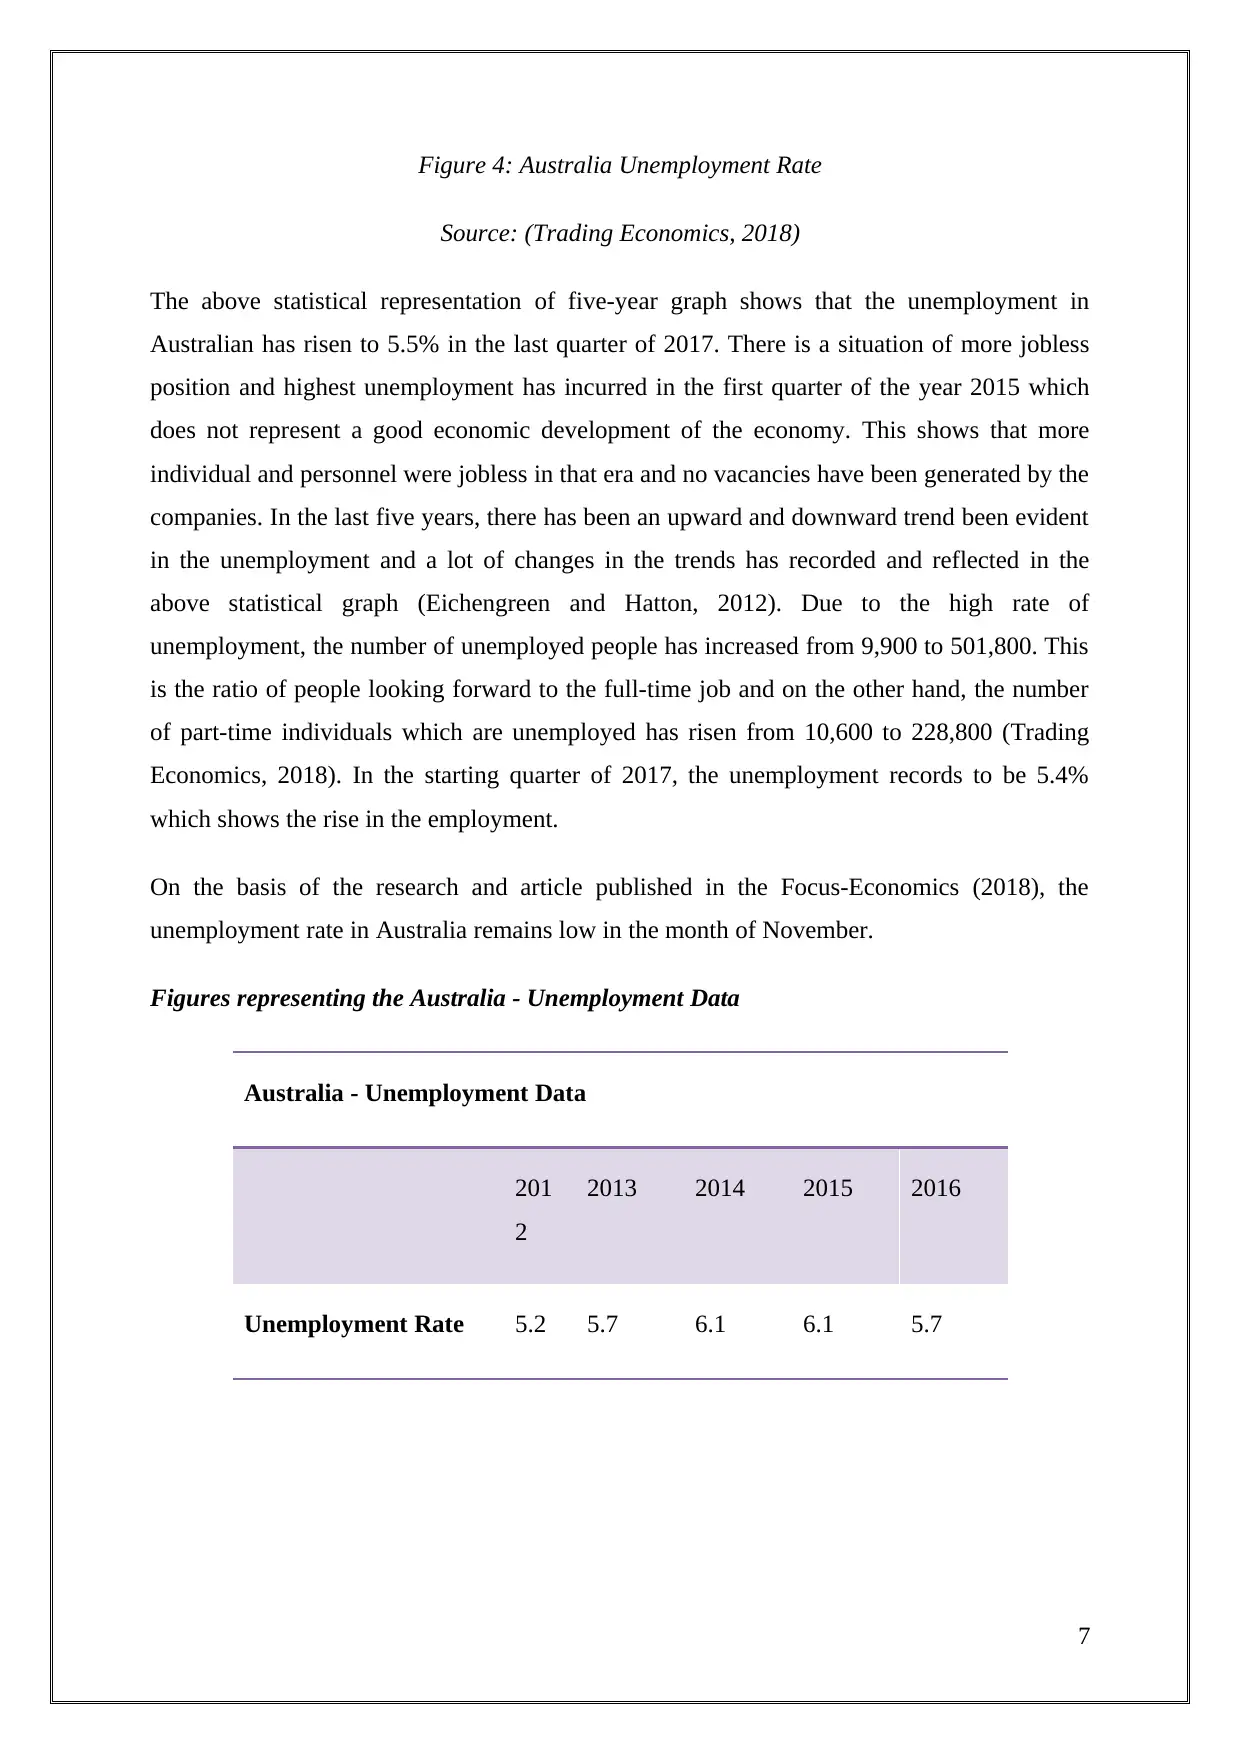
Figure 4: Australia Unemployment Rate
Source: (Trading Economics, 2018)
The above statistical representation of five-year graph shows that the unemployment in
Australian has risen to 5.5% in the last quarter of 2017. There is a situation of more jobless
position and highest unemployment has incurred in the first quarter of the year 2015 which
does not represent a good economic development of the economy. This shows that more
individual and personnel were jobless in that era and no vacancies have been generated by the
companies. In the last five years, there has been an upward and downward trend been evident
in the unemployment and a lot of changes in the trends has recorded and reflected in the
above statistical graph (Eichengreen and Hatton, 2012). Due to the high rate of
unemployment, the number of unemployed people has increased from 9,900 to 501,800. This
is the ratio of people looking forward to the full-time job and on the other hand, the number
of part-time individuals which are unemployed has risen from 10,600 to 228,800 (Trading
Economics, 2018). In the starting quarter of 2017, the unemployment records to be 5.4%
which shows the rise in the employment.
On the basis of the research and article published in the Focus-Economics (2018), the
unemployment rate in Australia remains low in the month of November.
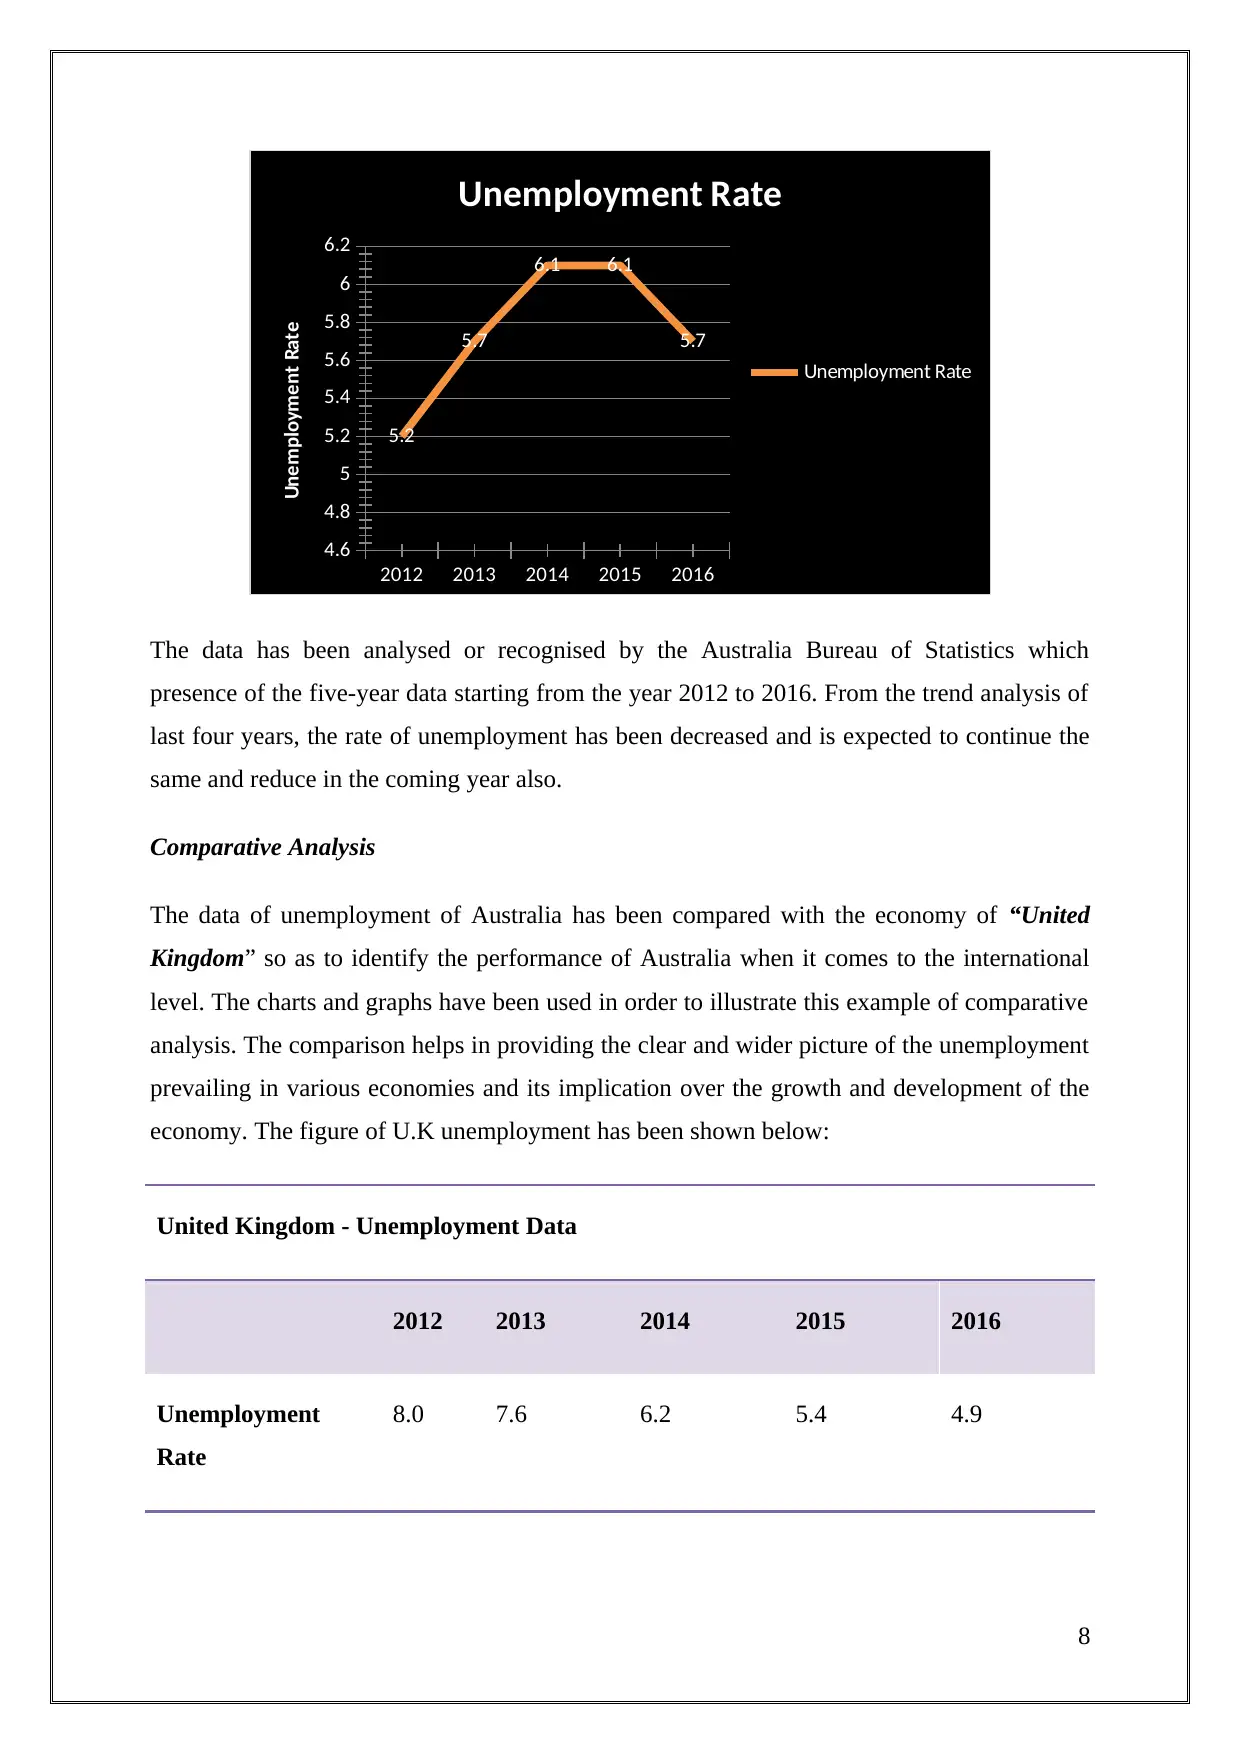
Figures representing the Australia - Unemployment Data
Australia - Unemployment Data
201
2
2013 2014 2015 2016
Unemployment Rate 5.2 5.7 6.1 6.1 5.7
7
Source: (Trading Economics, 2018)
The above statistical representation of five-year graph shows that the unemployment in
Australian has risen to 5.5% in the last quarter of 2017. There is a situation of more jobless
position and highest unemployment has incurred in the first quarter of the year 2015 which
does not represent a good economic development of the economy. This shows that more
individual and personnel were jobless in that era and no vacancies have been generated by the
companies. In the last five years, there has been an upward and downward trend been evident
in the unemployment and a lot of changes in the trends has recorded and reflected in the
above statistical graph (Eichengreen and Hatton, 2012). Due to the high rate of
unemployment, the number of unemployed people has increased from 9,900 to 501,800. This
is the ratio of people looking forward to the full-time job and on the other hand, the number
of part-time individuals which are unemployed has risen from 10,600 to 228,800 (Trading
Economics, 2018). In the starting quarter of 2017, the unemployment records to be 5.4%
which shows the rise in the employment.
On the basis of the research and article published in the Focus-Economics (2018), the
unemployment rate in Australia remains low in the month of November.
Figures representing the Australia - Unemployment Data
Australia - Unemployment Data
201
2
2013 2014 2015 2016
Unemployment Rate 5.2 5.7 6.1 6.1 5.7
7
Paraphrase This Document
Need a fresh take? Get an instant paraphrase of this document with our AI Paraphraser
2012 2013 2014 2015 2016
4.6
4.8
5
5.2
5.4
5.6
5.8
6
6.2
5.2
5.7
6.1 6.1
5.7
Unemployment Rate
Unemployment Rate
Unemployment Rate
The data has been analysed or recognised by the Australia Bureau of Statistics which
presence of the five-year data starting from the year 2012 to 2016. From the trend analysis of
last four years, the rate of unemployment has been decreased and is expected to continue the
same and reduce in the coming year also.
Comparative Analysis
The data of unemployment of Australia has been compared with the economy of “United
Kingdom” so as to identify the performance of Australia when it comes to the international
level. The charts and graphs have been used in order to illustrate this example of comparative
analysis. The comparison helps in providing the clear and wider picture of the unemployment
prevailing in various economies and its implication over the growth and development of the
economy. The figure of U.K unemployment has been shown below:
United Kingdom - Unemployment Data
2012 2013 2014 2015 2016
Unemployment
Rate
8.0 7.6 6.2 5.4 4.9
8
2012 2013 2014 2015 2016
0
1
2
3
4
5
6
7
8
9
8 7.6
6.2
5.4 4.9
Unemployment Rate
Unemployment Rate
Unemployment Rate
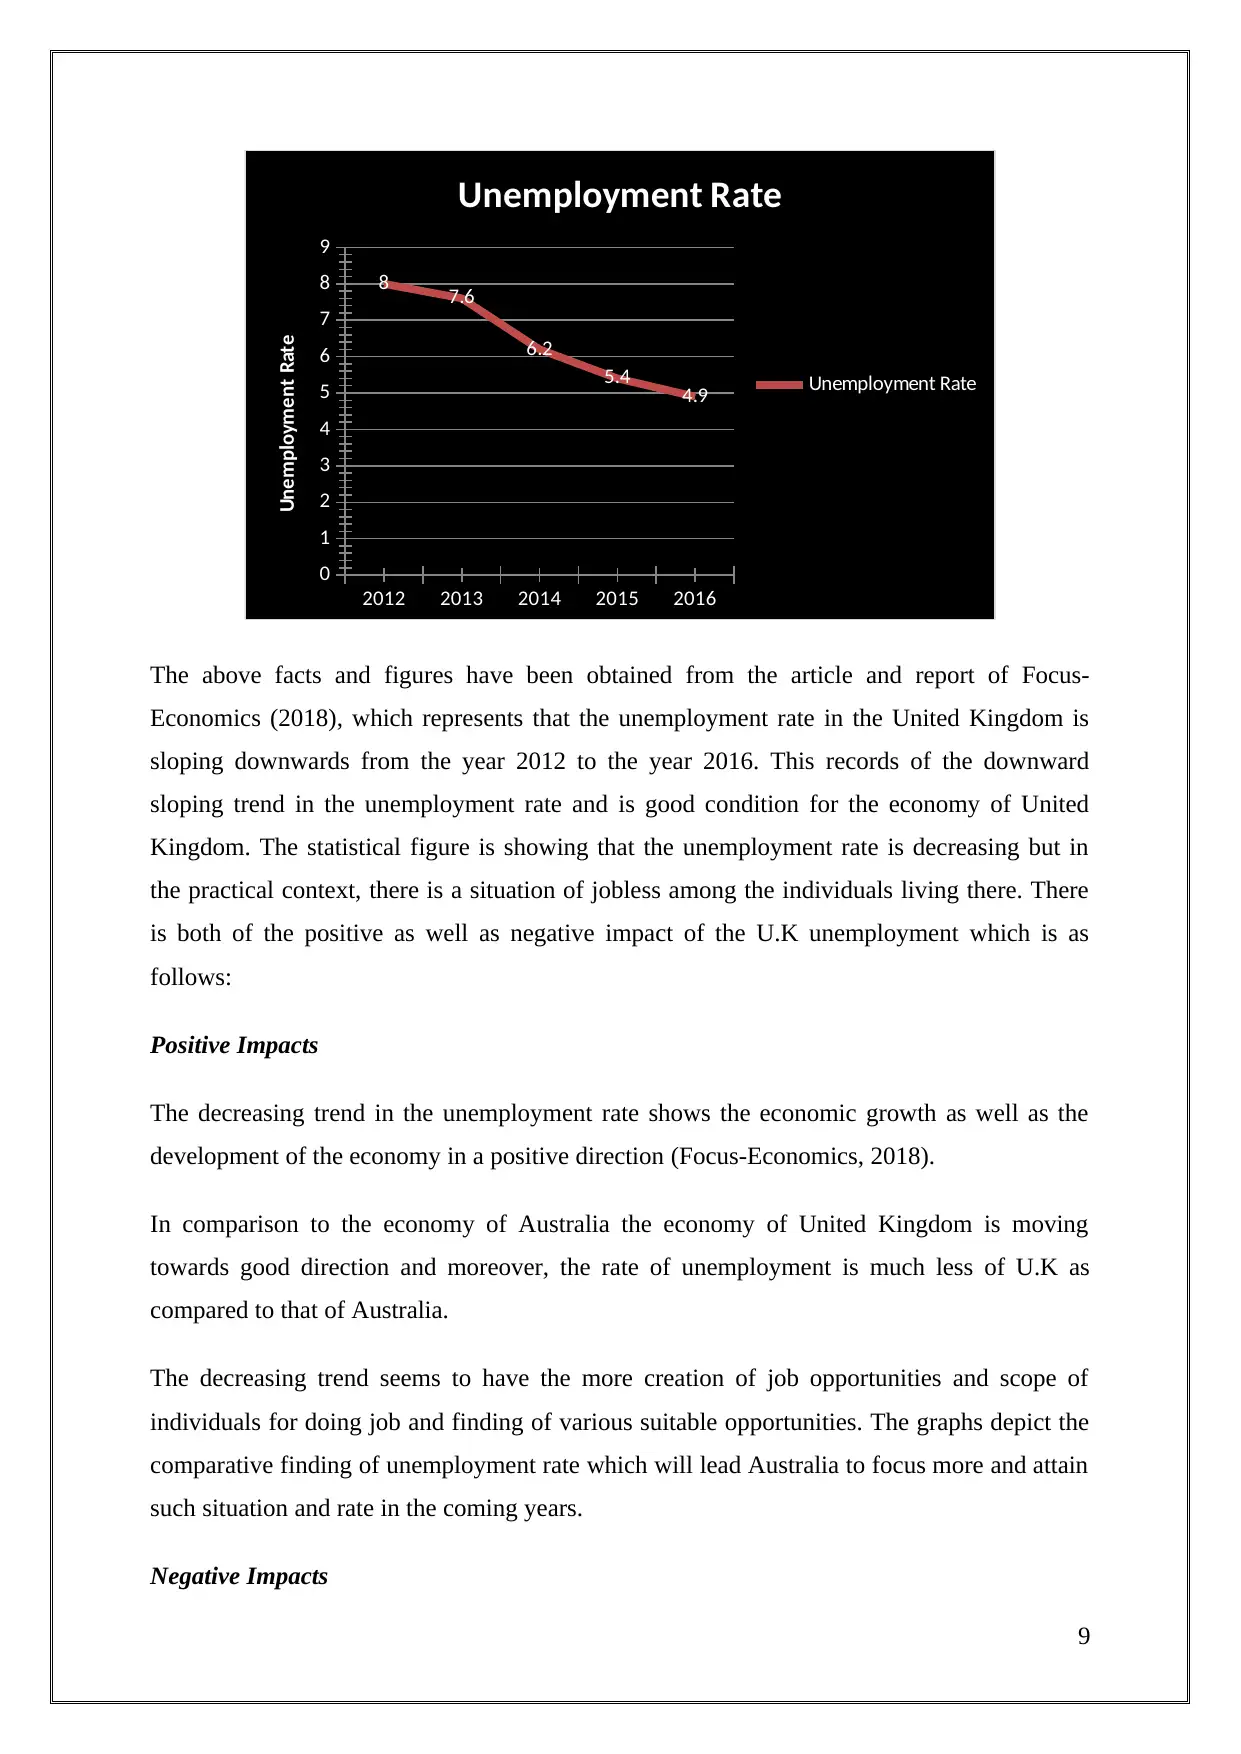
The above facts and figures have been obtained from the article and report of Focus-
Economics (2018), which represents that the unemployment rate in the United Kingdom is
sloping downwards from the year 2012 to the year 2016. This records of the downward
sloping trend in the unemployment rate and is good condition for the economy of United
Kingdom. The statistical figure is showing that the unemployment rate is decreasing but in
the practical context, there is a situation of jobless among the individuals living there. There
is both of the positive as well as negative impact of the U.K unemployment which is as
follows:
Positive Impacts
The decreasing trend in the unemployment rate shows the economic growth as well as the
development of the economy in a positive direction (Focus-Economics, 2018).
In comparison to the economy of Australia the economy of United Kingdom is moving
towards good direction and moreover, the rate of unemployment is much less of U.K as
compared to that of Australia.
The decreasing trend seems to have the more creation of job opportunities and scope of
individuals for doing job and finding of various suitable opportunities. The graphs depict the
comparative finding of unemployment rate which will lead Australia to focus more and attain
such situation and rate in the coming years.
Negative Impacts
9
0
1
2
3
4
5
6
7
8
9
8 7.6
6.2
5.4 4.9
Unemployment Rate
Unemployment Rate
Unemployment Rate
The above facts and figures have been obtained from the article and report of Focus-
Economics (2018), which represents that the unemployment rate in the United Kingdom is
sloping downwards from the year 2012 to the year 2016. This records of the downward
sloping trend in the unemployment rate and is good condition for the economy of United
Kingdom. The statistical figure is showing that the unemployment rate is decreasing but in
the practical context, there is a situation of jobless among the individuals living there. There
is both of the positive as well as negative impact of the U.K unemployment which is as
follows:
Positive Impacts
The decreasing trend in the unemployment rate shows the economic growth as well as the
development of the economy in a positive direction (Focus-Economics, 2018).
In comparison to the economy of Australia the economy of United Kingdom is moving
towards good direction and moreover, the rate of unemployment is much less of U.K as
compared to that of Australia.
The decreasing trend seems to have the more creation of job opportunities and scope of
individuals for doing job and finding of various suitable opportunities. The graphs depict the
comparative finding of unemployment rate which will lead Australia to focus more and attain
such situation and rate in the coming years.
Negative Impacts
9
⊘ This is a preview!⊘
Do you want full access?
Subscribe today to unlock all pages.
Trusted by 1+ million students worldwide
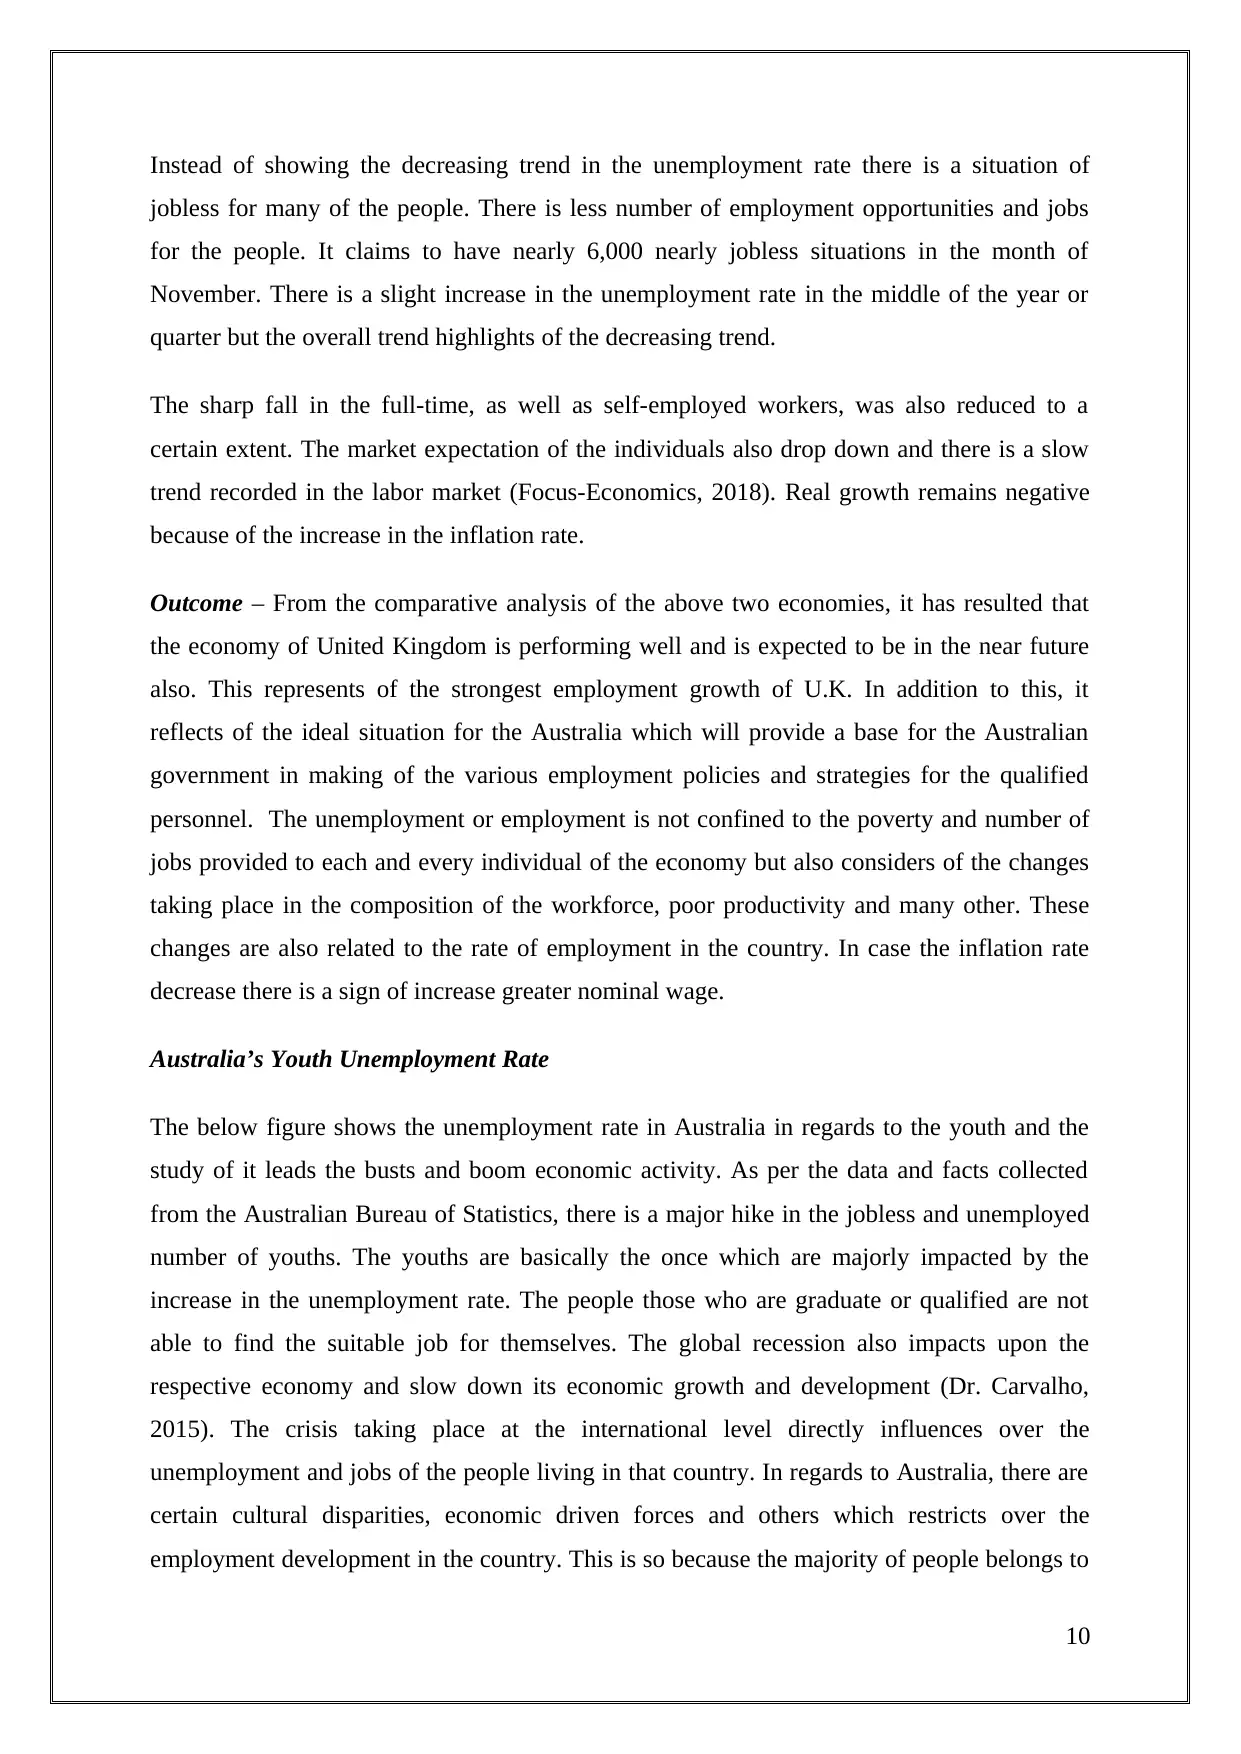
Instead of showing the decreasing trend in the unemployment rate there is a situation of
jobless for many of the people. There is less number of employment opportunities and jobs
for the people. It claims to have nearly 6,000 nearly jobless situations in the month of
November. There is a slight increase in the unemployment rate in the middle of the year or
quarter but the overall trend highlights of the decreasing trend.
The sharp fall in the full-time, as well as self-employed workers, was also reduced to a
certain extent. The market expectation of the individuals also drop down and there is a slow
trend recorded in the labor market (Focus-Economics, 2018). Real growth remains negative
because of the increase in the inflation rate.
Outcome – From the comparative analysis of the above two economies, it has resulted that
the economy of United Kingdom is performing well and is expected to be in the near future
also. This represents of the strongest employment growth of U.K. In addition to this, it
reflects of the ideal situation for the Australia which will provide a base for the Australian
government in making of the various employment policies and strategies for the qualified
personnel. The unemployment or employment is not confined to the poverty and number of
jobs provided to each and every individual of the economy but also considers of the changes
taking place in the composition of the workforce, poor productivity and many other. These
changes are also related to the rate of employment in the country. In case the inflation rate
decrease there is a sign of increase greater nominal wage.
Australia’s Youth Unemployment Rate
The below figure shows the unemployment rate in Australia in regards to the youth and the
study of it leads the busts and boom economic activity. As per the data and facts collected
from the Australian Bureau of Statistics, there is a major hike in the jobless and unemployed
number of youths. The youths are basically the once which are majorly impacted by the
increase in the unemployment rate. The people those who are graduate or qualified are not
able to find the suitable job for themselves. The global recession also impacts upon the
respective economy and slow down its economic growth and development (Dr. Carvalho,
2015). The crisis taking place at the international level directly influences over the
unemployment and jobs of the people living in that country. In regards to Australia, there are
certain cultural disparities, economic driven forces and others which restricts over the
employment development in the country. This is so because the majority of people belongs to
10
Paraphrase This Document
Need a fresh take? Get an instant paraphrase of this document with our AI Paraphraser
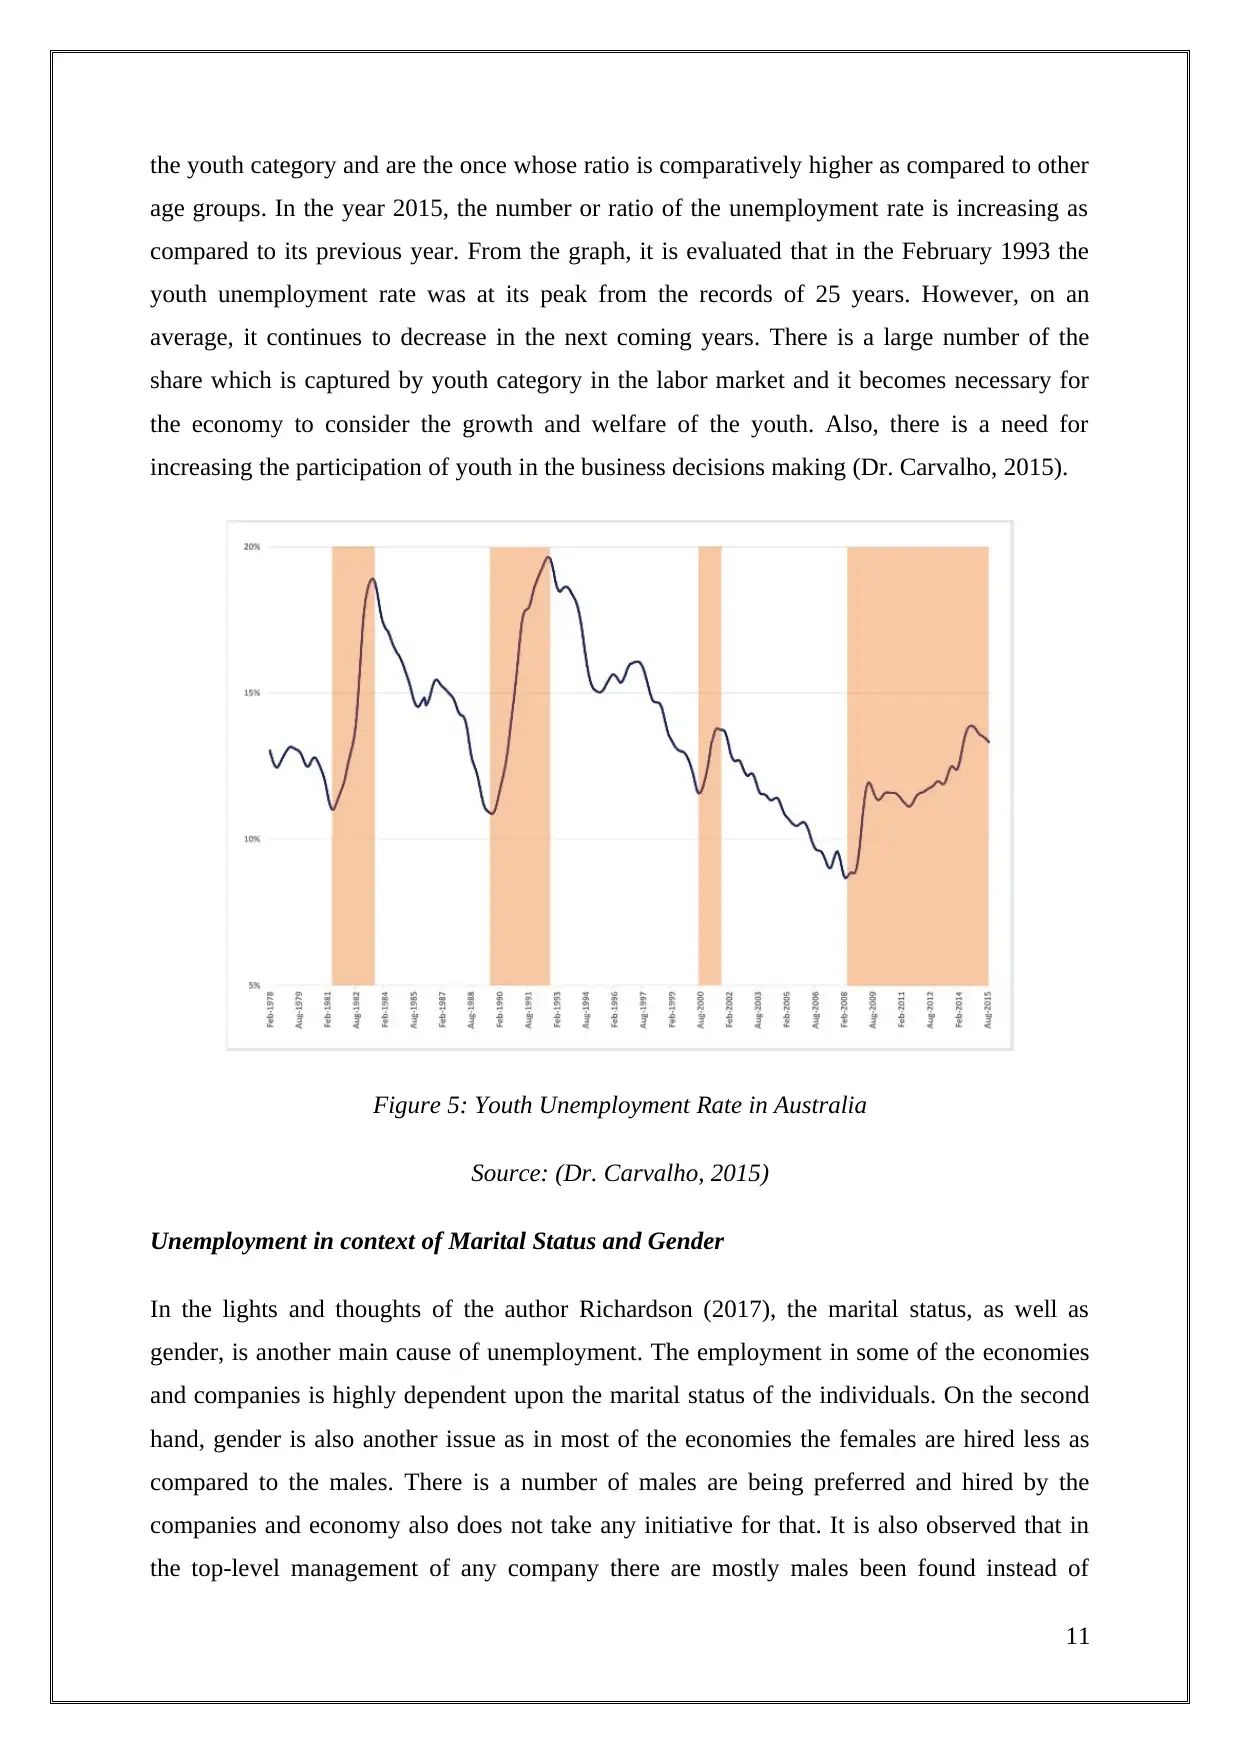
the youth category and are the once whose ratio is comparatively higher as compared to other
age groups. In the year 2015, the number or ratio of the unemployment rate is increasing as
compared to its previous year. From the graph, it is evaluated that in the February 1993 the
youth unemployment rate was at its peak from the records of 25 years. However, on an
average, it continues to decrease in the next coming years. There is a large number of the
share which is captured by youth category in the labor market and it becomes necessary for
the economy to consider the growth and welfare of the youth. Also, there is a need for
increasing the participation of youth in the business decisions making (Dr. Carvalho, 2015).
Figure 5: Youth Unemployment Rate in Australia
Source: (Dr. Carvalho, 2015)
Unemployment in context of Marital Status and Gender
In the lights and thoughts of the author Richardson (2017), the marital status, as well as
gender, is another main cause of unemployment. The employment in some of the economies
and companies is highly dependent upon the marital status of the individuals. On the second
hand, gender is also another issue as in most of the economies the females are hired less as
compared to the males. There is a number of males are being preferred and hired by the
companies and economy also does not take any initiative for that. It is also observed that in
the top-level management of any company there are mostly males been found instead of
11
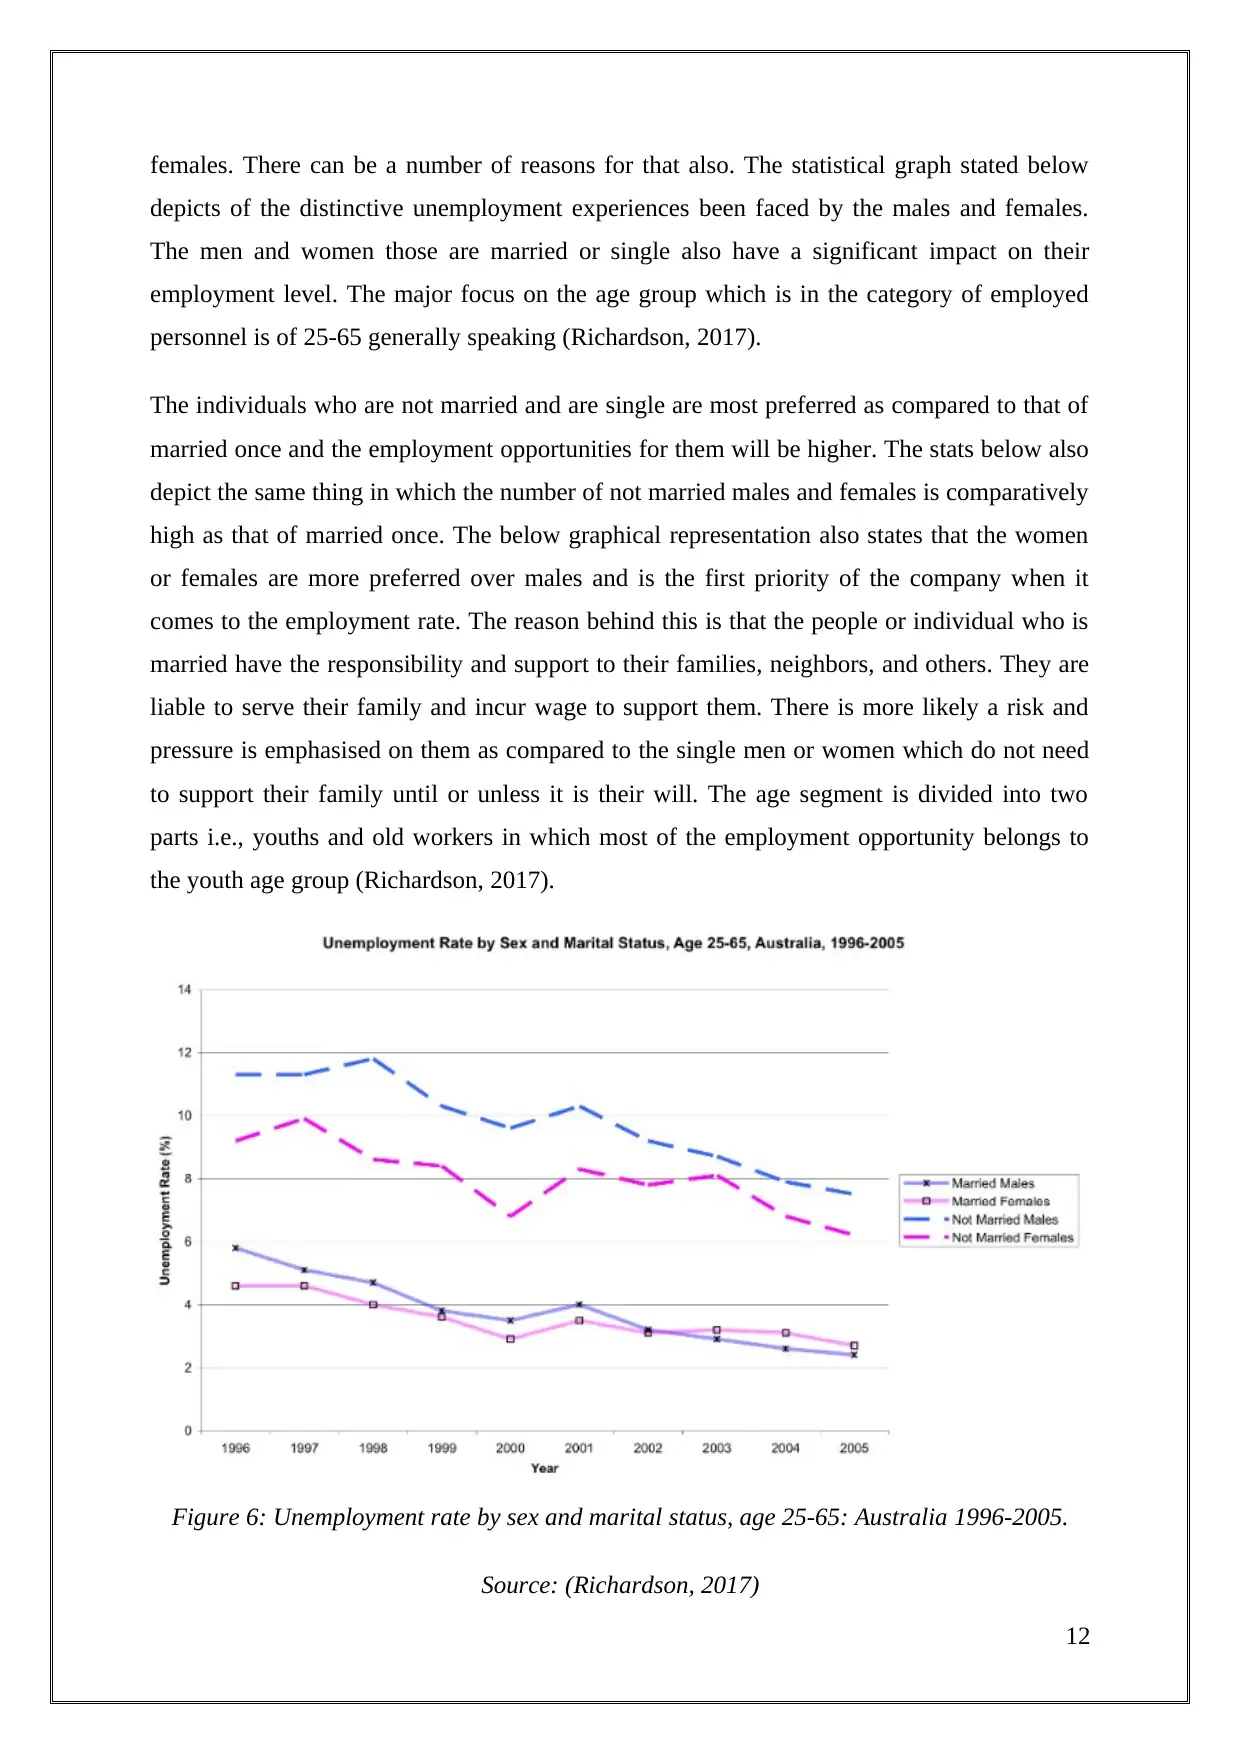
females. There can be a number of reasons for that also. The statistical graph stated below
depicts of the distinctive unemployment experiences been faced by the males and females.
The men and women those are married or single also have a significant impact on their
employment level. The major focus on the age group which is in the category of employed
personnel is of 25-65 generally speaking (Richardson, 2017).
The individuals who are not married and are single are most preferred as compared to that of
married once and the employment opportunities for them will be higher. The stats below also
depict the same thing in which the number of not married males and females is comparatively
high as that of married once. The below graphical representation also states that the women
or females are more preferred over males and is the first priority of the company when it
comes to the employment rate. The reason behind this is that the people or individual who is
married have the responsibility and support to their families, neighbors, and others. They are
liable to serve their family and incur wage to support them. There is more likely a risk and
pressure is emphasised on them as compared to the single men or women which do not need
to support their family until or unless it is their will. The age segment is divided into two
parts i.e., youths and old workers in which most of the employment opportunity belongs to
the youth age group (Richardson, 2017).
Figure 6: Unemployment rate by sex and marital status, age 25-65: Australia 1996-2005.
Source: (Richardson, 2017)
12
⊘ This is a preview!⊘
Do you want full access?
Subscribe today to unlock all pages.
Trusted by 1+ million students worldwide
1 out of 17
Related Documents


Your All-in-One AI-Powered Toolkit for Academic Success.
+13062052269
info@desklib.com
Available 24*7 on WhatsApp / Email
![[object Object]](/_next/static/media/star-bottom.7253800d.svg)
Unlock your academic potential
Copyright © 2020–2026 A2Z Services. All Rights Reserved. Developed and managed by ZUCOL.