HI5020 Corporate Accounting: A Financial Report on CBA and Westpac
VerifiedAdded on 2023/06/03
|23
|4410
|498
Report
AI Summary
This report provides a comparative financial analysis of two major Australian banks, Commonwealth Bank (CBA) and Westpac, focusing on their equity structure, cash flow statements, comprehensive income, and corporate income tax. The analysis includes a detailed discussion of each equity item, a comparison of debt and equity ratios, and an examination of cash flow activities over three years. It also covers items reported in the Other Comprehensive Income (OCI) statement, the effective income tax rate, deferred tax assets and liabilities, and the calculation of cash tax using book tax. The report concludes with a summary of the key differences and similarities between the two banks' financial performances. Find more solved assignments and study resources on Desklib.

CORPORATE ACCOUNTING
Paraphrase This Document
Need a fresh take? Get an instant paraphrase of this document with our AI Paraphraser
EXECUTIVE SUMMARY
An industry average is calculated through the average of returns of various companies working
within it. The performance of such companies together describes the performance of an industry
in the market. From an investor's point of view, it is important to know about a company in terms
of its internal management, internal control, effectiveness & efficiency of a business, etc so that
useful decisions can be made. Thus, for such reasons it's important that the financial statements
prepared are authenticated and reliable and an efficient analysis has been made based on such
information. The following discussion is a comparative analysis of two listed Australian
companies called Commonwealth bank and Westpac bank, working within the same industry.
Contents
INTRODUCTION...........................................................................................................................4
ANALYSIS OF EQUITY................................................................................................................5
DISCUSSION ABOUT EACH EQUITY ITEM.........................................................................5
DISCUSSION REGARDING DEBT & EQUITY OF BOTH THE COMPANIES...................7
ANALYSIS OF CASH FLOW STATEMENT...............................................................................9
DISCUSSION REGARDING CASH FLOW STATEMENT.....................................................9
COMPARISON OF CASH FLOW OF BOTH THE COMPANIES FOR THE PAST 3
YEARS.......................................................................................................................................10
DESCRIPTION OF ANALYSIS OF CASH FLOW OF BOTH THE COMPANIES..............12
ANALYSIS OF COMPREHENSIVE INCOME STATEMENT.................................................14
ITEMS REPORTED IN THE OTHER COMPREHENSIVE INCOME STATEMENT..........14
REASONS FOR NOT REPORTING THIS ITEM IN THE INCOME STATEMENT............14
COMPARATIVE ANALYSIS OF THE OCI STATEMENT's ITEMS...................................14
USE OF OCI IN EVALUATION OF PERFORMANCE OF MANAGERS............................15
ANALYSIS OF CORPORATE INCOME TAX...........................................................................16
EFFECTIVE INCOME TAX RATE.........................................................................................16
DEFERRED TAX ASSETS AND LIABILITIES.....................................................................16
INCREASE IN DTA AND DTL...............................................................................................17
CALCULATION OF CASH TAX USING THE BOOK TAX.................................................17
⊘ This is a preview!⊘
Do you want full access?
Subscribe today to unlock all pages.
Trusted by 1+ million students worldwide

CALCULATION OF CASH TAX RATE.................................................................................19
DIFFERENCE IN CASH TAX AND BOOK TAX..................................................................19
CONCLUSION..............................................................................................................................20
Bibliography..................................................................................................................................21
Paraphrase This Document
Need a fresh take? Get an instant paraphrase of this document with our AI Paraphraser
INTRODUCTION
There are various financial & non-financial information together are used for the preparation of
various components that forms the financial reports of an organization (Alvarez, 2013). All these
factors differ in terms of nature and characteristics. The selected two companies belong to the
banking sector and a comparative analysis has been made between them on the basis of equity,
cash flow statement, comprehensive income, corporate income tax, deferred tax assets and
deferred tax liabilities, cash tax, etc.
Commonwealth bank of Australia, being the largest bank in Southern Hemisphere, is a global
bank having its business operations at United States, United Kingdom and New Zealand. The
activities undertaken by this company includes business and retail management of funds,
superannuation facilities, insurance services, investment services, Institutional banking and such
other services such as brokerage services. This company earned the title of being largest listed
company on the Australian Securities Exchange with brands such as Commonwealth insurance
or securities, Bankwest etc.
Considered as one of the 'big four' Australian banks, Westpac Banking Corporation is a financial
services provider with its headquarters at Sydney. The words 'Western' and 'Pacific' are
combined together to form the word 'Westpac'. The company is currently acquainted with 40,000
employees and 14 million employees (Atkinson, 2012). The company has a long term objective
that not only includes its growth in profits or expansion but also to prosper in terms of customers
and communities by providing best services. As per 2017 Dow Jones Sustainability Index, it was
considered as one of the most sustainable bank which was for the fourth time in a row.
Let us discuss the comparative analysis of both the companies along with their reasons and
impact on the financial reports.
ANALYSIS OF EQUITY
The equity of a company reflects its capital structure, that is, the monies on which the business is
based upon. In case of company, this equity structure is formed through investments made by
shareholders or investors (Berry, 2009). Such holders get shares of the company in return. Equity
structure includes shares such as equity shares, preference shares, right shares, etc. Retained
earnings and surpluses or deficits are also included for the calculation of the total equity of a
company.
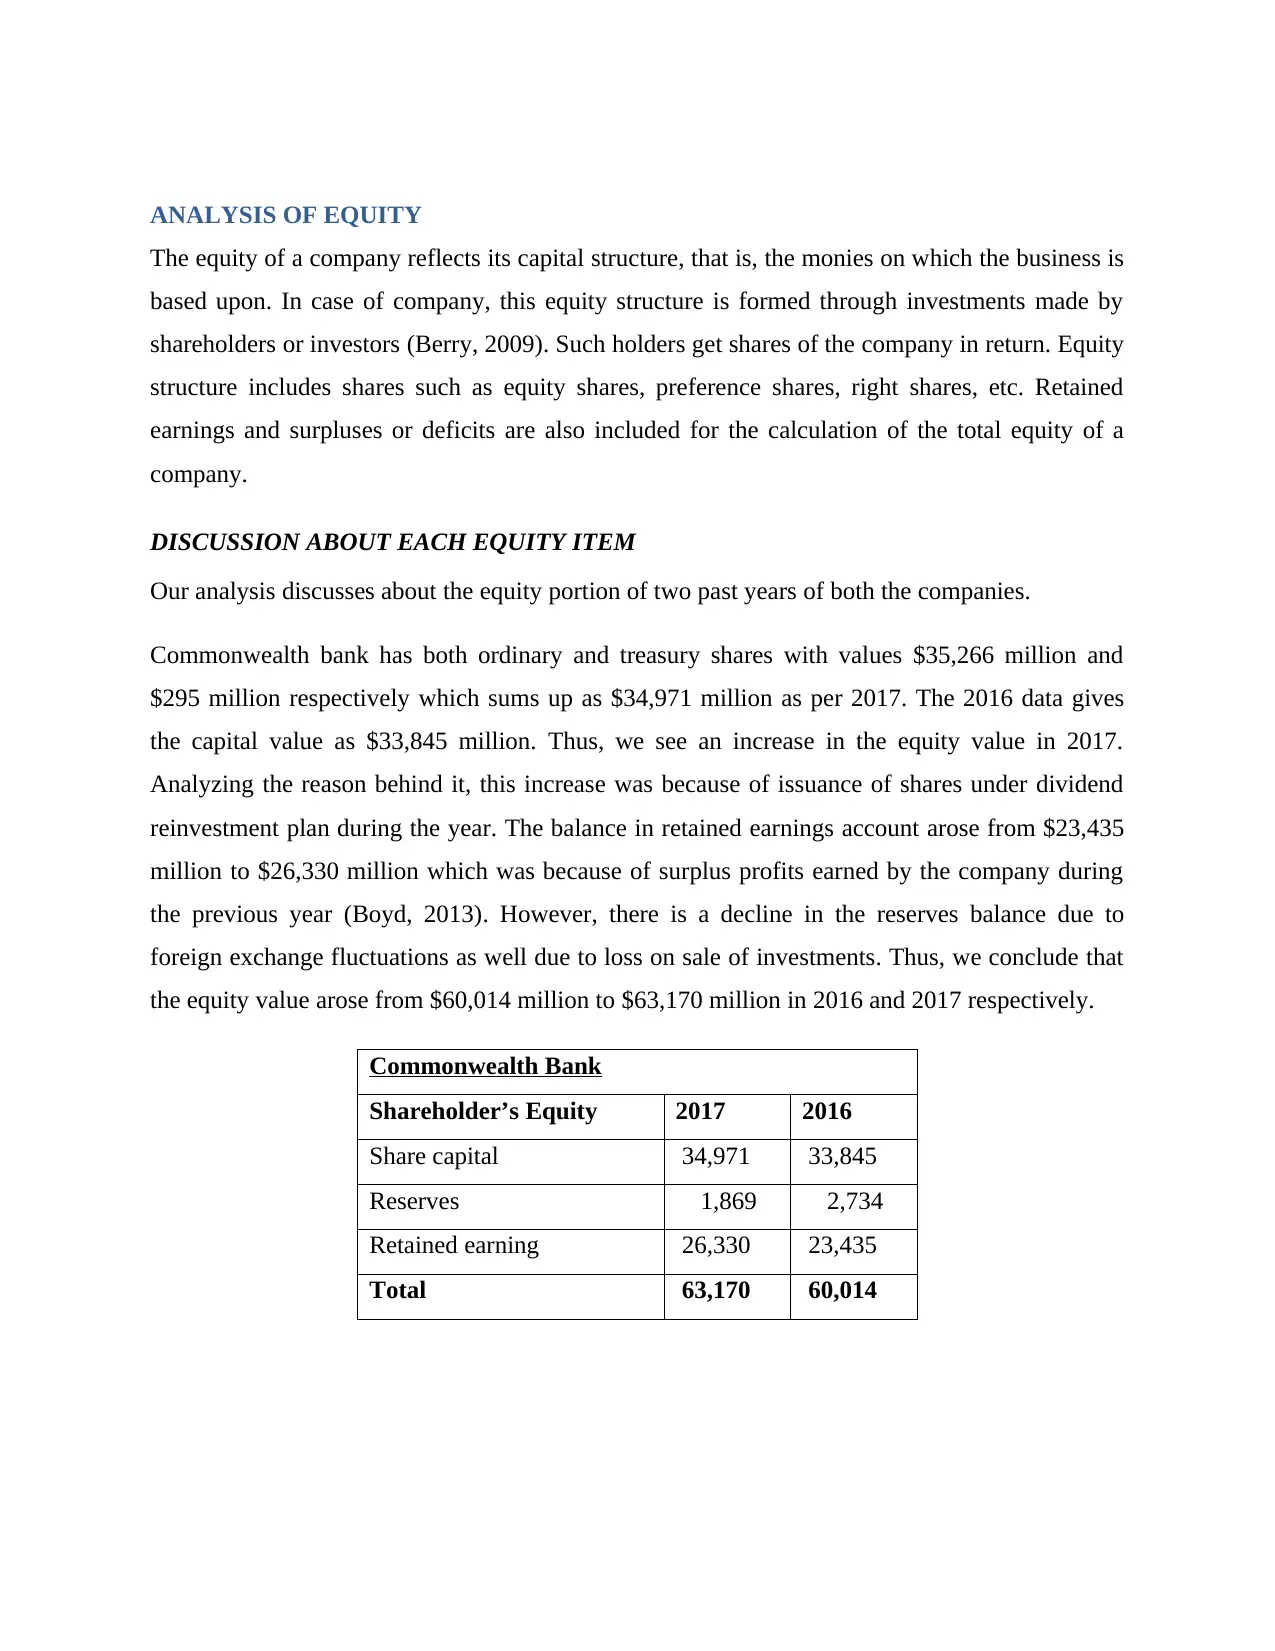
DISCUSSION ABOUT EACH EQUITY ITEM
Our analysis discusses about the equity portion of two past years of both the companies.
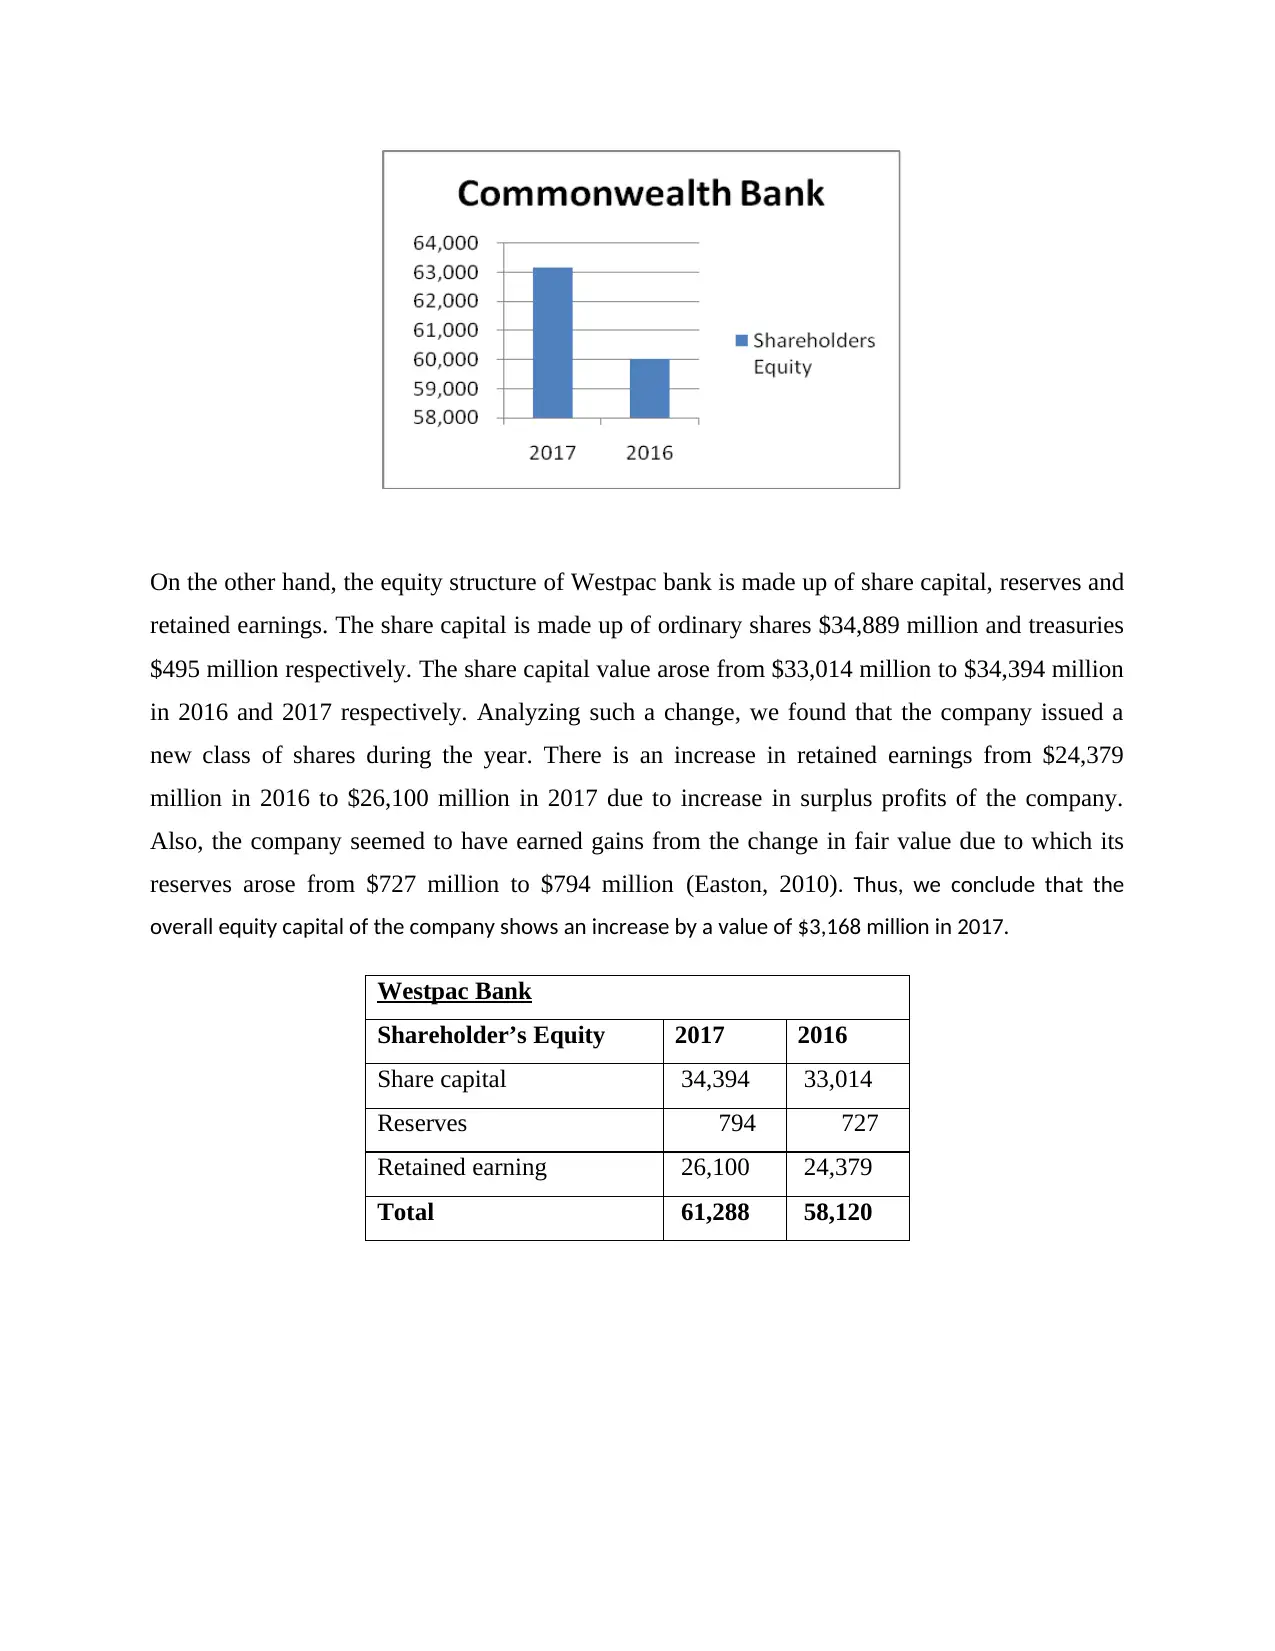
Commonwealth bank has both ordinary and treasury shares with values $35,266 million and
$295 million respectively which sums up as $34,971 million as per 2017. The 2016 data gives
the capital value as $33,845 million. Thus, we see an increase in the equity value in 2017.
Analyzing the reason behind it, this increase was because of issuance of shares under dividend
reinvestment plan during the year. The balance in retained earnings account arose from $23,435
million to $26,330 million which was because of surplus profits earned by the company during
the previous year (Boyd, 2013). However, there is a decline in the reserves balance due to
foreign exchange fluctuations as well due to loss on sale of investments. Thus, we conclude that
the equity value arose from $60,014 million to $63,170 million in 2016 and 2017 respectively.
Commonwealth Bank
Shareholder’s Equity 2017 2016
Share capital 34,971 33,845
Reserves 1,869 2,734
Retained earning 26,330 23,435
Total 63,170 60,014
The equity of a company reflects its capital structure, that is, the monies on which the business is
based upon. In case of company, this equity structure is formed through investments made by
shareholders or investors (Berry, 2009). Such holders get shares of the company in return. Equity
structure includes shares such as equity shares, preference shares, right shares, etc. Retained
earnings and surpluses or deficits are also included for the calculation of the total equity of a
company.
DISCUSSION ABOUT EACH EQUITY ITEM
Our analysis discusses about the equity portion of two past years of both the companies.
Commonwealth bank has both ordinary and treasury shares with values $35,266 million and
$295 million respectively which sums up as $34,971 million as per 2017. The 2016 data gives
the capital value as $33,845 million. Thus, we see an increase in the equity value in 2017.
Analyzing the reason behind it, this increase was because of issuance of shares under dividend
reinvestment plan during the year. The balance in retained earnings account arose from $23,435
million to $26,330 million which was because of surplus profits earned by the company during
the previous year (Boyd, 2013). However, there is a decline in the reserves balance due to
foreign exchange fluctuations as well due to loss on sale of investments. Thus, we conclude that
the equity value arose from $60,014 million to $63,170 million in 2016 and 2017 respectively.
Commonwealth Bank
Shareholder’s Equity 2017 2016
Share capital 34,971 33,845
Reserves 1,869 2,734
Retained earning 26,330 23,435
Total 63,170 60,014
⊘ This is a preview!⊘
Do you want full access?
Subscribe today to unlock all pages.
Trusted by 1+ million students worldwide
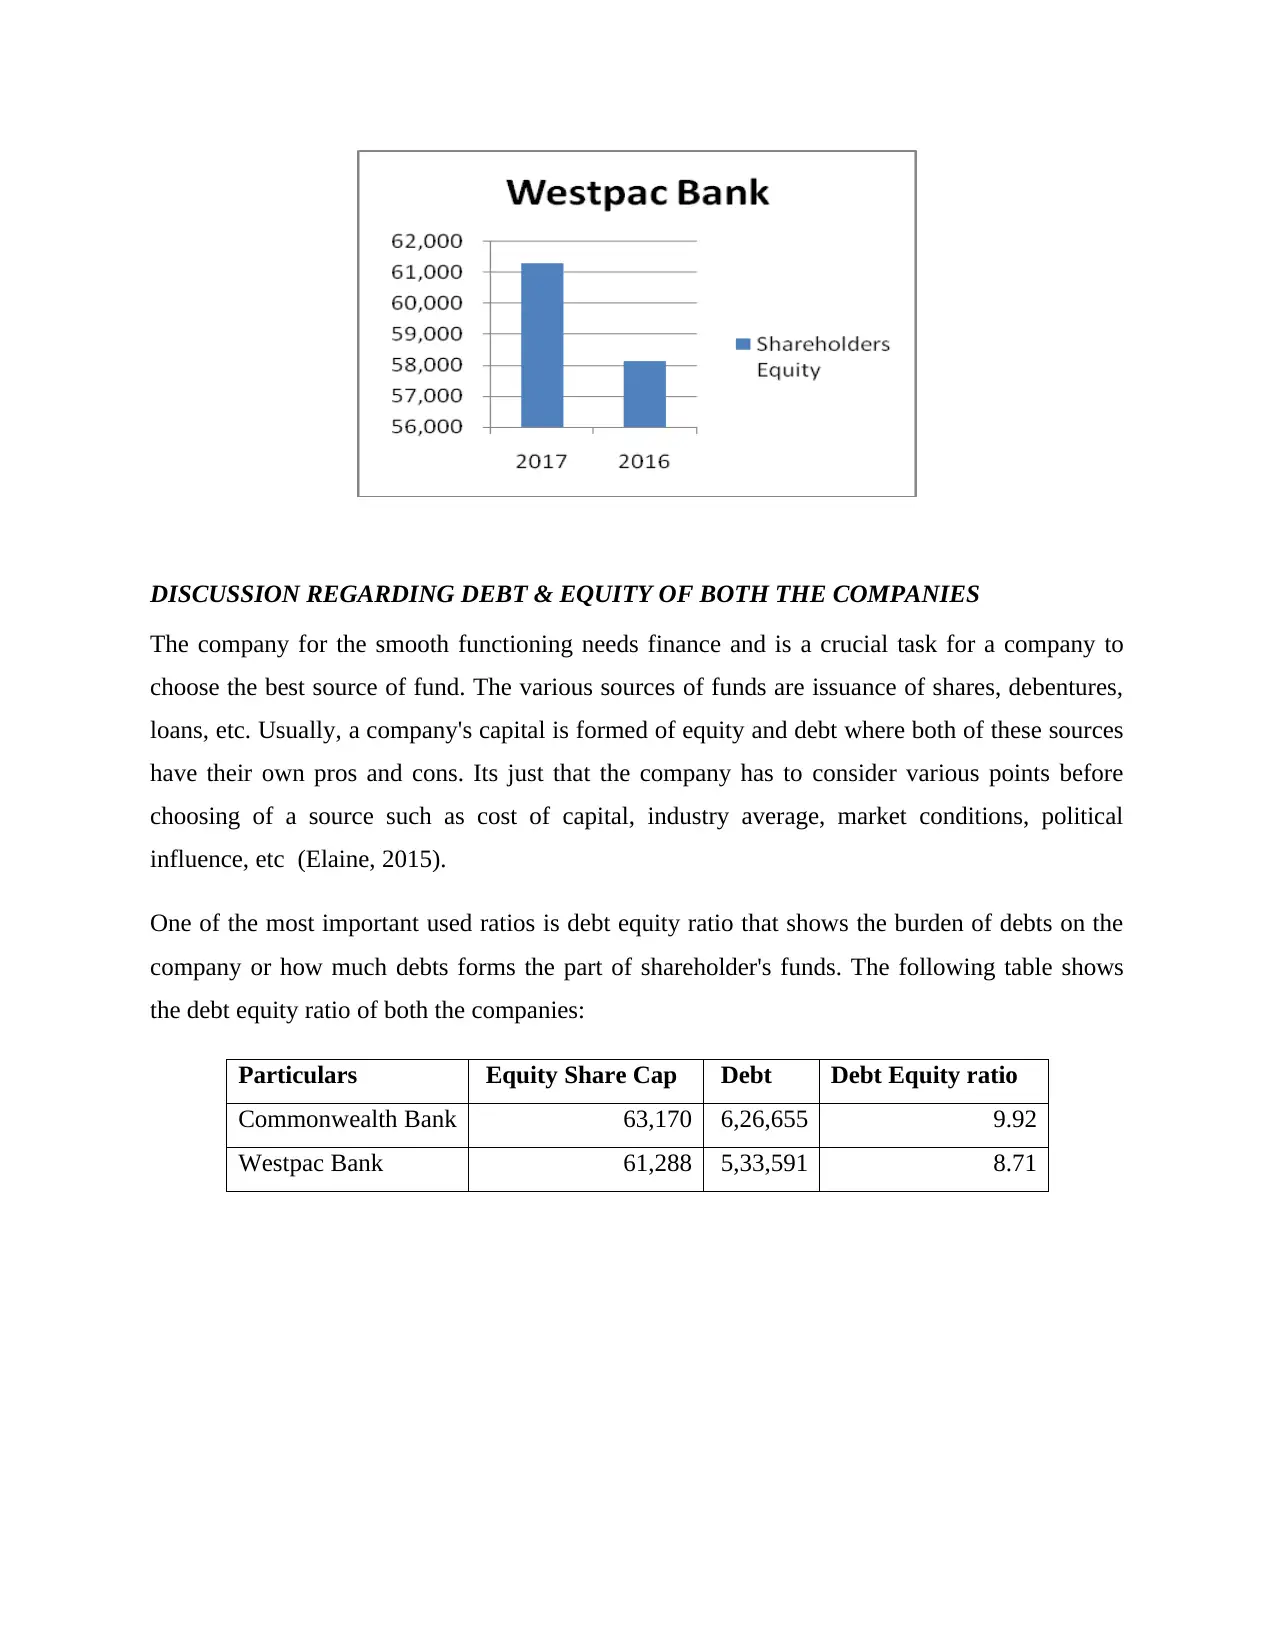
On the other hand, the equity structure of Westpac bank is made up of share capital, reserves and
retained earnings. The share capital is made up of ordinary shares $34,889 million and treasuries
$495 million respectively. The share capital value arose from $33,014 million to $34,394 million
in 2016 and 2017 respectively. Analyzing such a change, we found that the company issued a
new class of shares during the year. There is an increase in retained earnings from $24,379
million in 2016 to $26,100 million in 2017 due to increase in surplus profits of the company.
Also, the company seemed to have earned gains from the change in fair value due to which its
reserves arose from $727 million to $794 million (Easton, 2010). Thus, we conclude that the
overall equity capital of the company shows an increase by a value of $3,168 million in 2017.
Westpac Bank
Shareholder’s Equity 2017 2016
Share capital 34,394 33,014
Reserves 794 727
Retained earning 26,100 24,379
Total 61,288 58,120
Paraphrase This Document
Need a fresh take? Get an instant paraphrase of this document with our AI Paraphraser
DISCUSSION REGARDING DEBT & EQUITY OF BOTH THE COMPANIES
The company for the smooth functioning needs finance and is a crucial task for a company to
choose the best source of fund. The various sources of funds are issuance of shares, debentures,
loans, etc. Usually, a company's capital is formed of equity and debt where both of these sources
have their own pros and cons. Its just that the company has to consider various points before
choosing of a source such as cost of capital, industry average, market conditions, political
influence, etc (Elaine, 2015).
One of the most important used ratios is debt equity ratio that shows the burden of debts on the
company or how much debts forms the part of shareholder's funds. The following table shows
the debt equity ratio of both the companies:
Particulars Equity Share Cap Debt Debt Equity ratio
Commonwealth Bank 63,170 6,26,655 9.92
Westpac Bank 61,288 5,33,591 8.71
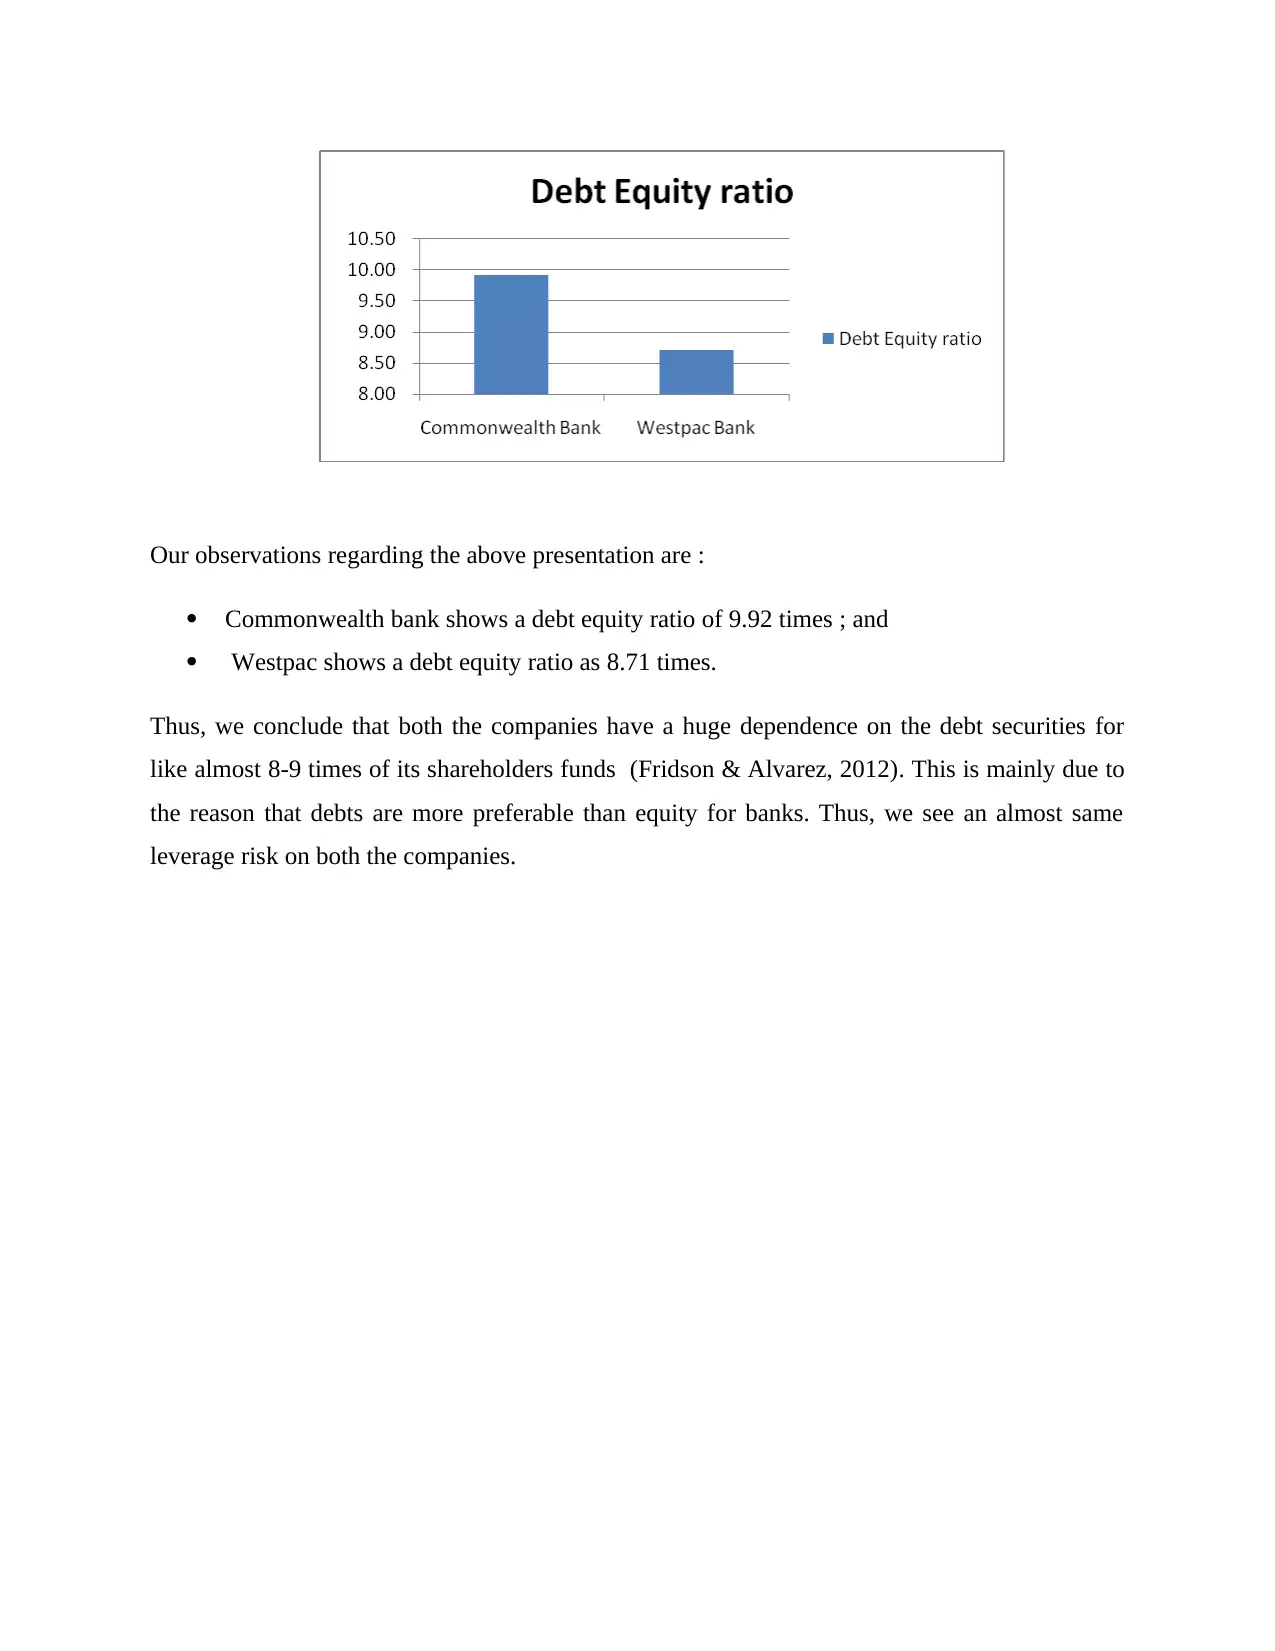
Our observations regarding the above presentation are :
Commonwealth bank shows a debt equity ratio of 9.92 times ; and
Westpac shows a debt equity ratio as 8.71 times.
Thus, we conclude that both the companies have a huge dependence on the debt securities for
like almost 8-9 times of its shareholders funds (Fridson & Alvarez, 2012). This is mainly due to
the reason that debts are more preferable than equity for banks. Thus, we see an almost same
leverage risk on both the companies.
⊘ This is a preview!⊘
Do you want full access?
Subscribe today to unlock all pages.
Trusted by 1+ million students worldwide
ANALYSIS OF CASH FLOW STATEMENT
There are two basis for recording of accounting information, either on the accrual basis or on the
cash basis. Where the books are usually prepared on the accrual basis, cash flow statement are
prepared on the cash basis as its main purpose is to reflect the actual cash inflow or outflow. This
helps in letting the stakeholders know about the liquidity position of a company (Girard, 2014).
DISCUSSION REGARDING CASH FLOW STATEMENT
Three activities together form the cash flow statement that is, operating activities, investing
activities and financing activities. In case of Commonwealth bank:
Operating activities include incomes from investment; payment of interests, etc as
interest receipt and payment are the main activities of a banking company (Jensen &
Meckling, 1976).
Investing activities shows the outflow of cash due to acquiring of subsidiaries or
associates, investments, tangible assets and inflow of cash due to dividend income.
Financing activities are composed of receipts due to issuance of debts, issuance of equity
shares and repayments of respective funds.
Analyzing the cash flow statement of Commonwealth bank, we see an outflow of cash in
operating activities, that is, $4,561 million and $807 million in 2016 and 2017. There is decline
in the outflow due to having incomes from investments and interest receipts. In a similar way, we
see a decrease in outflow of cash in case of investing activities, that is, $677 million and $2,032
million in 2017 and 2016. Such a decrease is as a result of nonpayment of purchased entities
which are under control, decrease in purchases of plant, property and equipment including
intangible assets. However, we see an increase in financing activities which is because the
company made fewer payments during redemption of debt securities (Lyon, 2010).
Thus, we conclude that the company shows a drastic change as it had negative balance in 2016,
$4,973 million which is now $8,988 million in 2017.
In case of Westpac bank :
Paraphrase This Document
Need a fresh take? Get an instant paraphrase of this document with our AI Paraphraser
The income from insurances, interest receipts and income tax together forms the
operating activities.
Investing activities are composed of sales and purchases of subsidiaries or associates,
fixed assets, investments and other securities.
Repayment and revenues of and from debts and equity together forms financing
activities.
Analyzing the cash flow statement of Westpac bank, we see that the cash outflow has decreased
in the operating activities, that is, from $5,497 million to $2,820 million in 2016 and 2017
respectively. This is due to the company have losses from fair value measurement of
investments. In case of investing activities, a decline is seen in outflow of cash as it was $7,245
million in 2016 and $1,698 million in 2017. This is because the company made sales of securities
and associates during the year. In case of financing activities, we again see that there is a drastic
decrease in cash inflows in 2017 as compared to 2016 cash inflows by a value of $4,021 million.
This happened due to increase in cash outflows while redeeming loans and issuance of debt
securities in lower quantities (McLaney & Adril, 2016).
Overall, we see a decrease of $1,151 million in the net cash flow in the year 2017.
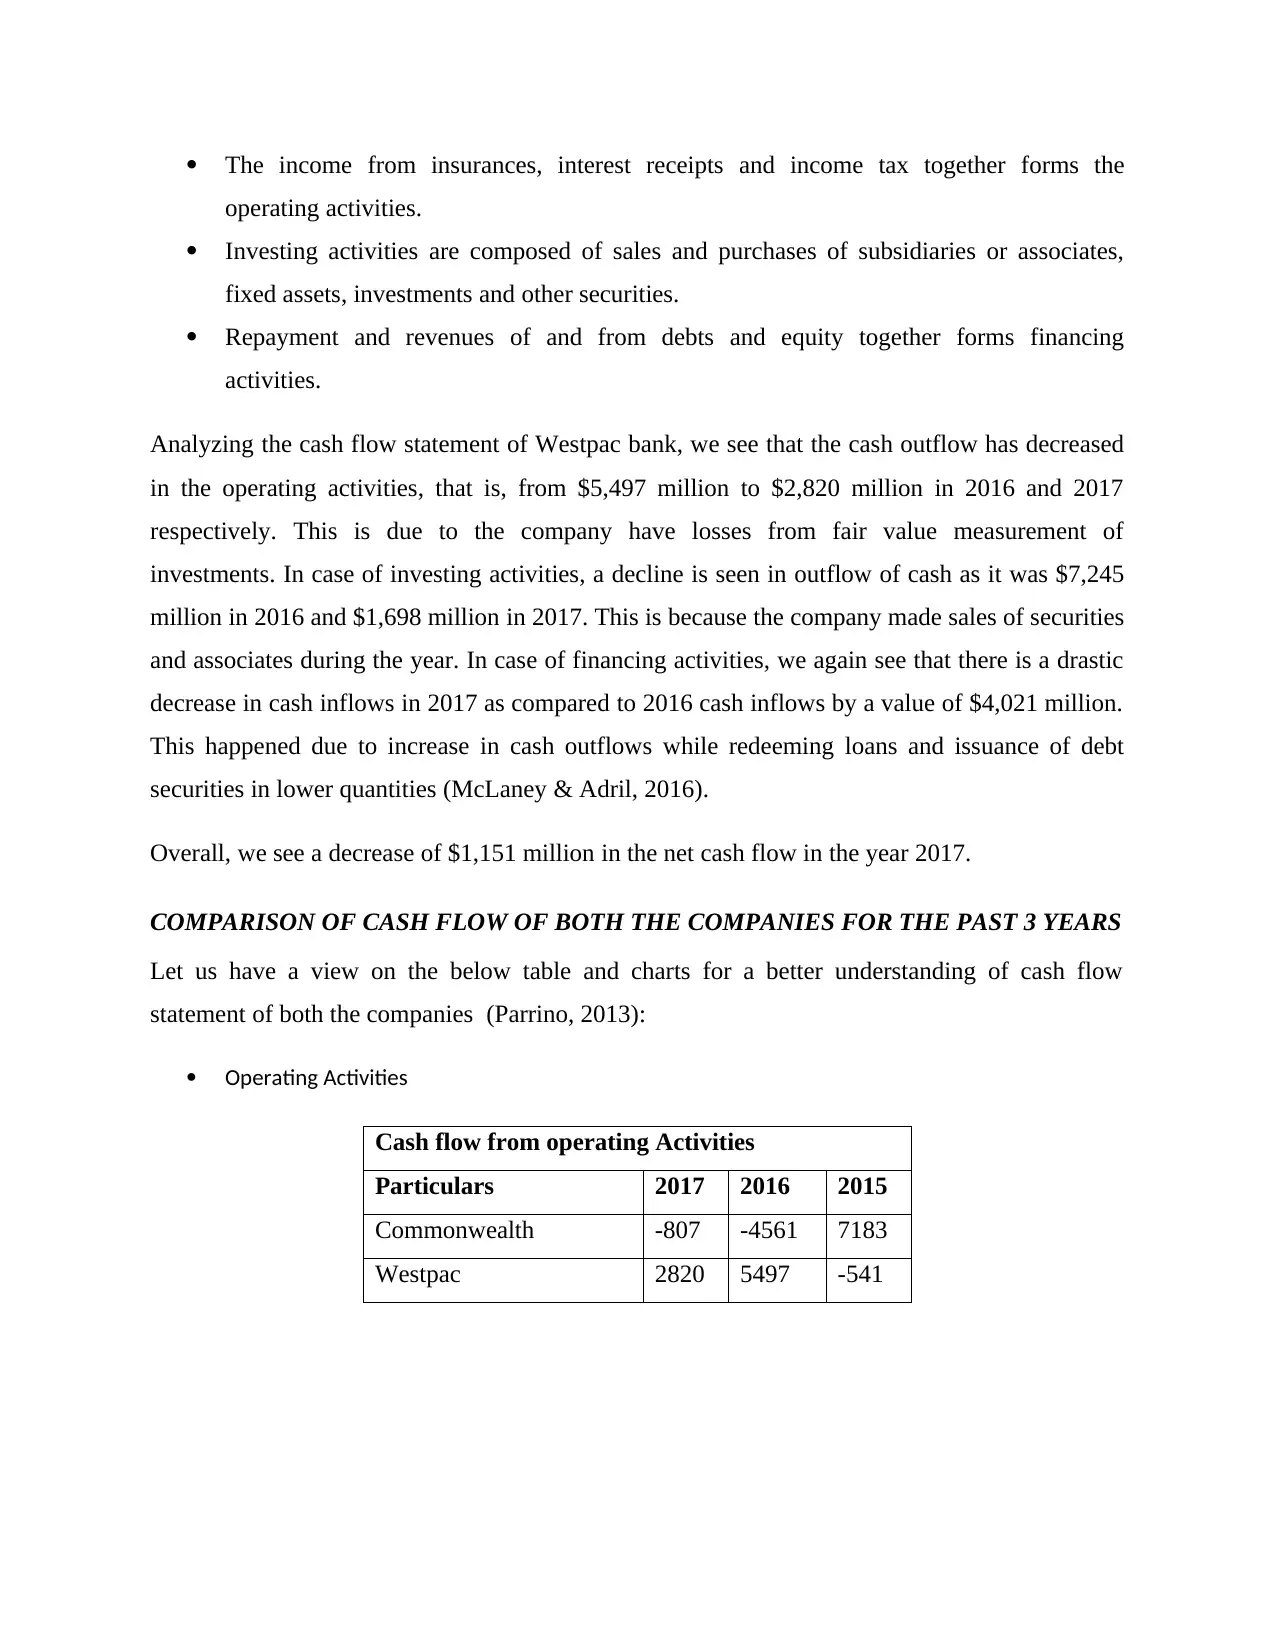
COMPARISON OF CASH FLOW OF BOTH THE COMPANIES FOR THE PAST 3 YEARS
Let us have a view on the below table and charts for a better understanding of cash flow
statement of both the companies (Parrino, 2013):
Operating Activities
Cash flow from operating Activities
Particulars 2017 2016 2015
Commonwealth -807 -4561 7183
Westpac 2820 5497 -541
operating activities.
Investing activities are composed of sales and purchases of subsidiaries or associates,
fixed assets, investments and other securities.
Repayment and revenues of and from debts and equity together forms financing
activities.
Analyzing the cash flow statement of Westpac bank, we see that the cash outflow has decreased
in the operating activities, that is, from $5,497 million to $2,820 million in 2016 and 2017
respectively. This is due to the company have losses from fair value measurement of
investments. In case of investing activities, a decline is seen in outflow of cash as it was $7,245
million in 2016 and $1,698 million in 2017. This is because the company made sales of securities
and associates during the year. In case of financing activities, we again see that there is a drastic
decrease in cash inflows in 2017 as compared to 2016 cash inflows by a value of $4,021 million.
This happened due to increase in cash outflows while redeeming loans and issuance of debt
securities in lower quantities (McLaney & Adril, 2016).
Overall, we see a decrease of $1,151 million in the net cash flow in the year 2017.
COMPARISON OF CASH FLOW OF BOTH THE COMPANIES FOR THE PAST 3 YEARS
Let us have a view on the below table and charts for a better understanding of cash flow
statement of both the companies (Parrino, 2013):
Operating Activities
Cash flow from operating Activities
Particulars 2017 2016 2015
Commonwealth -807 -4561 7183
Westpac 2820 5497 -541
The operating activities of both the companies do not show any trend in the values.
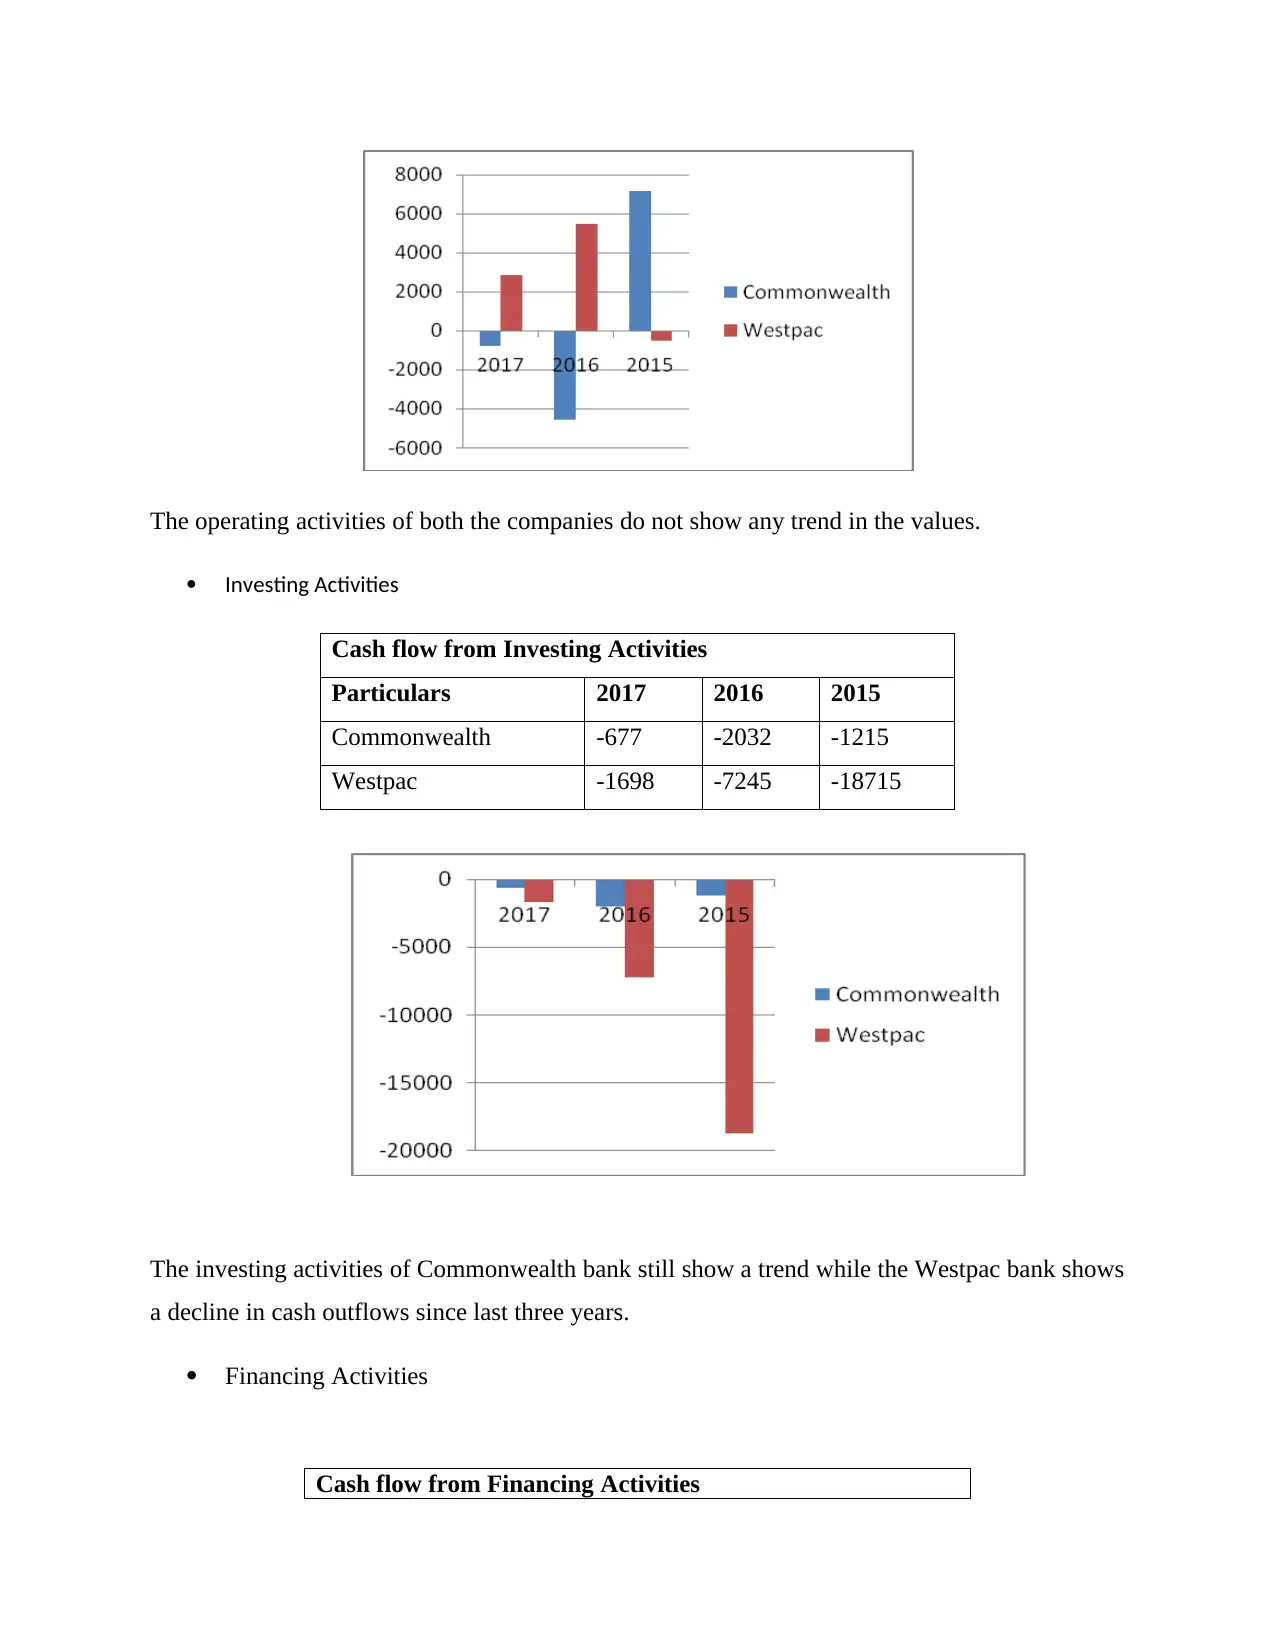
Investing Activities
Cash flow from Investing Activities
Particulars 2017 2016 2015
Commonwealth -677 -2032 -1215
Westpac -1698 -7245 -18715
The investing activities of Commonwealth bank still show a trend while the Westpac bank shows
a decline in cash outflows since last three years.
Financing Activities
Cash flow from Financing Activities
⊘ This is a preview!⊘
Do you want full access?
Subscribe today to unlock all pages.
Trusted by 1+ million students worldwide
1 out of 23
Related Documents


Your All-in-One AI-Powered Toolkit for Academic Success.
+13062052269
info@desklib.com
Available 24*7 on WhatsApp / Email
![[object Object]](/_next/static/media/star-bottom.7253800d.svg)
Unlock your academic potential
Copyright © 2020–2026 A2Z Services. All Rights Reserved. Developed and managed by ZUCOL.