Analysis of Financial Statements: Westpac, ANZ, and Commonwealth Bank
VerifiedAdded on 2023/04/25
|26
|4347
|246
Report
AI Summary
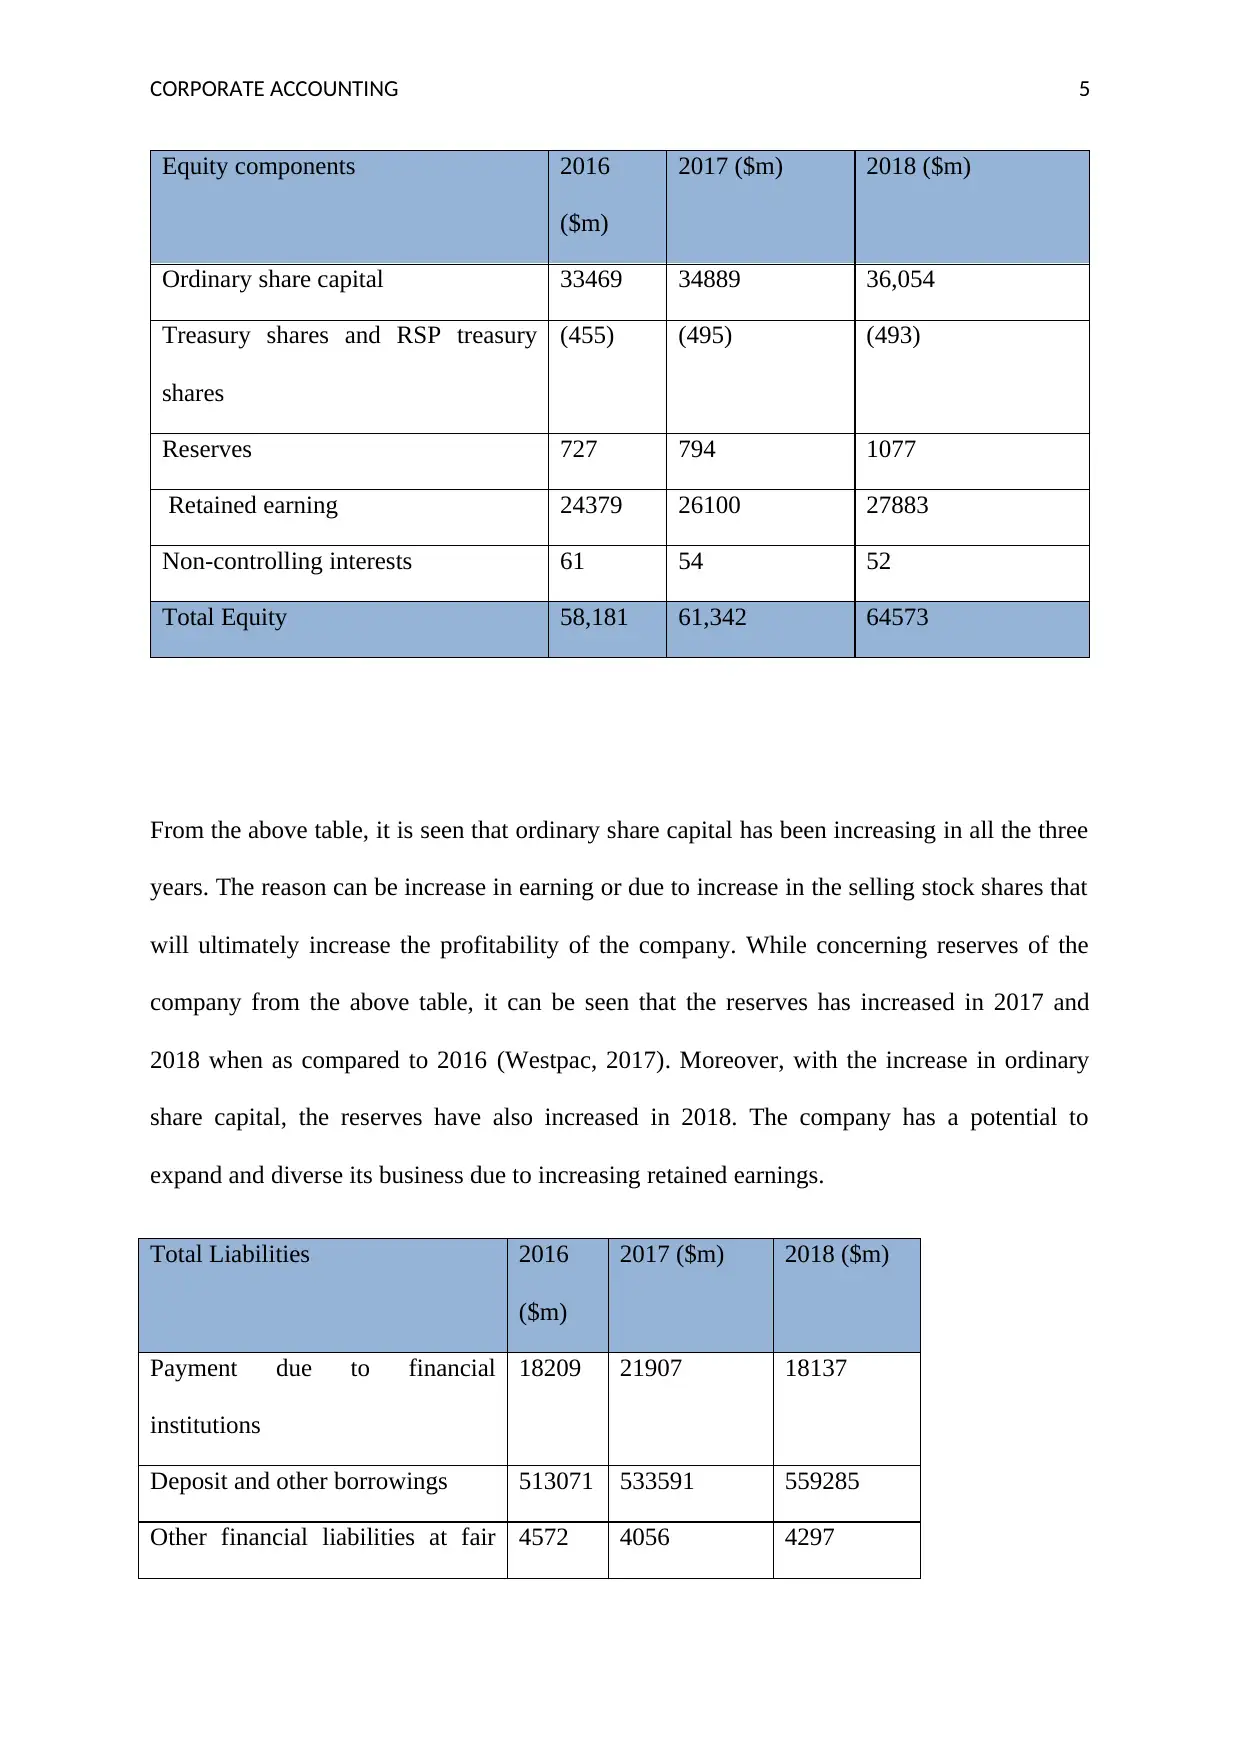
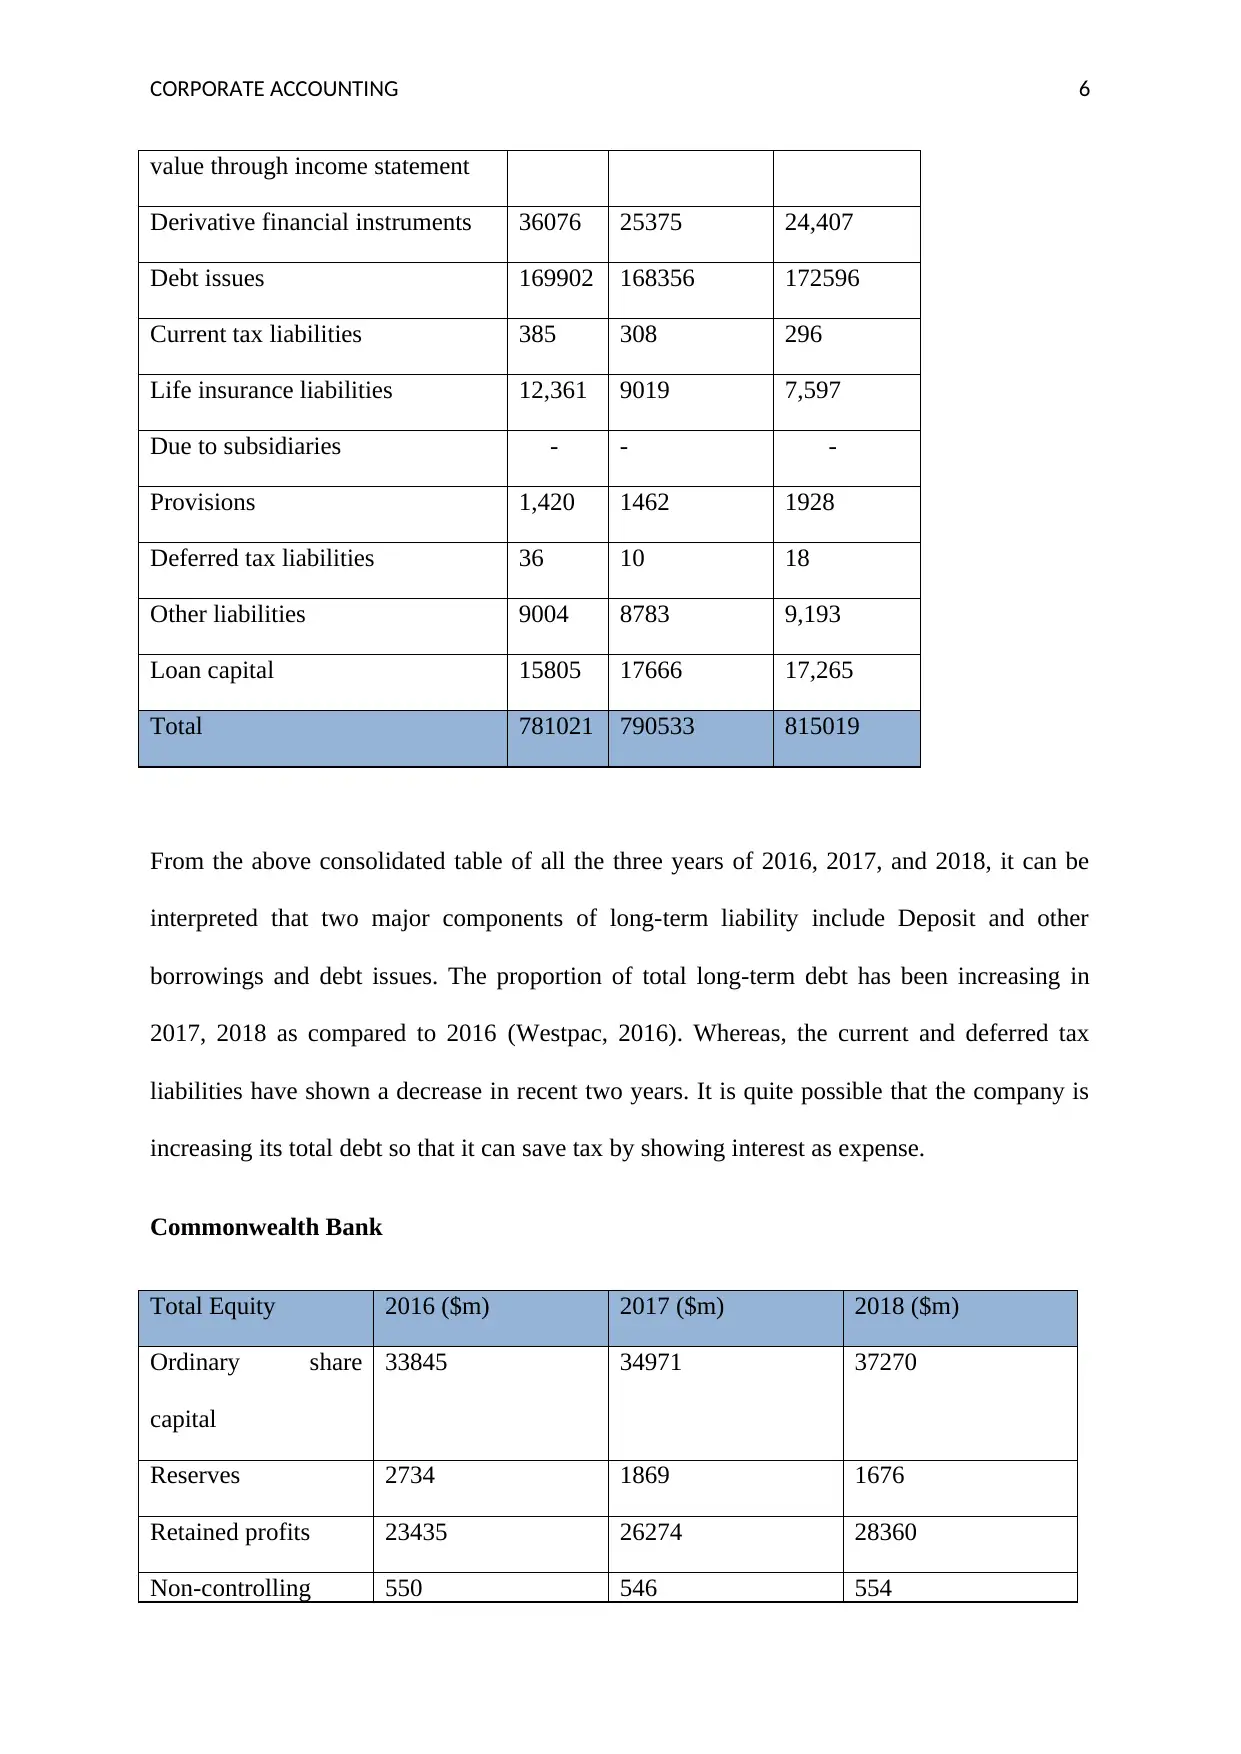
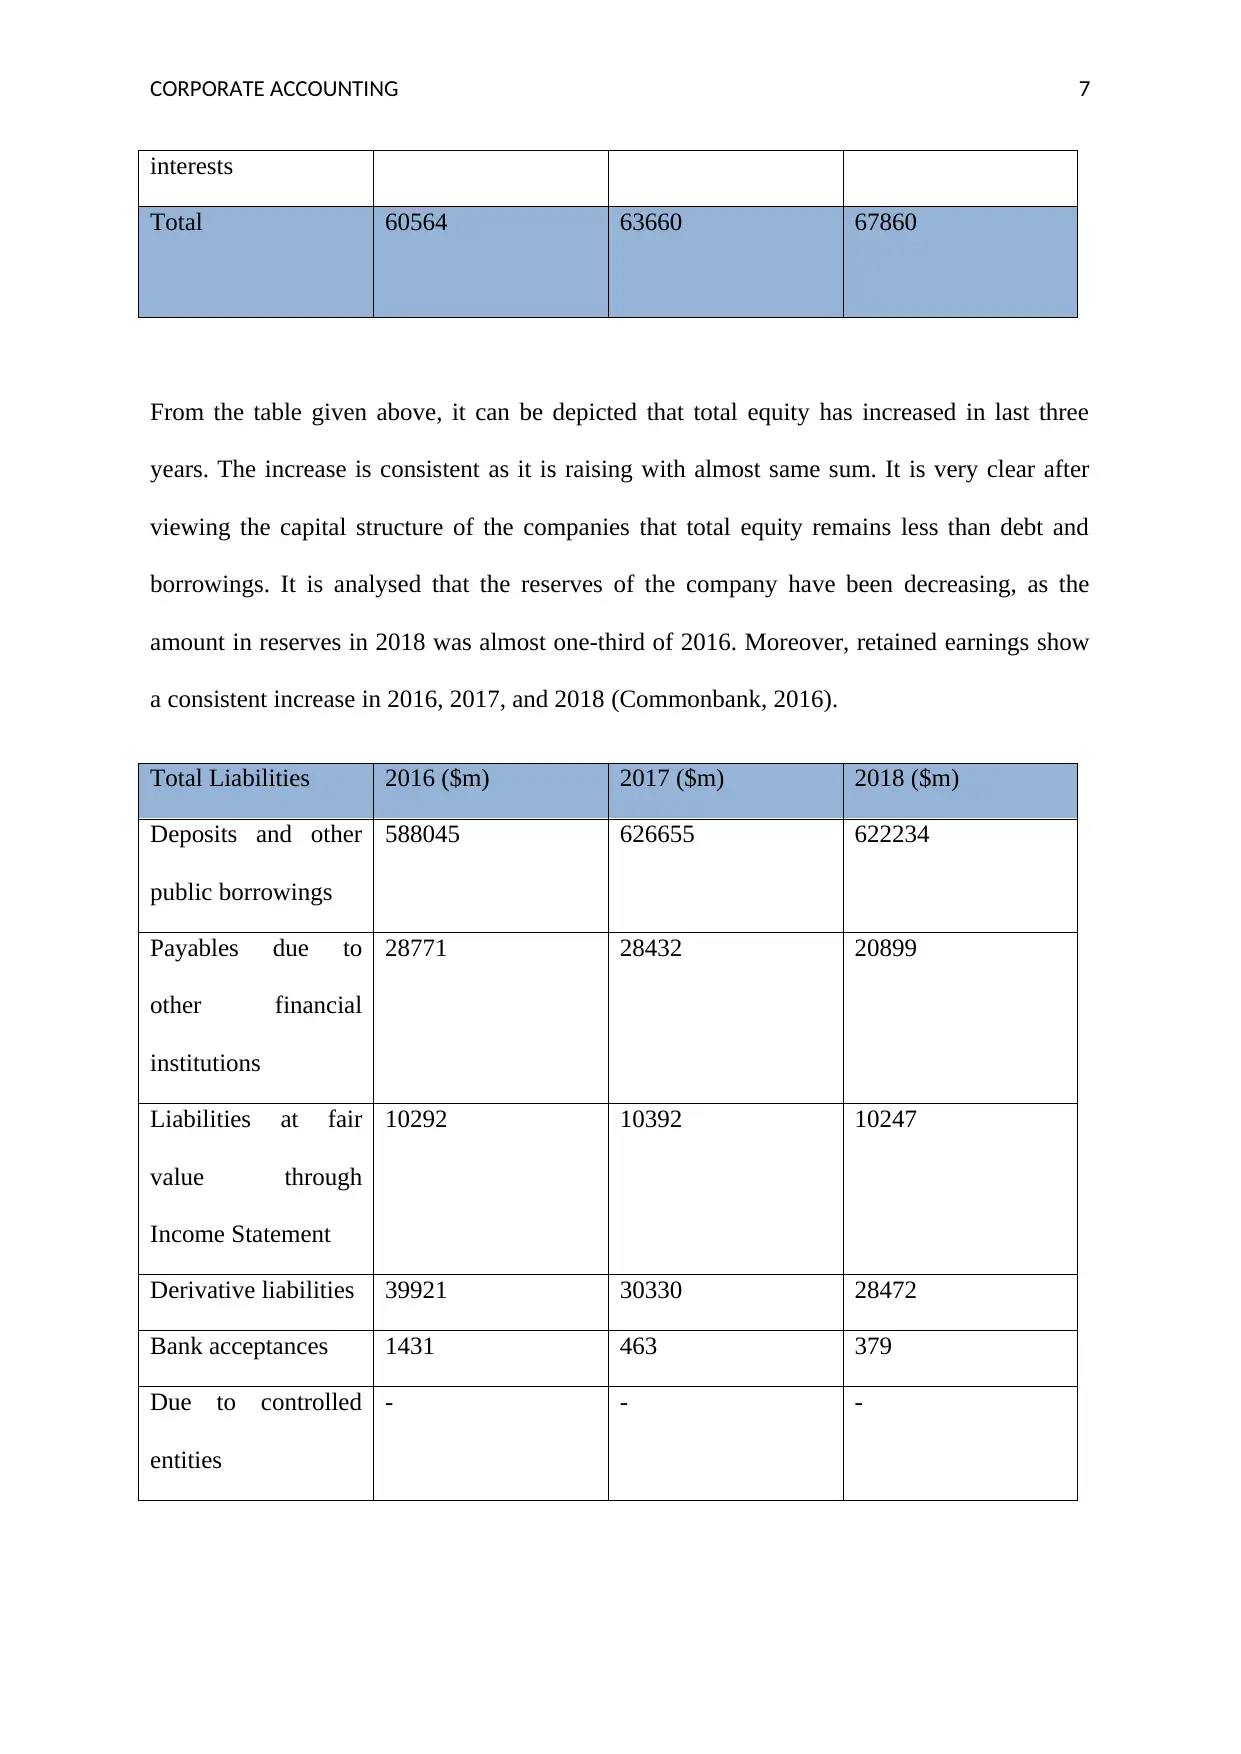
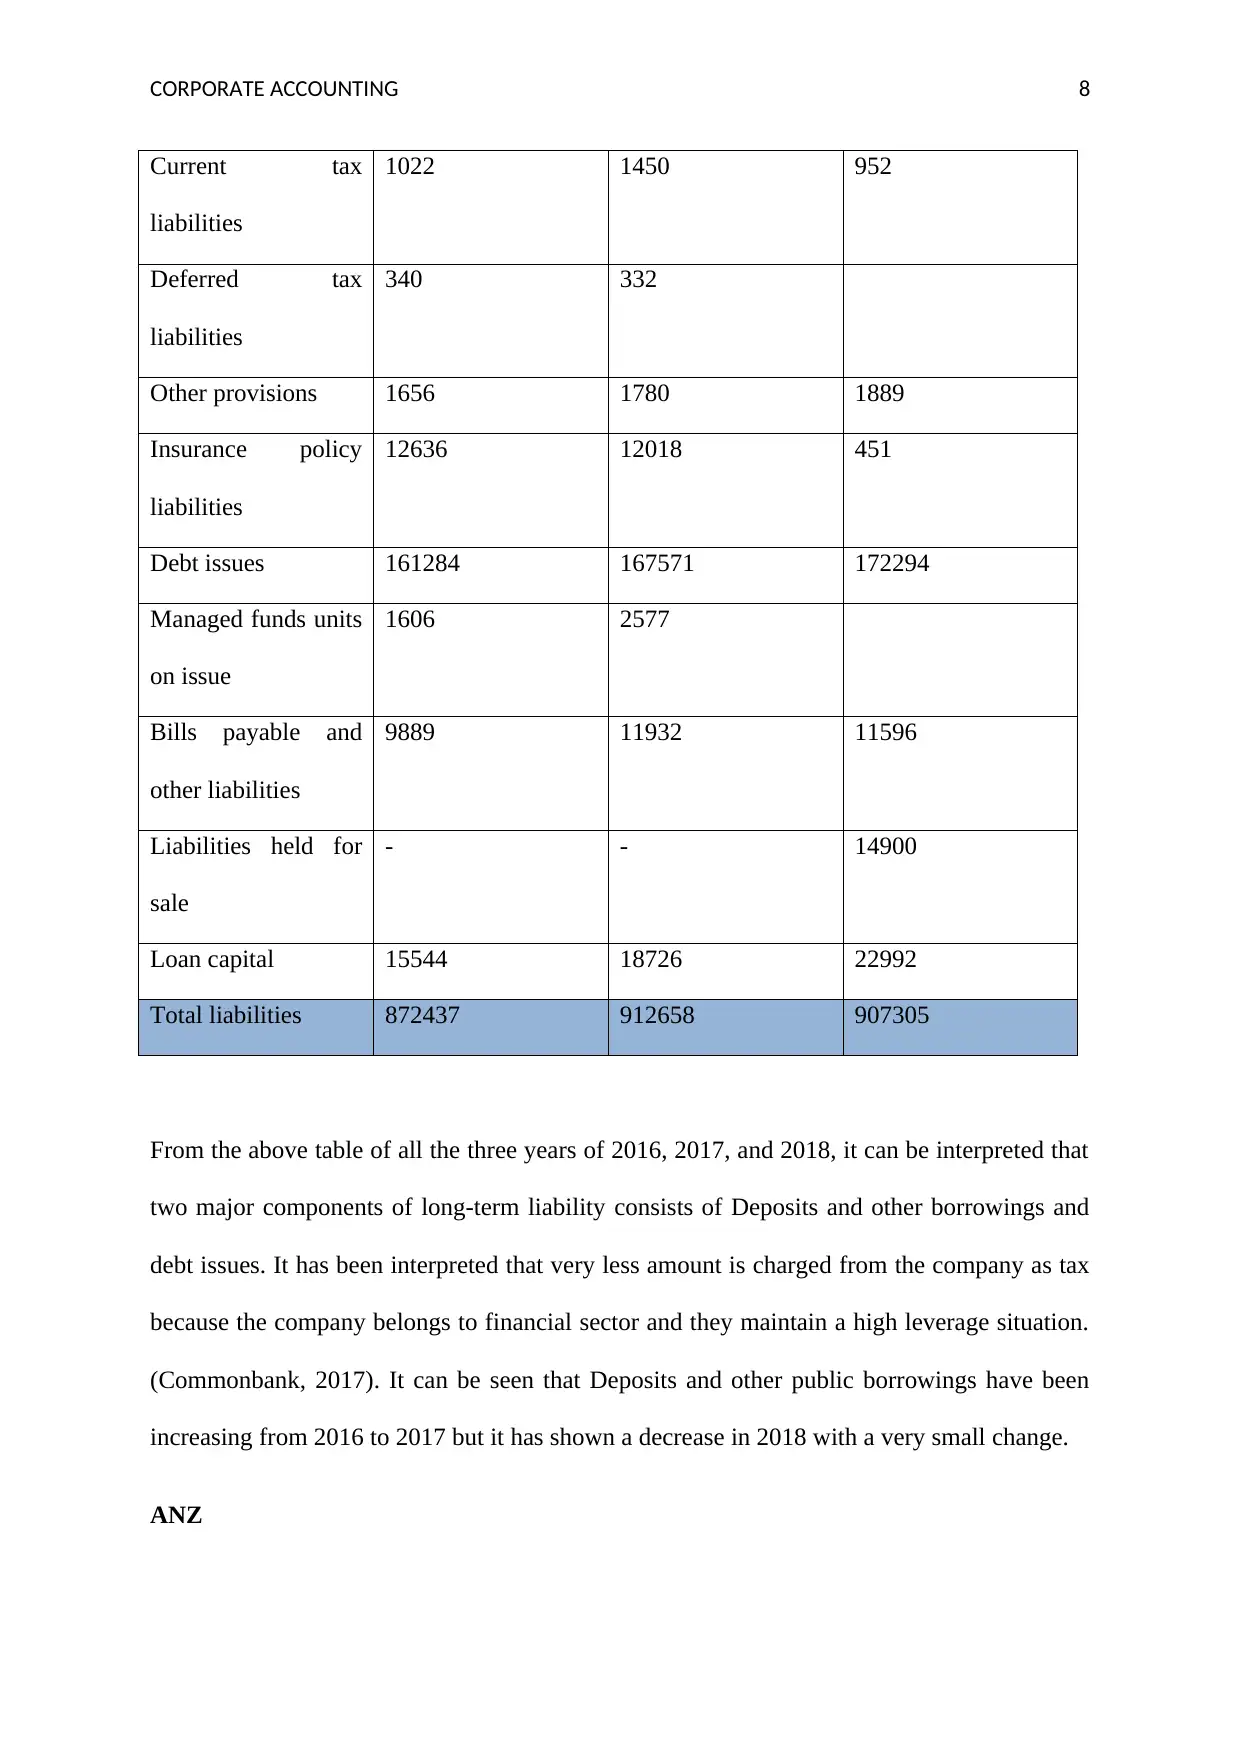
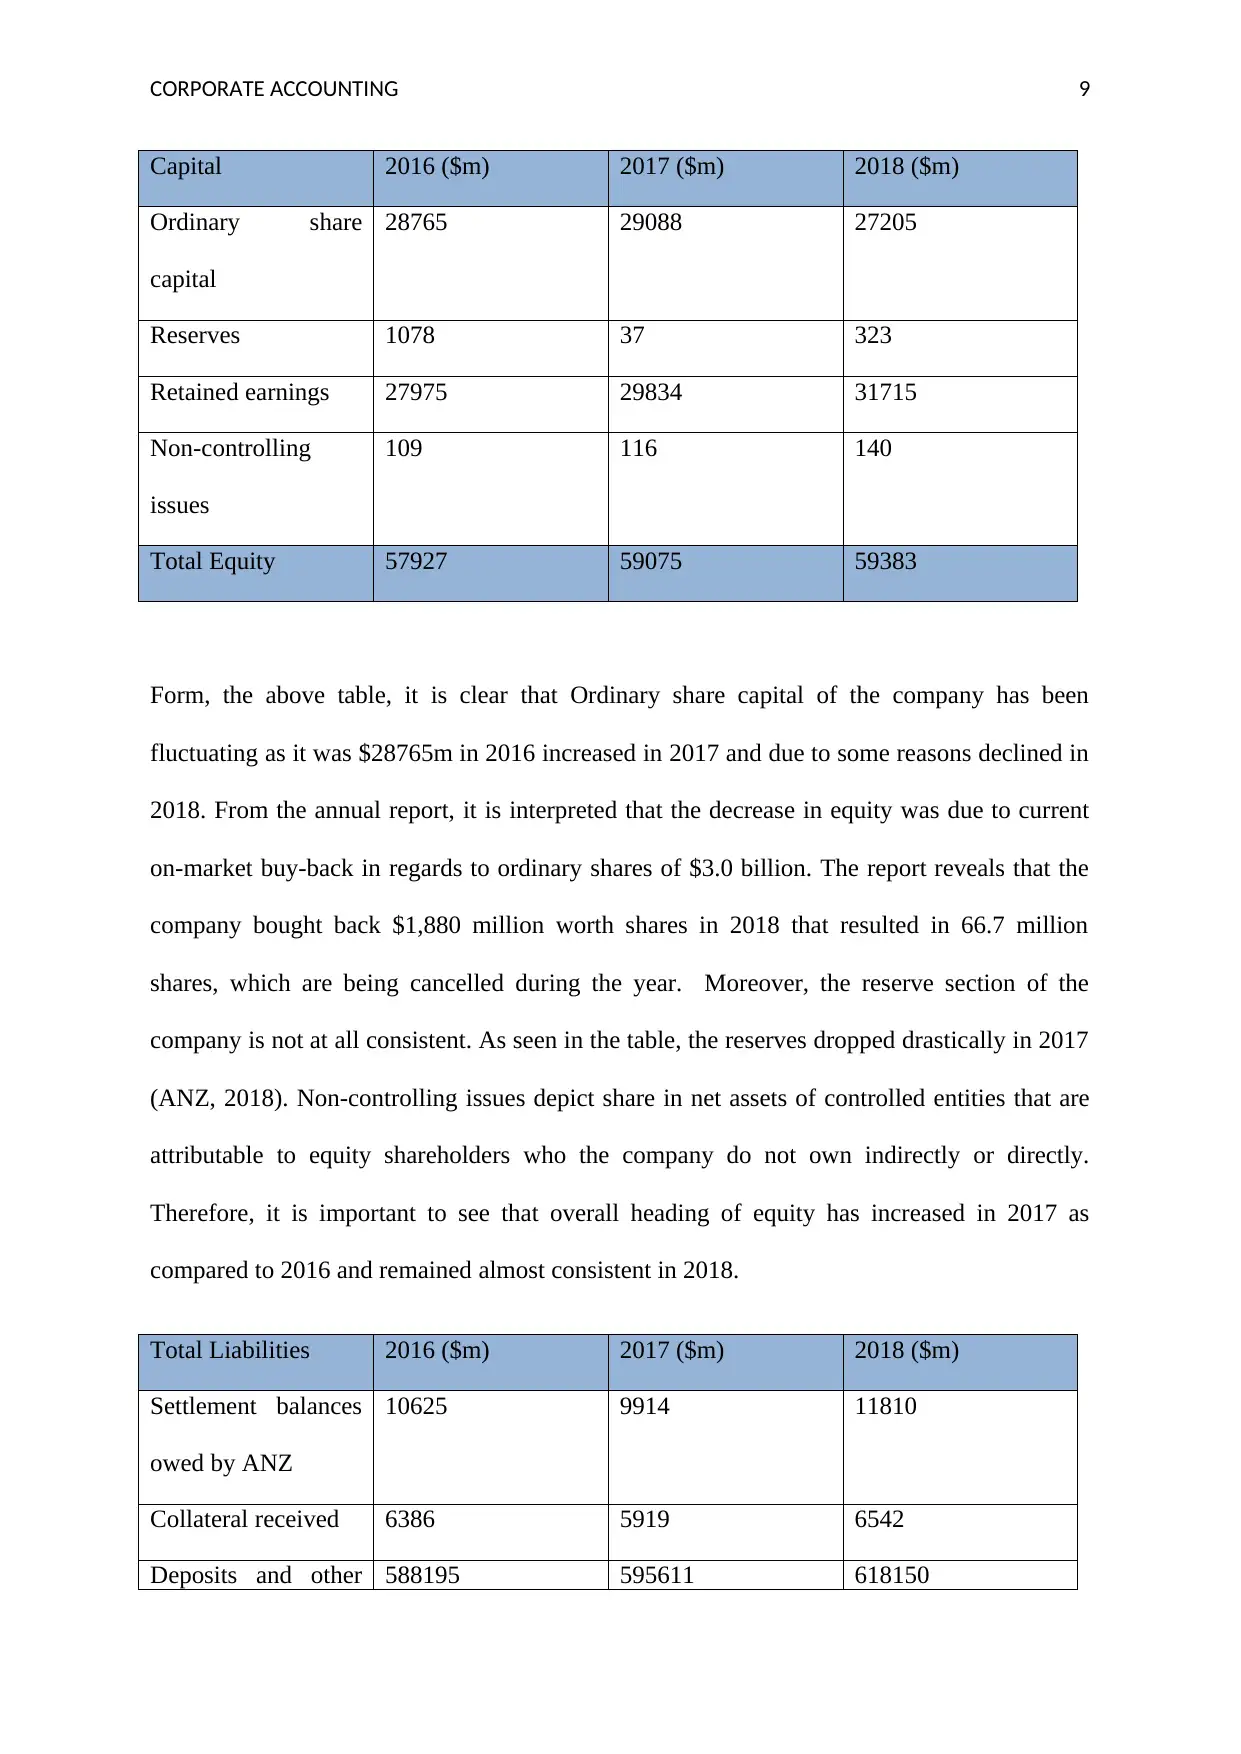
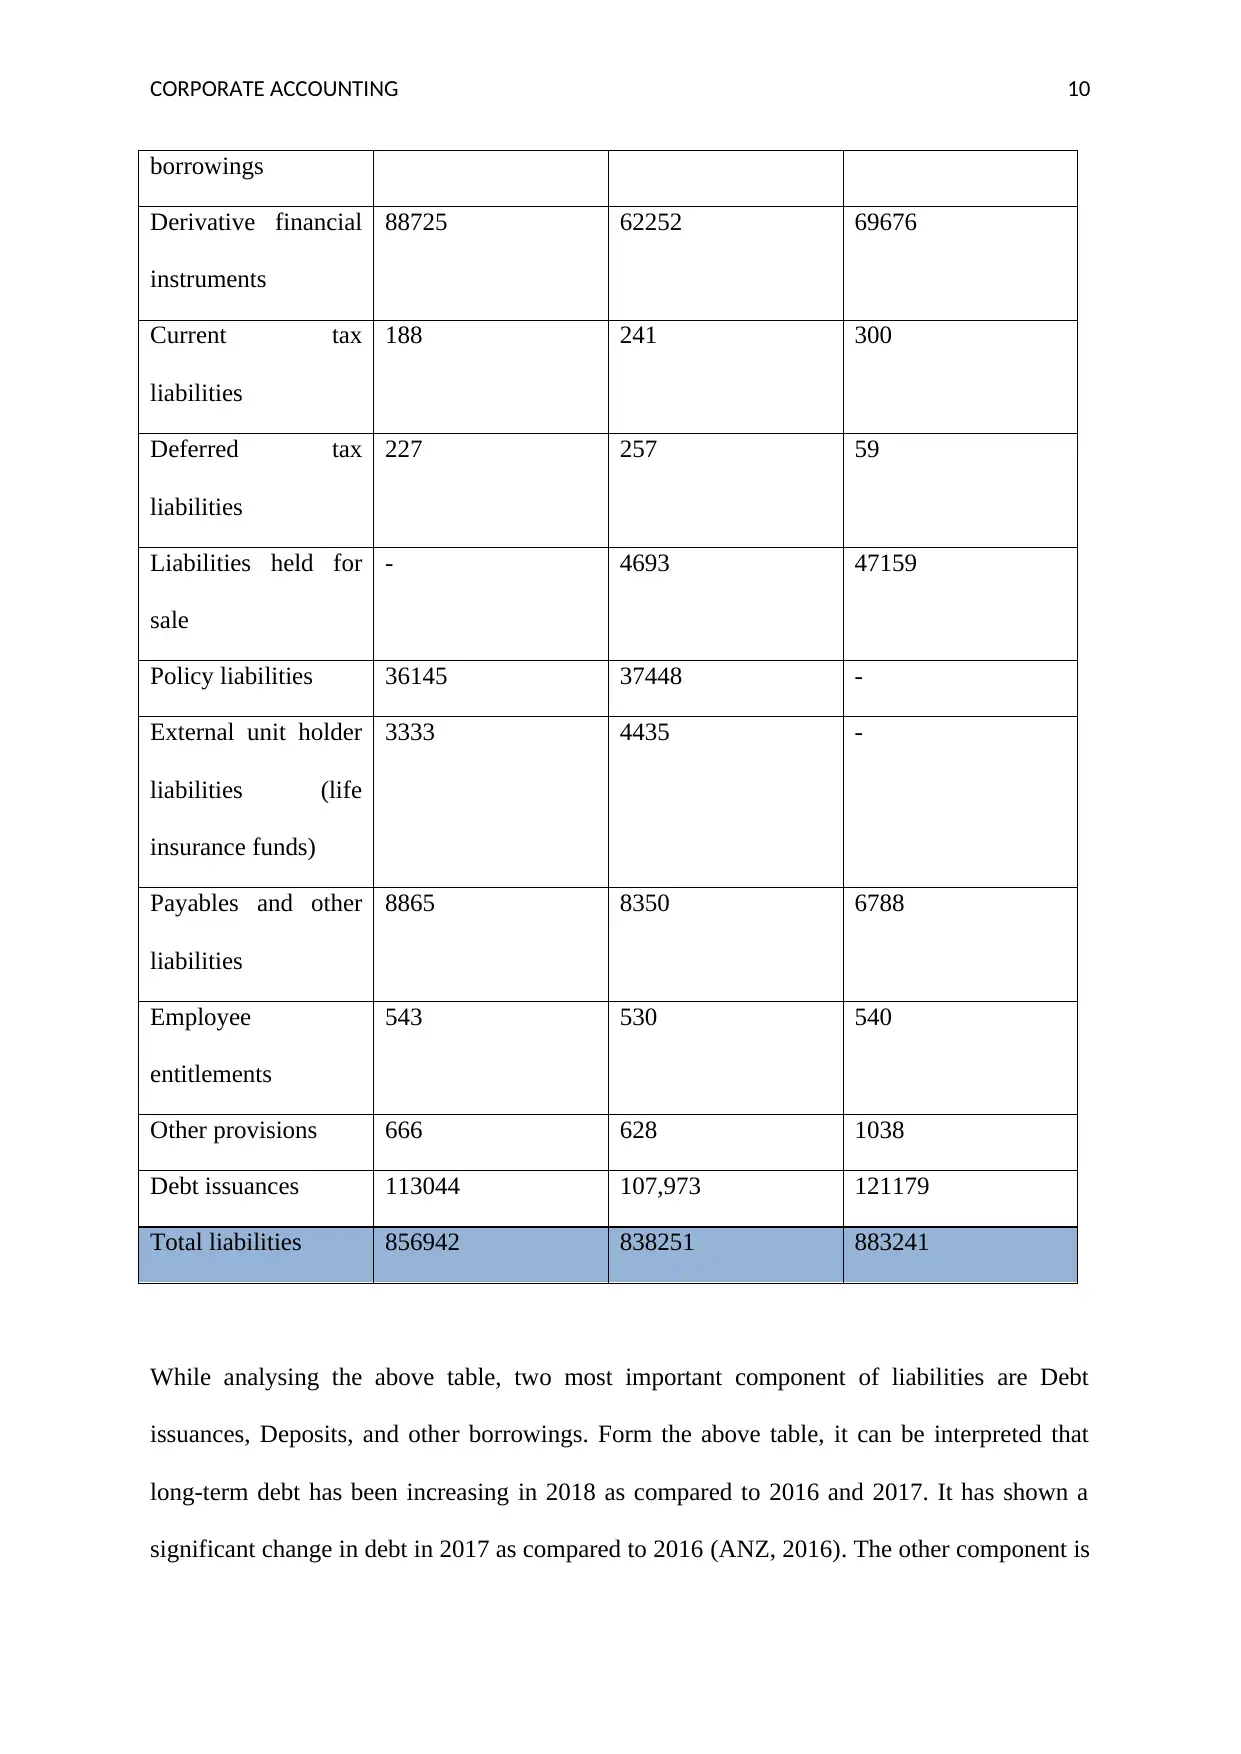
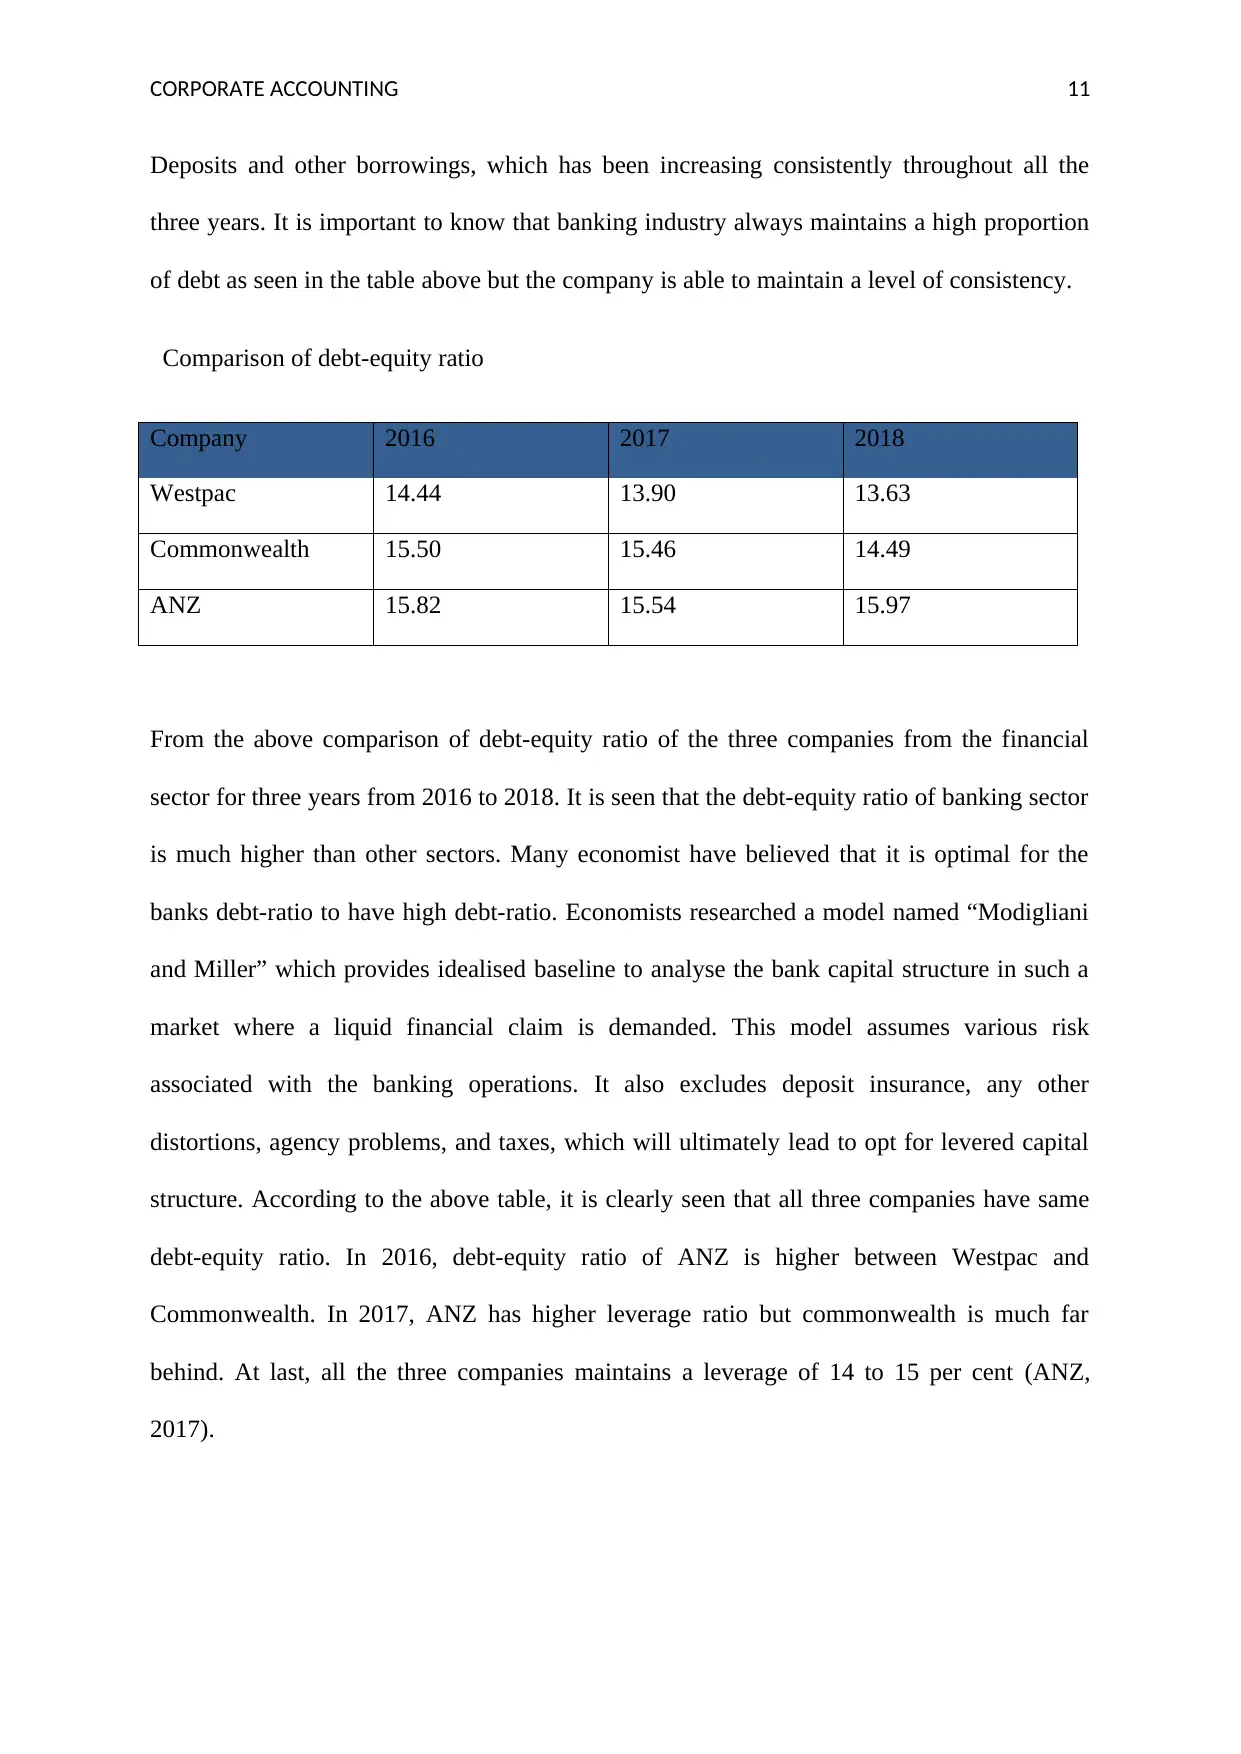
This report provides a comprehensive financial analysis of Westpac, ANZ, and Commonwealth Bank, focusing on their equity, liabilities, and cash flow statements from 2016 to 2018. The analysis includes an examination of the companies' debt-equity ratios, highlighting the high leverage within the financial sector. The report delves into the components of the cash flow statement, revealing insights into the companies' capital positions. Furthermore, it explores the comprehensive income statement, including items not recorded in the income statement, and the impact of deferred tax and liabilities on the companies' consumption and saving patterns. The report also offers a comparative analysis of the financial performance of the three banks, drawing conclusions on their financial stability and profitability. The report structure includes an introduction, analysis of equity and liabilities, cash flow statements, income statements, and corporate income tax accounting, culminating in a conclusion based on the financial data examined. The report adheres to the guidelines of the HI5020 Corporate Accounting course, offering a detailed assessment of the financial health of these prominent Australian banks.

Corporate Accounting
Paraphrase This Document
Need a fresh take? Get an instant paraphrase of this document with our AI Paraphraser

CORPORATE ACCOUNTING 1
Executive Summary
The main aim of this report is to develop the understanding of analysis of financial statement
of the company. In this report, the analysis of Westpac, ANZ and Commonwealth has been
done in order to analyse the financial position of the companies. The analysis states that the
companies have high leverage in the context of equity and liability. The different items of
cash flow statement have been discussed in this report which states that the companies have
less capital. The analysis of comprehensive income statement has different items which are
not recorded in the income statement. The companies have deferred tax and liabilities which
analysed the consumption and saving of company in the context of tax.

CORPORATE ACCOUNTING 2
⊘ This is a preview!⊘
Do you want full access?
Subscribe today to unlock all pages.

Trusted by 1+ million students worldwide

CORPORATE ACCOUNTING 3
Contents
Introduction................................................................................................................................1
Equity and Liabilities.................................................................................................................1
Cash flow statement...................................................................................................................1
Comparative Analysis............................................................................................................1
Income statement.......................................................................................................................1
Accounting for Corporate Income Tax......................................................................................1
Conclusion..................................................................................................................................1
References..................................................................................................................................1
Paraphrase This Document
Need a fresh take? Get an instant paraphrase of this document with our AI Paraphraser

CORPORATE ACCOUNTING 4
Introduction
Financial analysis refers to an assessment of the viability, stability, and profitability of a
business. In this report, the financial analysis has been done in order to analyse the profit and
stability of the company. In this report, three companies have been taken into consideration to
analyse the financial position such as Westpac, ANZ, and Commonwealth. Westpac is an
Australian bank and the provider of financial services which was founded in 1817 (Westpac,
2018). Commonwealth Bank of Australia is an Australian multinational Bank with the
business across New Zealand, United Kingdom and United States. It earned $26.005 billion
revenue (The Commonwealth, 2018). ANZ is an Australia and New Zealand Banking Group
and it is the third largest bank in the term of market capitalisation (ANZ. (2018) History.
This report is divided into four parts to analyse the financial statement. In the first section,
equity and liabilities of the company have been analysed. The second section is based on the
cash flow statement of the company in order to analyse the financial position as well as
stability in the market. The third section of the report has discussed about the items of income
statement in order to analyse the profitability of the company. The corporate income tax has
been discussed in the last section of the report.
Equity and Liabilities
Westpac

CORPORATE ACCOUNTING 5
Equity components 2016
($m)
2017 ($m) 2018 ($m)
Ordinary share capital 33469 34889 36,054
Treasury shares and RSP treasury
shares
(455) (495) (493)
Reserves 727 794 1077
Retained earning 24379 26100 27883
Non-controlling interests 61 54 52
Total Equity 58,181 61,342 64573
From the above table, it is seen that ordinary share capital has been increasing in all the three
years. The reason can be increase in earning or due to increase in the selling stock shares that
will ultimately increase the profitability of the company. While concerning reserves of the
company from the above table, it can be seen that the reserves has increased in 2017 and
2018 when as compared to 2016 (Westpac, 2017). Moreover, with the increase in ordinary
share capital, the reserves have also increased in 2018. The company has a potential to
expand and diverse its business due to increasing retained earnings.
Total Liabilities 2016
($m)
2017 ($m) 2018 ($m)
Payment due to financial
institutions
18209 21907 18137
Deposit and other borrowings 513071 533591 559285
Other financial liabilities at fair 4572 4056 4297
⊘ This is a preview!⊘
Do you want full access?
Subscribe today to unlock all pages.

Trusted by 1+ million students worldwide

CORPORATE ACCOUNTING 6
value through income statement
Derivative financial instruments 36076 25375 24,407
Debt issues 169902 168356 172596
Current tax liabilities 385 308 296
Life insurance liabilities 12,361 9019 7,597
Due to subsidiaries - - -
Provisions 1,420 1462 1928
Deferred tax liabilities 36 10 18
Other liabilities 9004 8783 9,193
Loan capital 15805 17666 17,265
Total 781021 790533 815019
From the above consolidated table of all the three years of 2016, 2017, and 2018, it can be
interpreted that two major components of long-term liability include Deposit and other
borrowings and debt issues. The proportion of total long-term debt has been increasing in
2017, 2018 as compared to 2016 (Westpac, 2016). Whereas, the current and deferred tax
liabilities have shown a decrease in recent two years. It is quite possible that the company is
increasing its total debt so that it can save tax by showing interest as expense.
Commonwealth Bank
Total Equity 2016 ($m) 2017 ($m) 2018 ($m)
Ordinary share
capital
33845 34971 37270
Reserves 2734 1869 1676
Retained profits 23435 26274 28360
Non-controlling 550 546 554
Paraphrase This Document
Need a fresh take? Get an instant paraphrase of this document with our AI Paraphraser

CORPORATE ACCOUNTING 7
interests
Total 60564 63660 67860
From the table given above, it can be depicted that total equity has increased in last three
years. The increase is consistent as it is raising with almost same sum. It is very clear after
viewing the capital structure of the companies that total equity remains less than debt and
borrowings. It is analysed that the reserves of the company have been decreasing, as the
amount in reserves in 2018 was almost one-third of 2016. Moreover, retained earnings show
a consistent increase in 2016, 2017, and 2018 (Commonbank, 2016).
Total Liabilities 2016 ($m) 2017 ($m) 2018 ($m)
Deposits and other
public borrowings
588045 626655 622234
Payables due to
other financial
institutions
28771 28432 20899
Liabilities at fair
value through
Income Statement
10292 10392 10247
Derivative liabilities 39921 30330 28472
Bank acceptances 1431 463 379
Due to controlled
entities
- - -

CORPORATE ACCOUNTING 8
Current tax
liabilities
1022 1450 952
Deferred tax
liabilities
340 332
Other provisions 1656 1780 1889
Insurance policy
liabilities
12636 12018 451
Debt issues 161284 167571 172294
Managed funds units
on issue
1606 2577
Bills payable and
other liabilities
9889 11932 11596
Liabilities held for
sale
- - 14900
Loan capital 15544 18726 22992
Total liabilities 872437 912658 907305
From the above table of all the three years of 2016, 2017, and 2018, it can be interpreted that
two major components of long-term liability consists of Deposits and other borrowings and
debt issues. It has been interpreted that very less amount is charged from the company as tax
because the company belongs to financial sector and they maintain a high leverage situation.
(Commonbank, 2017). It can be seen that Deposits and other public borrowings have been
increasing from 2016 to 2017 but it has shown a decrease in 2018 with a very small change.
ANZ
⊘ This is a preview!⊘
Do you want full access?
Subscribe today to unlock all pages.

Trusted by 1+ million students worldwide

CORPORATE ACCOUNTING 9
Capital 2016 ($m) 2017 ($m) 2018 ($m)
Ordinary share
capital
28765 29088 27205
Reserves 1078 37 323
Retained earnings 27975 29834 31715
Non-controlling
issues
109 116 140
Total Equity 57927 59075 59383
Form, the above table, it is clear that Ordinary share capital of the company has been
fluctuating as it was $28765m in 2016 increased in 2017 and due to some reasons declined in
2018. From the annual report, it is interpreted that the decrease in equity was due to current
on-market buy-back in regards to ordinary shares of $3.0 billion. The report reveals that the
company bought back $1,880 million worth shares in 2018 that resulted in 66.7 million
shares, which are being cancelled during the year. Moreover, the reserve section of the
company is not at all consistent. As seen in the table, the reserves dropped drastically in 2017
(ANZ, 2018). Non-controlling issues depict share in net assets of controlled entities that are
attributable to equity shareholders who the company do not own indirectly or directly.
Therefore, it is important to see that overall heading of equity has increased in 2017 as
compared to 2016 and remained almost consistent in 2018.
Total Liabilities 2016 ($m) 2017 ($m) 2018 ($m)
Settlement balances
owed by ANZ
10625 9914 11810
Collateral received 6386 5919 6542
Deposits and other 588195 595611 618150
Paraphrase This Document
Need a fresh take? Get an instant paraphrase of this document with our AI Paraphraser

CORPORATE ACCOUNTING 10
borrowings
Derivative financial
instruments
88725 62252 69676
Current tax
liabilities
188 241 300
Deferred tax
liabilities
227 257 59
Liabilities held for
sale
- 4693 47159
Policy liabilities 36145 37448 -
External unit holder
liabilities (life
insurance funds)
3333 4435 -
Payables and other
liabilities
8865 8350 6788
Employee
entitlements
543 530 540
Other provisions 666 628 1038
Debt issuances 113044 107,973 121179
Total liabilities 856942 838251 883241
While analysing the above table, two most important component of liabilities are Debt
issuances, Deposits, and other borrowings. Form the above table, it can be interpreted that
long-term debt has been increasing in 2018 as compared to 2016 and 2017. It has shown a
significant change in debt in 2017 as compared to 2016 (ANZ, 2016). The other component is

CORPORATE ACCOUNTING 11
Deposits and other borrowings, which has been increasing consistently throughout all the
three years. It is important to know that banking industry always maintains a high proportion
of debt as seen in the table above but the company is able to maintain a level of consistency.
Comparison of debt-equity ratio
Company 2016 2017 2018
Westpac 14.44 13.90 13.63
Commonwealth 15.50 15.46 14.49
ANZ 15.82 15.54 15.97
From the above comparison of debt-equity ratio of the three companies from the financial
sector for three years from 2016 to 2018. It is seen that the debt-equity ratio of banking sector
is much higher than other sectors. Many economist have believed that it is optimal for the
banks debt-ratio to have high debt-ratio. Economists researched a model named “Modigliani
and Miller” which provides idealised baseline to analyse the bank capital structure in such a
market where a liquid financial claim is demanded. This model assumes various risk
associated with the banking operations. It also excludes deposit insurance, any other
distortions, agency problems, and taxes, which will ultimately lead to opt for levered capital
structure. According to the above table, it is clearly seen that all three companies have same
debt-equity ratio. In 2016, debt-equity ratio of ANZ is higher between Westpac and
Commonwealth. In 2017, ANZ has higher leverage ratio but commonwealth is much far
behind. At last, all the three companies maintains a leverage of 14 to 15 per cent (ANZ,
2017).
⊘ This is a preview!⊘
Do you want full access?
Subscribe today to unlock all pages.

Trusted by 1+ million students worldwide
1 out of 26
Related Documents
Your All-in-One AI-Powered Toolkit for Academic Success.
+13062052269
info@desklib.com
Available 24*7 on WhatsApp / Email
Unlock your academic potential
Copyright © 2020–2025 A2Z Services. All Rights Reserved. Developed and managed by ZUCOL.


