HI5020 Corporate Accounting: Comparative Analysis of Myer & Kathmandu
VerifiedAdded on 2023/06/04
|18
|4290
|486
Report
AI Summary
This report provides a comparative financial analysis of Myer Holdings Ltd and Kathmandu Holdings Ltd, two companies listed on the Australian Securities Exchange (ASX). The analysis covers key areas such as owner's equity, cash flow statements, other comprehensive income statements, and corporate income tax. The report finds that Myer Holdings Ltd has a higher equity compared to Kathmandu Holdings Ltd, but also a higher debt-to-equity ratio, indicating a greater reliance on debt financing. The cash flow analysis reveals that Myer Holdings Ltd made larger investments, resulting in a greater net decrease in cash held. The study also examines the components of other comprehensive income for both companies and calculates their effective tax rates, noting a higher rate for Kathmandu Ltd. The analysis is based on the companies' annual reports and relevant accounting standards.
CORPORATE
ACCOUNTING
2018
ACCOUNTING
2018
Paraphrase This Document
Need a fresh take? Get an instant paraphrase of this document with our AI Paraphraser
Executive Summary
Corporate accounting deals with the procedures related to preparation of balance sheet,
comprehensive statement of profit and loss and cash flow statement. Further, with the
assistance of financial reporting management is able to disclose the financial position of the
company to investors, administrators as well as to government. Present report revolves
around analysis regarding the equity, cash flow statement, another comprehensive statement
and tax expenses of Myer Holding and Kathmandu Holdings Ltd are done. The study reveals
that the equity of Myer Holdings Ltd is higher than the Kathmandu Ltd. Moreover, the net
decrease in cash flow of Kathmandu Ltd is more due to the repayment of loans and
procurement of assets. Since the profit is already included in the other comprehensive income
statement, there will be no impact on the shareholder's profit appropriation in case
comprehensive income items are included in profit and loss account. Subsequently, an
effective tax rate of both the companies is calculated under which the tax rate of Kathmandu
Ltd is more in comparison to Myer Ltd.
Table of Contents
Introduction................................................................................................................................5
Overview of Companies............................................................................................................5
Myer Holdings Ltd.................................................................................................................5
Kathmandu Holdings Ltd.......................................................................................................5
OWNERS EQUITY...................................................................................................................6
(I)............................................................................................................................................6
(II)..........................................................................................................................................7
CASH FLOWS STATEMENT..........................................................................................7
(III).........................................................................................................................................7
(IV).........................................................................................................................................9
(V)........................................................................................................................................10
OTHER COMPREHENSIVE INCOME STATEMENT........................................................10
(VI).......................................................................................................................................10
(VII)......................................................................................................................................11
(IX).......................................................................................................................................12
ACCOUNTING FOR CROPORATE INCOME TAX............................................................13
(X)........................................................................................................................................13
(XI).......................................................................................................................................13
(XII)......................................................................................................................................14
(XIII)....................................................................................................................................14
(XIV)....................................................................................................................................15
(XV).....................................................................................................................................15
(XVI)....................................................................................................................................16
Conclusion................................................................................................................................16
References................................................................................................................................17
⊘ This is a preview!⊘
Do you want full access?
Subscribe today to unlock all pages.
Trusted by 1+ million students worldwide
List of Tables
Table 1: Equity assessment of Myer Ltd and Kathmandu Ltd...................................................6
Table 2: Statement representing debt-equity of both the companies.........................................7
Table 3: Statement representing variants of cash flow statement of Myer Holdings................8
Table 4: Statement representing variants of cash flow statement of Kathmandu Holdings......8
Table 5: Statement representing comparative analysis of cash flow statement of Myer
Holdings.....................................................................................................................................9
Table 6: Statement representing comparative analysis of cash flow statement of Kathmandu
Holdings.....................................................................................................................................9
Table 7: Comparative Analysis of Cash Flow of Myer Holding and Kathmandu Holding.....10
Table 8 Elements of Other Comprehensive Income of Myer Holding....................................11
Table 9: Elements of Other Comprehensive Income of Kathmandu Holding.........................11
Table 10: Statement presenting income tax expense of Myer Holding and Kathmandu
Holding.....................................................................................................................................13
Table 11: Statement representing deferred tax asset and deferred tax liabilities.....................14
Paraphrase This Document
Need a fresh take? Get an instant paraphrase of this document with our AI Paraphraser
INTRODUCTION
Financial Reporting comprises disclosure of financial information to the various stakeholders
relating to financial performance and financial position of the company over a specified time.
Each part of the financial report, i.e. statement of profit and loss, statement of affairs of the
company, statement of changes in equity and cash flow statement reveal significant
information relating to the organization. The manner in which operations are being continued
in the company can be revealed from same. The present report provides an assessment of
equity, other comprehensive income, taxation and cash flow of Mayer Holding and
Kathmandu Holding. Further, all these specified parts of the financial report of both the
companies have been compared in order to provide an appropriate opinion.
OVERVIEW OF COMPANIES
Myer Holdings Ltd
Myer Holdings Limited (Myer) is a department store company situated in Australia. Its
department store network comprises a trail of about 60 retail locations in Australia. The Myer
retail deals with 11 different types of products such as Women’s wear, Menswear, Youth
shop, Intimate wears, Cosmetics, perfumes, homewares, electrical appliances, toys, handbags,
accessories along with general products. In addition to this, it also owns women wear fashion
brand sass & bide, which is an Australian designer brand. The brand of the company
comprises TOPSHOP TOPMAN, Seed, French Connection, Mimco, Veronika Mainr, Jack &
Jones as well as Industrie. Moreover, its ancillary companies are Myer Pty Ltd, NB Elizabeth
Pty, NB Russell Pty Ltd, Warehouse Solutions Pty Ltd, Myer Group Finance Ltd, Myer
Group Pty Ltd and Myer Travel Pty Ltd. Apart from this, the company also undertakes
activities outside the department store with its ancillaries sass & bide, FSS Retail Pty Ltd.
Kathmandu Holdings Ltd
Kathmandu Holdings Ltd is a public company established in New Zealand dealing with
design, marketing and retail sale of clothing as well as clothing and equipment for travel and
outdoor use. Approximately1900 employees are employed in the company. It operates in
New Zealand, Australia and UK. Further, it is administrated by its head office in
Christchurch which is located in New Zealand. Currently, the company is functioning 163
stores including 47 in New Zealand, 115 in Australia and 1 in the UK. Apart from this,
Kathmandu manufactures its house-branded items, along with its product variety comprising
apparel such as waterproof jackets, down jackets, thermals, fleece jackets, shirts and pants,
merino clothing and thermals as well as footwear, socks etc.
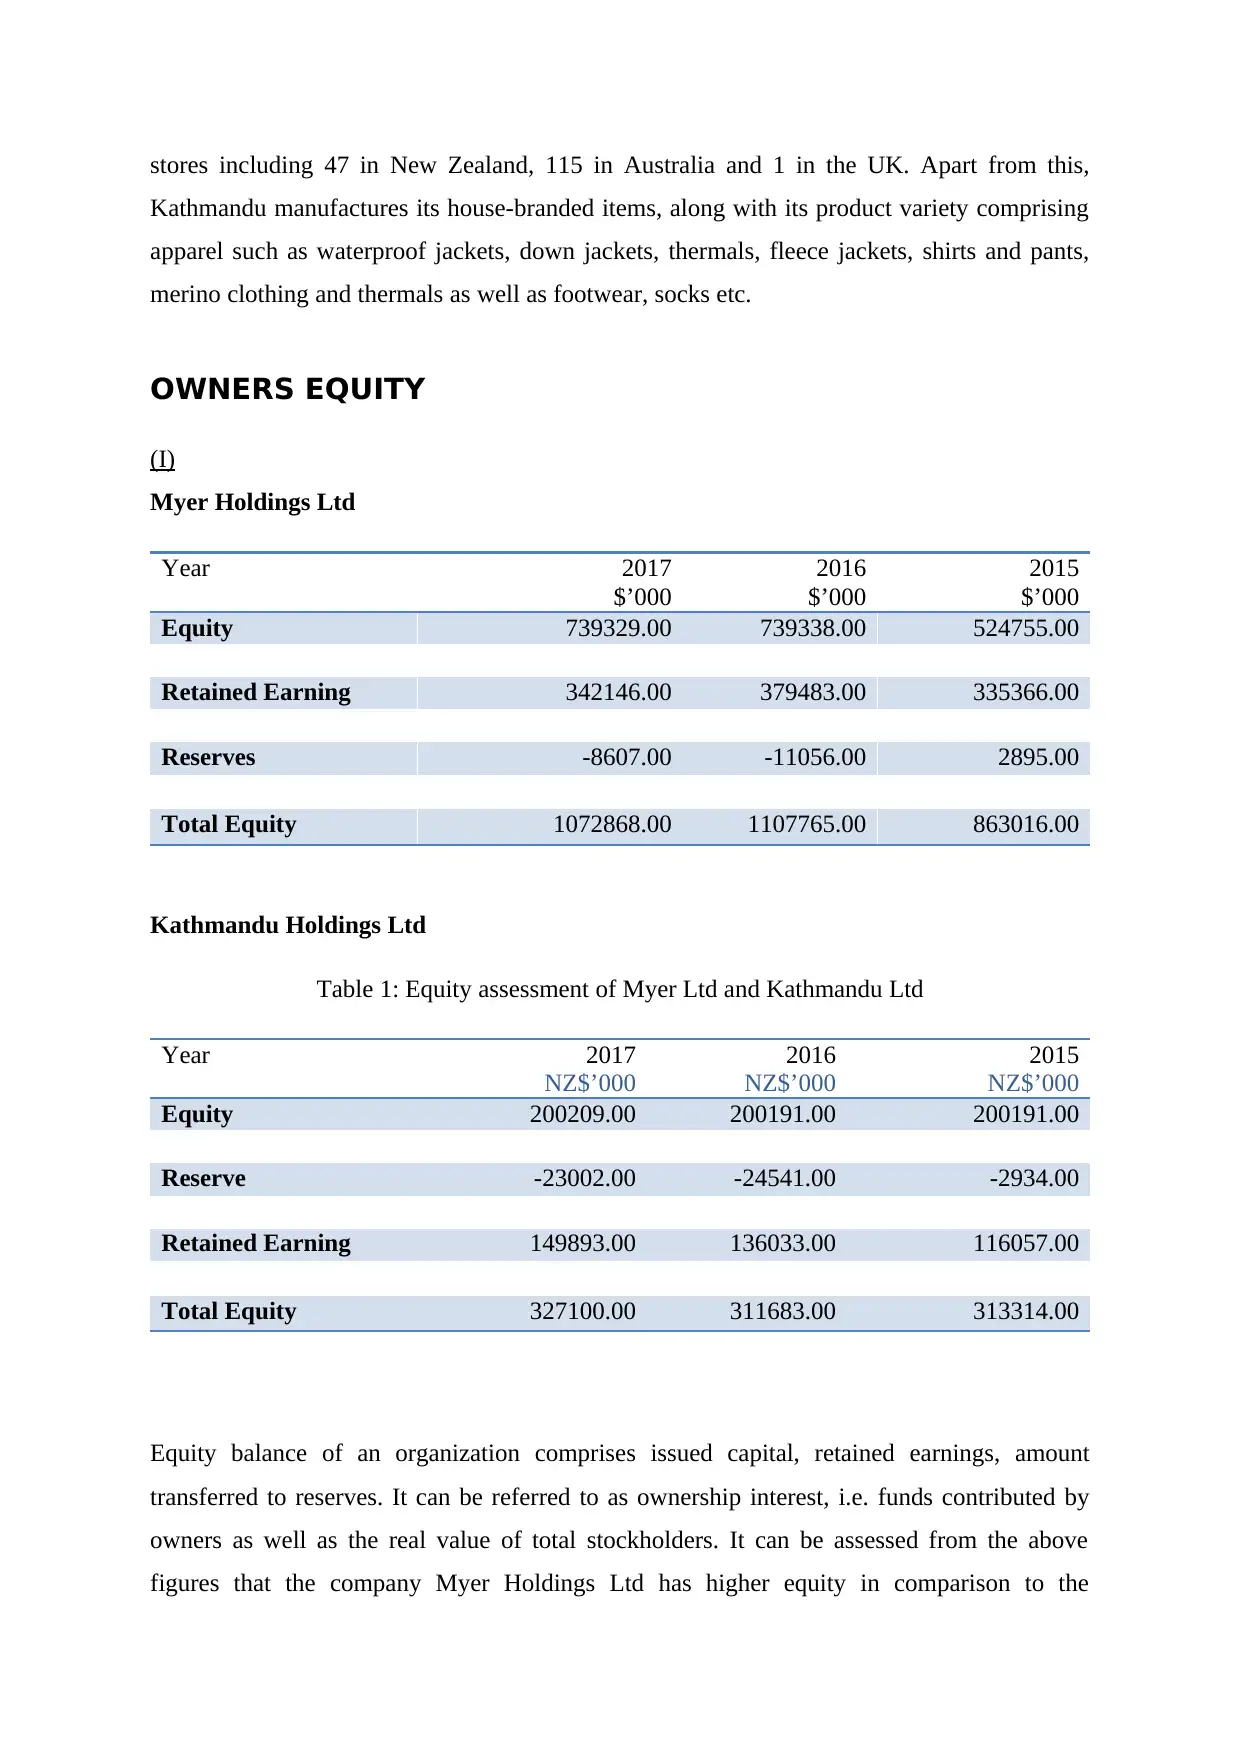
OWNERS EQUITY
(I)
Myer Holdings Ltd
Year 2017
$’000
2016
$’000
2015
$’000
Equity 739329.00 739338.00 524755.00
Retained Earning 342146.00 379483.00 335366.00
Reserves -8607.00 -11056.00 2895.00
Total Equity 1072868.00 1107765.00 863016.00
Kathmandu Holdings Ltd
Table 1: Equity assessment of Myer Ltd and Kathmandu Ltd
Year 2017
NZ$’000
2016
NZ$’000
2015
NZ$’000
Equity 200209.00 200191.00 200191.00
Reserve -23002.00 -24541.00 -2934.00
Retained Earning 149893.00 136033.00 116057.00
Total Equity 327100.00 311683.00 313314.00
Equity balance of an organization comprises issued capital, retained earnings, amount
transferred to reserves. It can be referred to as ownership interest, i.e. funds contributed by
owners as well as the real value of total stockholders. It can be assessed from the above
figures that the company Myer Holdings Ltd has higher equity in comparison to the
Kathmandu manufactures its house-branded items, along with its product variety comprising
apparel such as waterproof jackets, down jackets, thermals, fleece jackets, shirts and pants,
merino clothing and thermals as well as footwear, socks etc.
OWNERS EQUITY
(I)
Myer Holdings Ltd
Year 2017
$’000
2016
$’000
2015
$’000
Equity 739329.00 739338.00 524755.00
Retained Earning 342146.00 379483.00 335366.00
Reserves -8607.00 -11056.00 2895.00
Total Equity 1072868.00 1107765.00 863016.00
Kathmandu Holdings Ltd
Table 1: Equity assessment of Myer Ltd and Kathmandu Ltd
Year 2017
NZ$’000
2016
NZ$’000
2015
NZ$’000
Equity 200209.00 200191.00 200191.00
Reserve -23002.00 -24541.00 -2934.00
Retained Earning 149893.00 136033.00 116057.00
Total Equity 327100.00 311683.00 313314.00
Equity balance of an organization comprises issued capital, retained earnings, amount
transferred to reserves. It can be referred to as ownership interest, i.e. funds contributed by
owners as well as the real value of total stockholders. It can be assessed from the above
figures that the company Myer Holdings Ltd has higher equity in comparison to the
⊘ This is a preview!⊘
Do you want full access?
Subscribe today to unlock all pages.
Trusted by 1+ million students worldwide
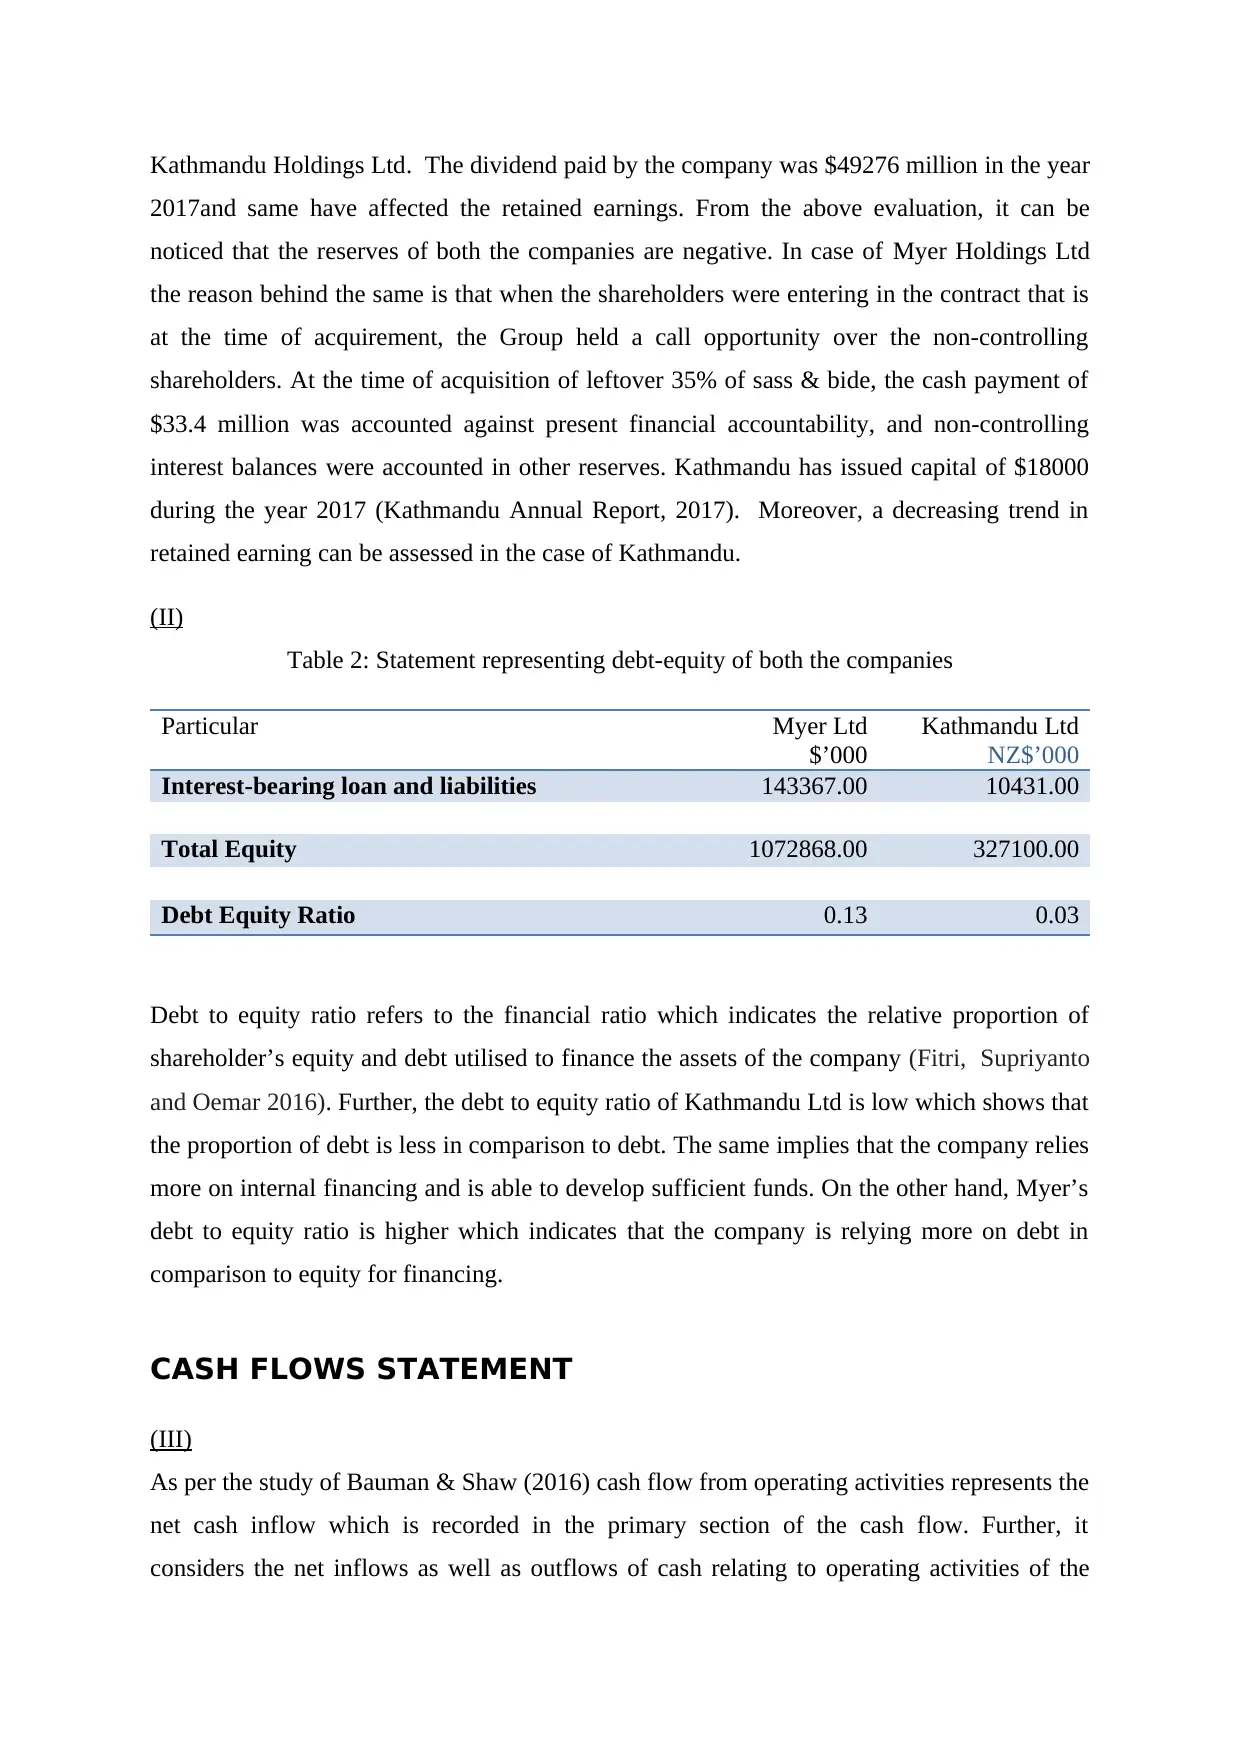
Kathmandu Holdings Ltd. The dividend paid by the company was $49276 million in the year
2017and same have affected the retained earnings. From the above evaluation, it can be
noticed that the reserves of both the companies are negative. In case of Myer Holdings Ltd
the reason behind the same is that when the shareholders were entering in the contract that is
at the time of acquirement, the Group held a call opportunity over the non-controlling
shareholders. At the time of acquisition of leftover 35% of sass & bide, the cash payment of
$33.4 million was accounted against present financial accountability, and non-controlling
interest balances were accounted in other reserves. Kathmandu has issued capital of $18000
during the year 2017 (Kathmandu Annual Report, 2017). Moreover, a decreasing trend in
retained earning can be assessed in the case of Kathmandu.
(II)
Table 2: Statement representing debt-equity of both the companies
Particular Myer Ltd
$’000
Kathmandu Ltd
NZ$’000
Interest-bearing loan and liabilities 143367.00 10431.00
Total Equity 1072868.00 327100.00
Debt Equity Ratio 0.13 0.03
Debt to equity ratio refers to the financial ratio which indicates the relative proportion of
shareholder’s equity and debt utilised to finance the assets of the company (Fitri, Supriyanto
and Oemar 2016). Further, the debt to equity ratio of Kathmandu Ltd is low which shows that
the proportion of debt is less in comparison to debt. The same implies that the company relies
more on internal financing and is able to develop sufficient funds. On the other hand, Myer’s
debt to equity ratio is higher which indicates that the company is relying more on debt in
comparison to equity for financing.
CASH FLOWS STATEMENT
(III)
As per the study of Bauman & Shaw (2016) cash flow from operating activities represents the
net cash inflow which is recorded in the primary section of the cash flow. Further, it
considers the net inflows as well as outflows of cash relating to operating activities of the
Paraphrase This Document
Need a fresh take? Get an instant paraphrase of this document with our AI Paraphraser
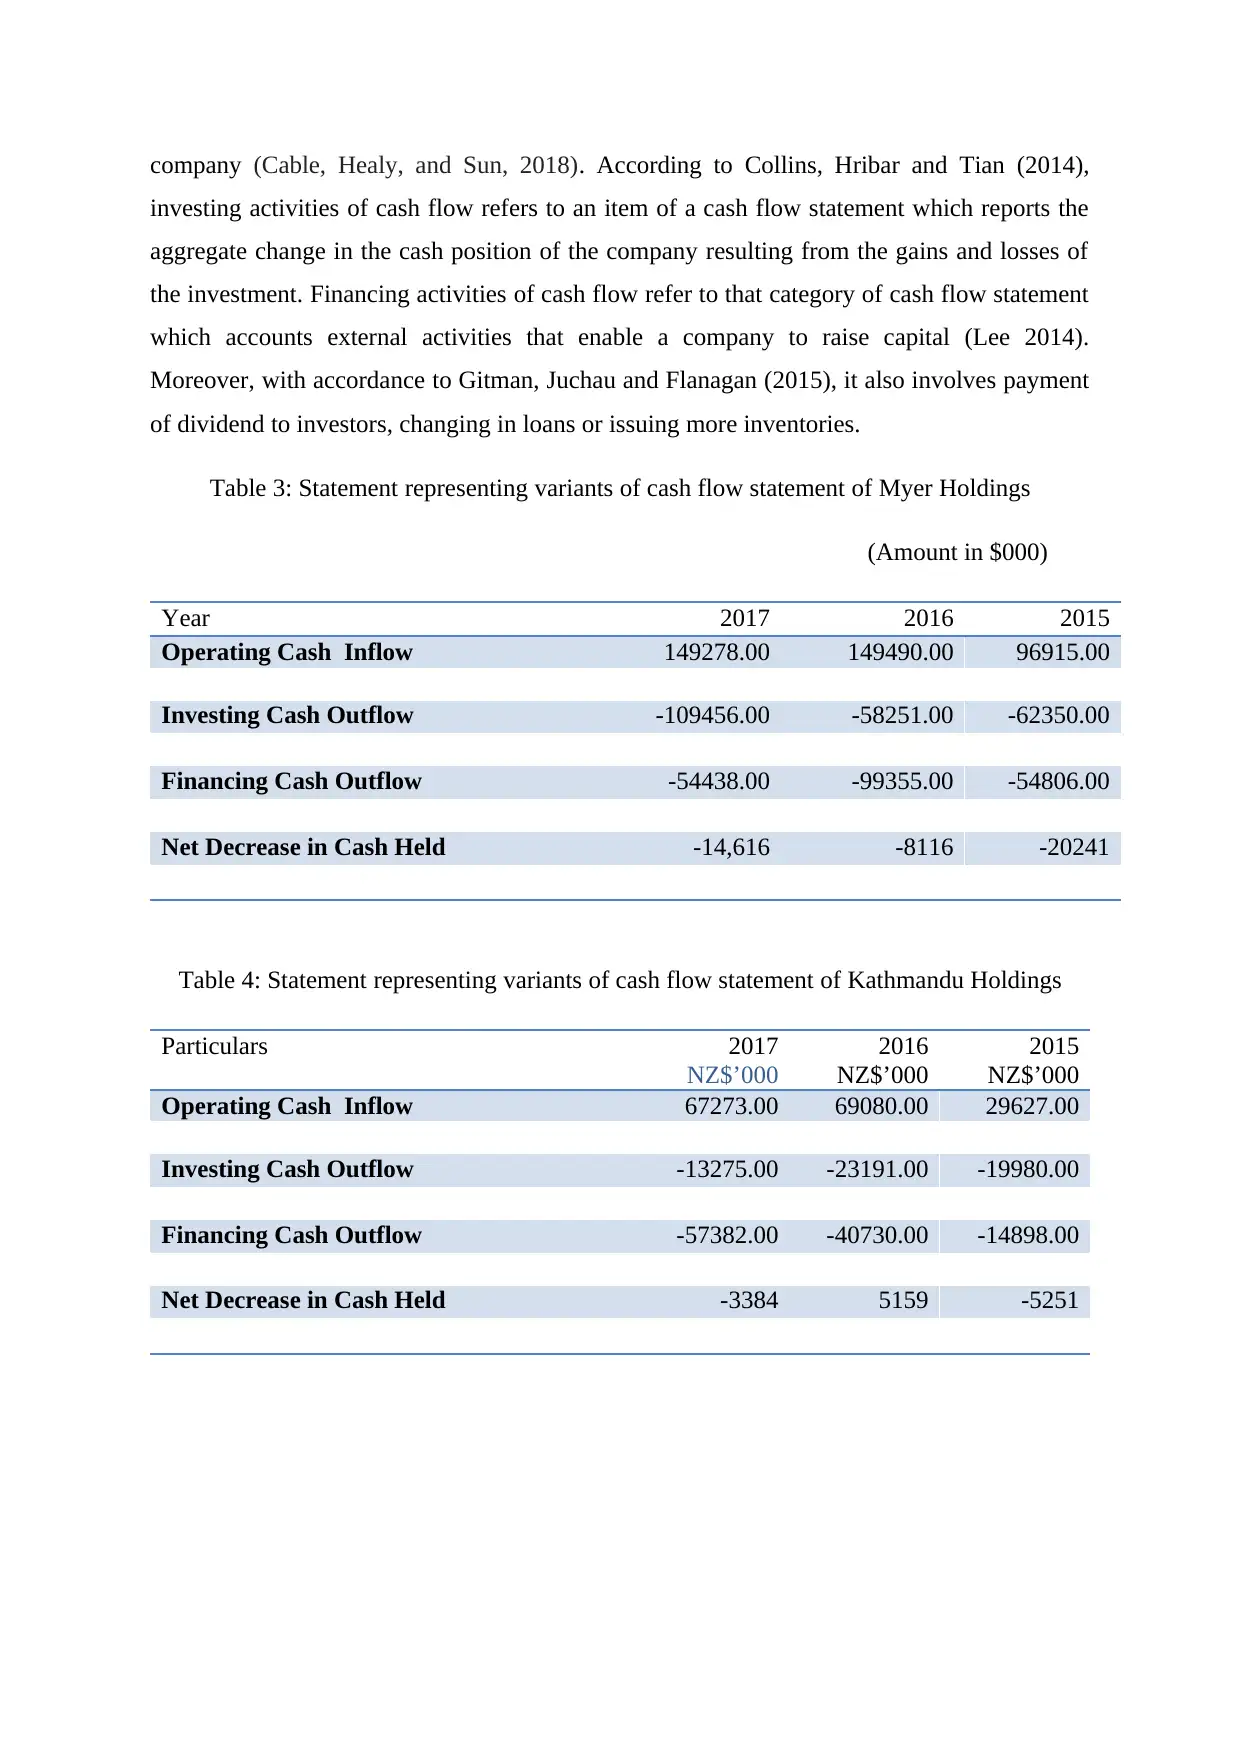
company (Cable, Healy, and Sun, 2018). According to Collins, Hribar and Tian (2014),
investing activities of cash flow refers to an item of a cash flow statement which reports the
aggregate change in the cash position of the company resulting from the gains and losses of
the investment. Financing activities of cash flow refer to that category of cash flow statement
which accounts external activities that enable a company to raise capital (Lee 2014).
Moreover, with accordance to Gitman, Juchau and Flanagan (2015), it also involves payment
of dividend to investors, changing in loans or issuing more inventories.
Table 3: Statement representing variants of cash flow statement of Myer Holdings
(Amount in $000)
Year 2017 2016 2015
Operating Cash Inflow 149278.00 149490.00 96915.00
Investing Cash Outflow -109456.00 -58251.00 -62350.00
Financing Cash Outflow -54438.00 -99355.00 -54806.00
Net Decrease in Cash Held -14,616 -8116 -20241
Table 4: Statement representing variants of cash flow statement of Kathmandu Holdings
Particulars 2017
NZ$’000
2016
NZ$’000
2015
NZ$’000
Operating Cash Inflow 67273.00 69080.00 29627.00
Investing Cash Outflow -13275.00 -23191.00 -19980.00
Financing Cash Outflow -57382.00 -40730.00 -14898.00
Net Decrease in Cash Held -3384 5159 -5251
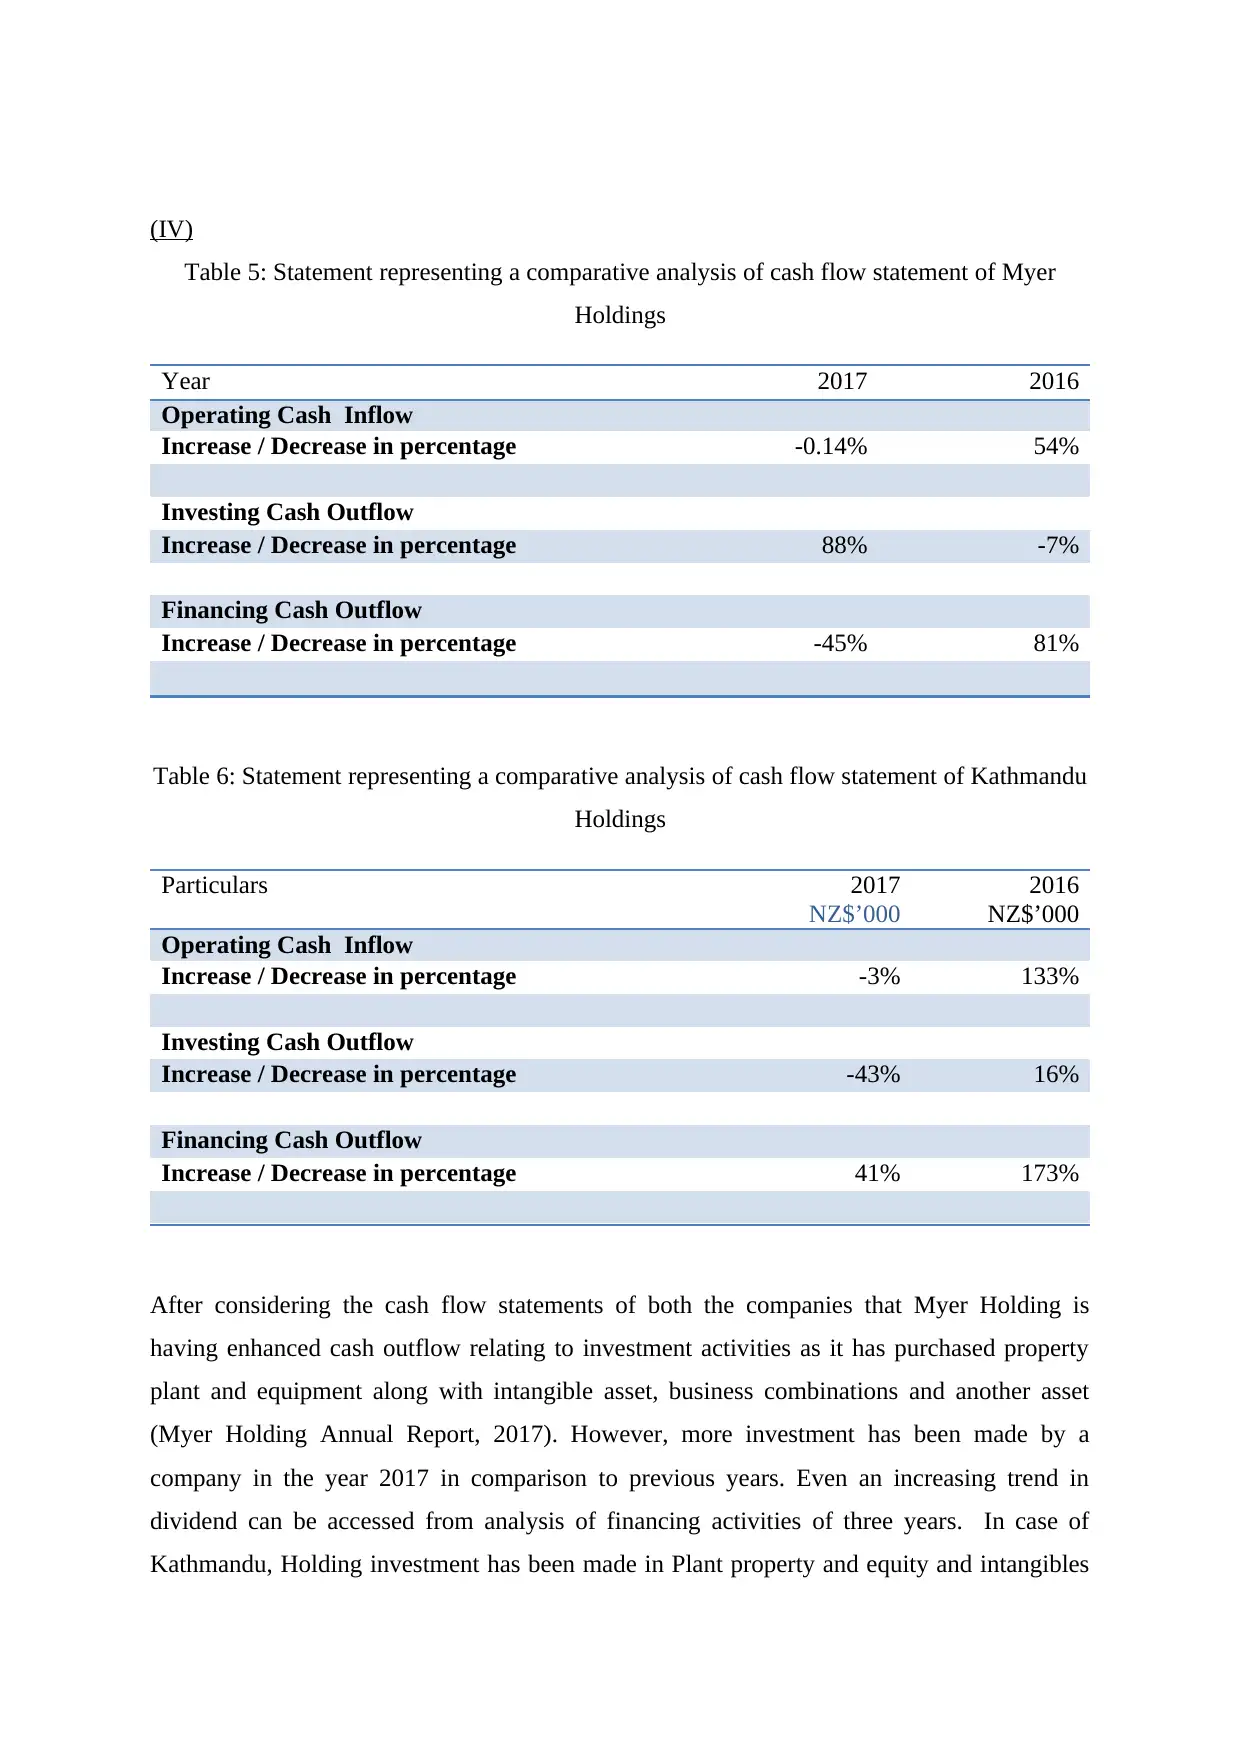
(IV)
Table 5: Statement representing a comparative analysis of cash flow statement of Myer
Holdings
Year 2017 2016
Operating Cash Inflow
Increase / Decrease in percentage -0.14% 54%
Investing Cash Outflow
Increase / Decrease in percentage 88% -7%
Financing Cash Outflow
Increase / Decrease in percentage -45% 81%
Table 6: Statement representing a comparative analysis of cash flow statement of Kathmandu
Holdings
Particulars 2017
NZ$’000
2016
NZ$’000
Operating Cash Inflow
Increase / Decrease in percentage -3% 133%
Investing Cash Outflow
Increase / Decrease in percentage -43% 16%
Financing Cash Outflow
Increase / Decrease in percentage 41% 173%
After considering the cash flow statements of both the companies that Myer Holding is
having enhanced cash outflow relating to investment activities as it has purchased property
plant and equipment along with intangible asset, business combinations and another asset
(Myer Holding Annual Report, 2017). However, more investment has been made by a
company in the year 2017 in comparison to previous years. Even an increasing trend in
dividend can be accessed from analysis of financing activities of three years. In case of
Kathmandu, Holding investment has been made in Plant property and equity and intangibles
⊘ This is a preview!⊘
Do you want full access?
Subscribe today to unlock all pages.
Trusted by 1+ million students worldwide
only. After analyzing three years, it can be concluded that major of the investment has been
made in the year 2016 (Kathmandu Holdings Ltd Annual Report 2017).
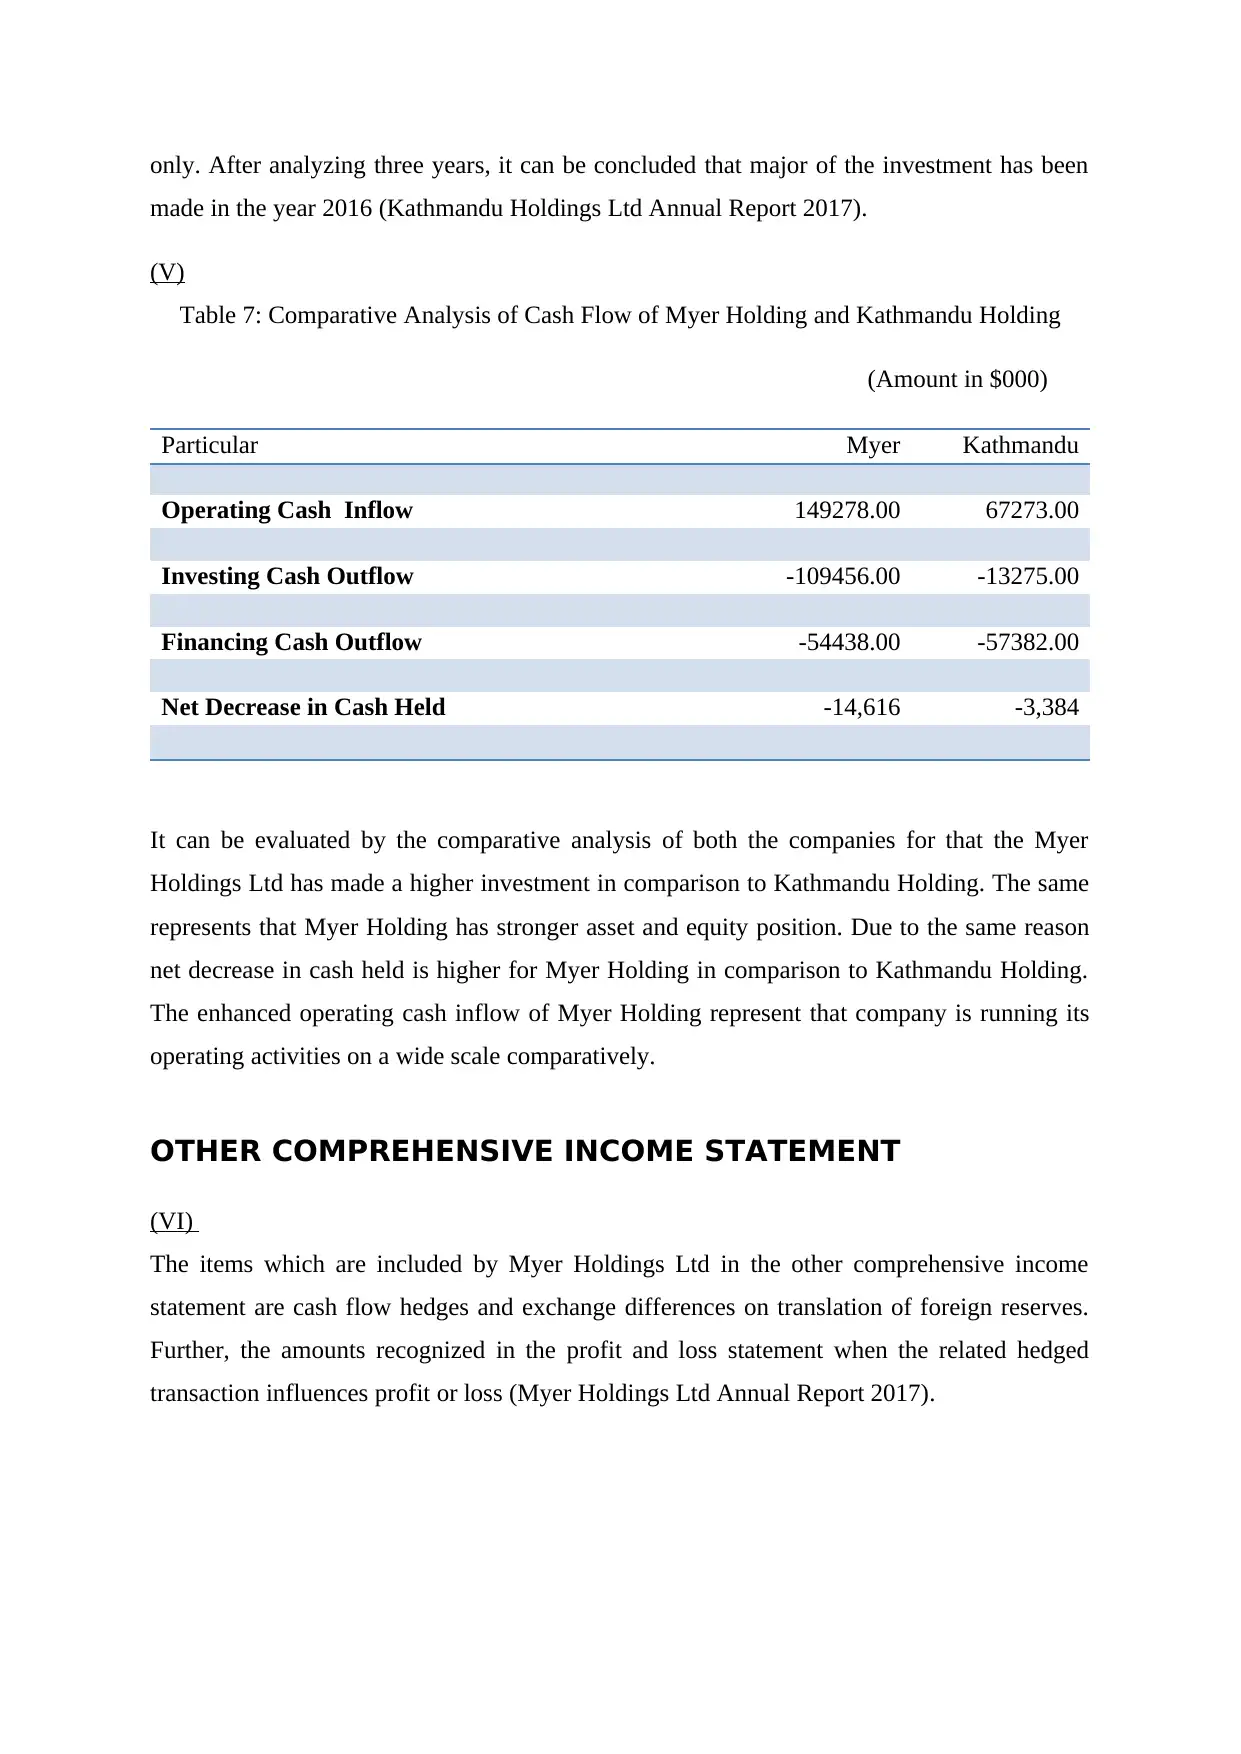
(V)
Table 7: Comparative Analysis of Cash Flow of Myer Holding and Kathmandu Holding
(Amount in $000)
Particular Myer Kathmandu
Operating Cash Inflow 149278.00 67273.00
Investing Cash Outflow -109456.00 -13275.00
Financing Cash Outflow -54438.00 -57382.00
Net Decrease in Cash Held -14,616 -3,384
It can be evaluated by the comparative analysis of both the companies for that the Myer
Holdings Ltd has made a higher investment in comparison to Kathmandu Holding. The same
represents that Myer Holding has stronger asset and equity position. Due to the same reason
net decrease in cash held is higher for Myer Holding in comparison to Kathmandu Holding.
The enhanced operating cash inflow of Myer Holding represent that company is running its
operating activities on a wide scale comparatively.
OTHER COMPREHENSIVE INCOME STATEMENT
(VI)
The items which are included by Myer Holdings Ltd in the other comprehensive income
statement are cash flow hedges and exchange differences on translation of foreign reserves.
Further, the amounts recognized in the profit and loss statement when the related hedged
transaction influences profit or loss (Myer Holdings Ltd Annual Report 2017).
made in the year 2016 (Kathmandu Holdings Ltd Annual Report 2017).
(V)
Table 7: Comparative Analysis of Cash Flow of Myer Holding and Kathmandu Holding
(Amount in $000)
Particular Myer Kathmandu
Operating Cash Inflow 149278.00 67273.00
Investing Cash Outflow -109456.00 -13275.00
Financing Cash Outflow -54438.00 -57382.00
Net Decrease in Cash Held -14,616 -3,384
It can be evaluated by the comparative analysis of both the companies for that the Myer
Holdings Ltd has made a higher investment in comparison to Kathmandu Holding. The same
represents that Myer Holding has stronger asset and equity position. Due to the same reason
net decrease in cash held is higher for Myer Holding in comparison to Kathmandu Holding.
The enhanced operating cash inflow of Myer Holding represent that company is running its
operating activities on a wide scale comparatively.
OTHER COMPREHENSIVE INCOME STATEMENT
(VI)
The items which are included by Myer Holdings Ltd in the other comprehensive income
statement are cash flow hedges and exchange differences on translation of foreign reserves.
Further, the amounts recognized in the profit and loss statement when the related hedged
transaction influences profit or loss (Myer Holdings Ltd Annual Report 2017).
Paraphrase This Document
Need a fresh take? Get an instant paraphrase of this document with our AI Paraphraser
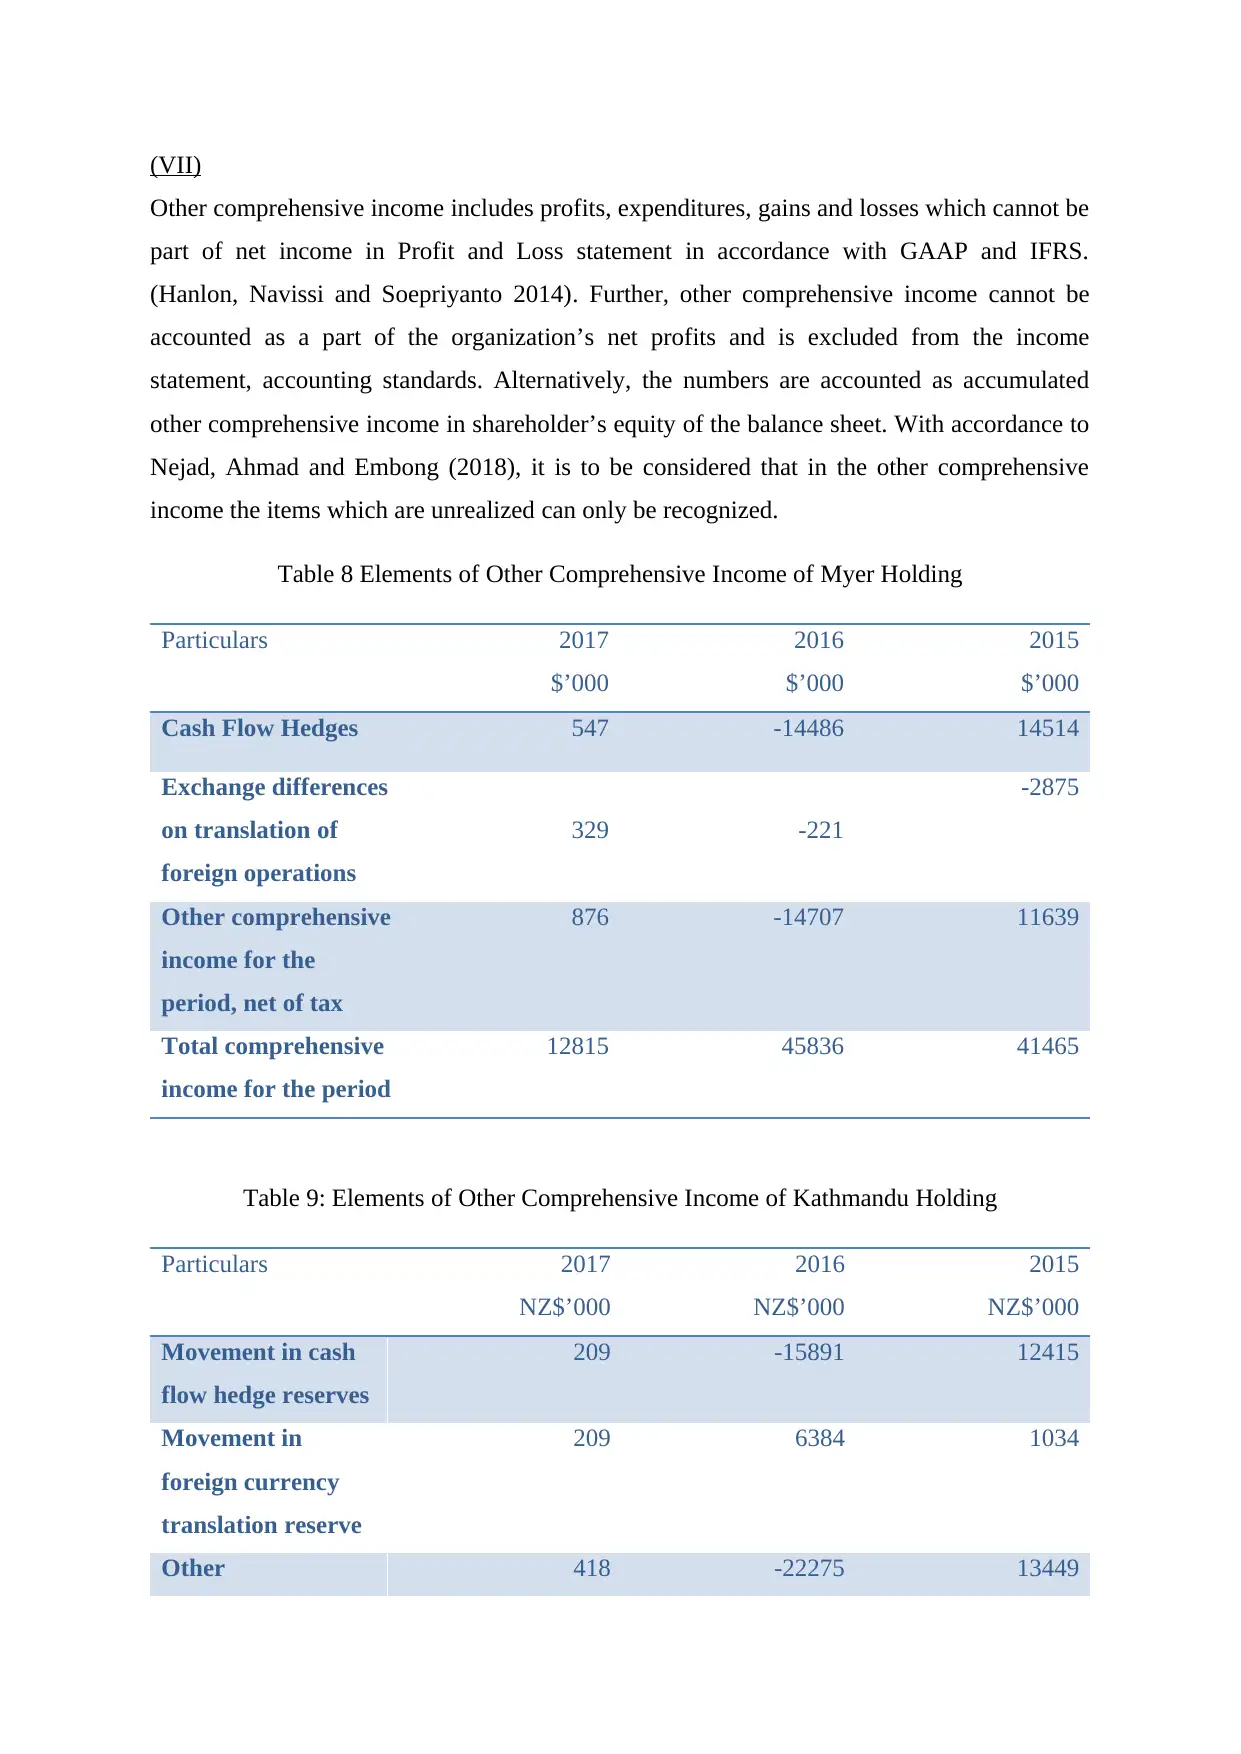
(VII)
Other comprehensive income includes profits, expenditures, gains and losses which cannot be
part of net income in Profit and Loss statement in accordance with GAAP and IFRS.
(Hanlon, Navissi and Soepriyanto 2014). Further, other comprehensive income cannot be
accounted as a part of the organization’s net profits and is excluded from the income
statement, accounting standards. Alternatively, the numbers are accounted as accumulated
other comprehensive income in shareholder’s equity of the balance sheet. With accordance to
Nejad, Ahmad and Embong (2018), it is to be considered that in the other comprehensive
income the items which are unrealized can only be recognized.
Table 8 Elements of Other Comprehensive Income of Myer Holding
Particulars 2017
$’000
2016
$’000
2015
$’000
Cash Flow Hedges 547 -14486 14514
Exchange differences
on translation of
foreign operations
329 -221
-2875
Other comprehensive
income for the
period, net of tax
876 -14707 11639
Total comprehensive
income for the period
12815 45836 41465
Table 9: Elements of Other Comprehensive Income of Kathmandu Holding
Particulars 2017
NZ$’000
2016
NZ$’000
2015
NZ$’000
Movement in cash
flow hedge reserves
209 -15891 12415
Movement in
foreign currency
translation reserve
209 6384 1034
Other 418 -22275 13449
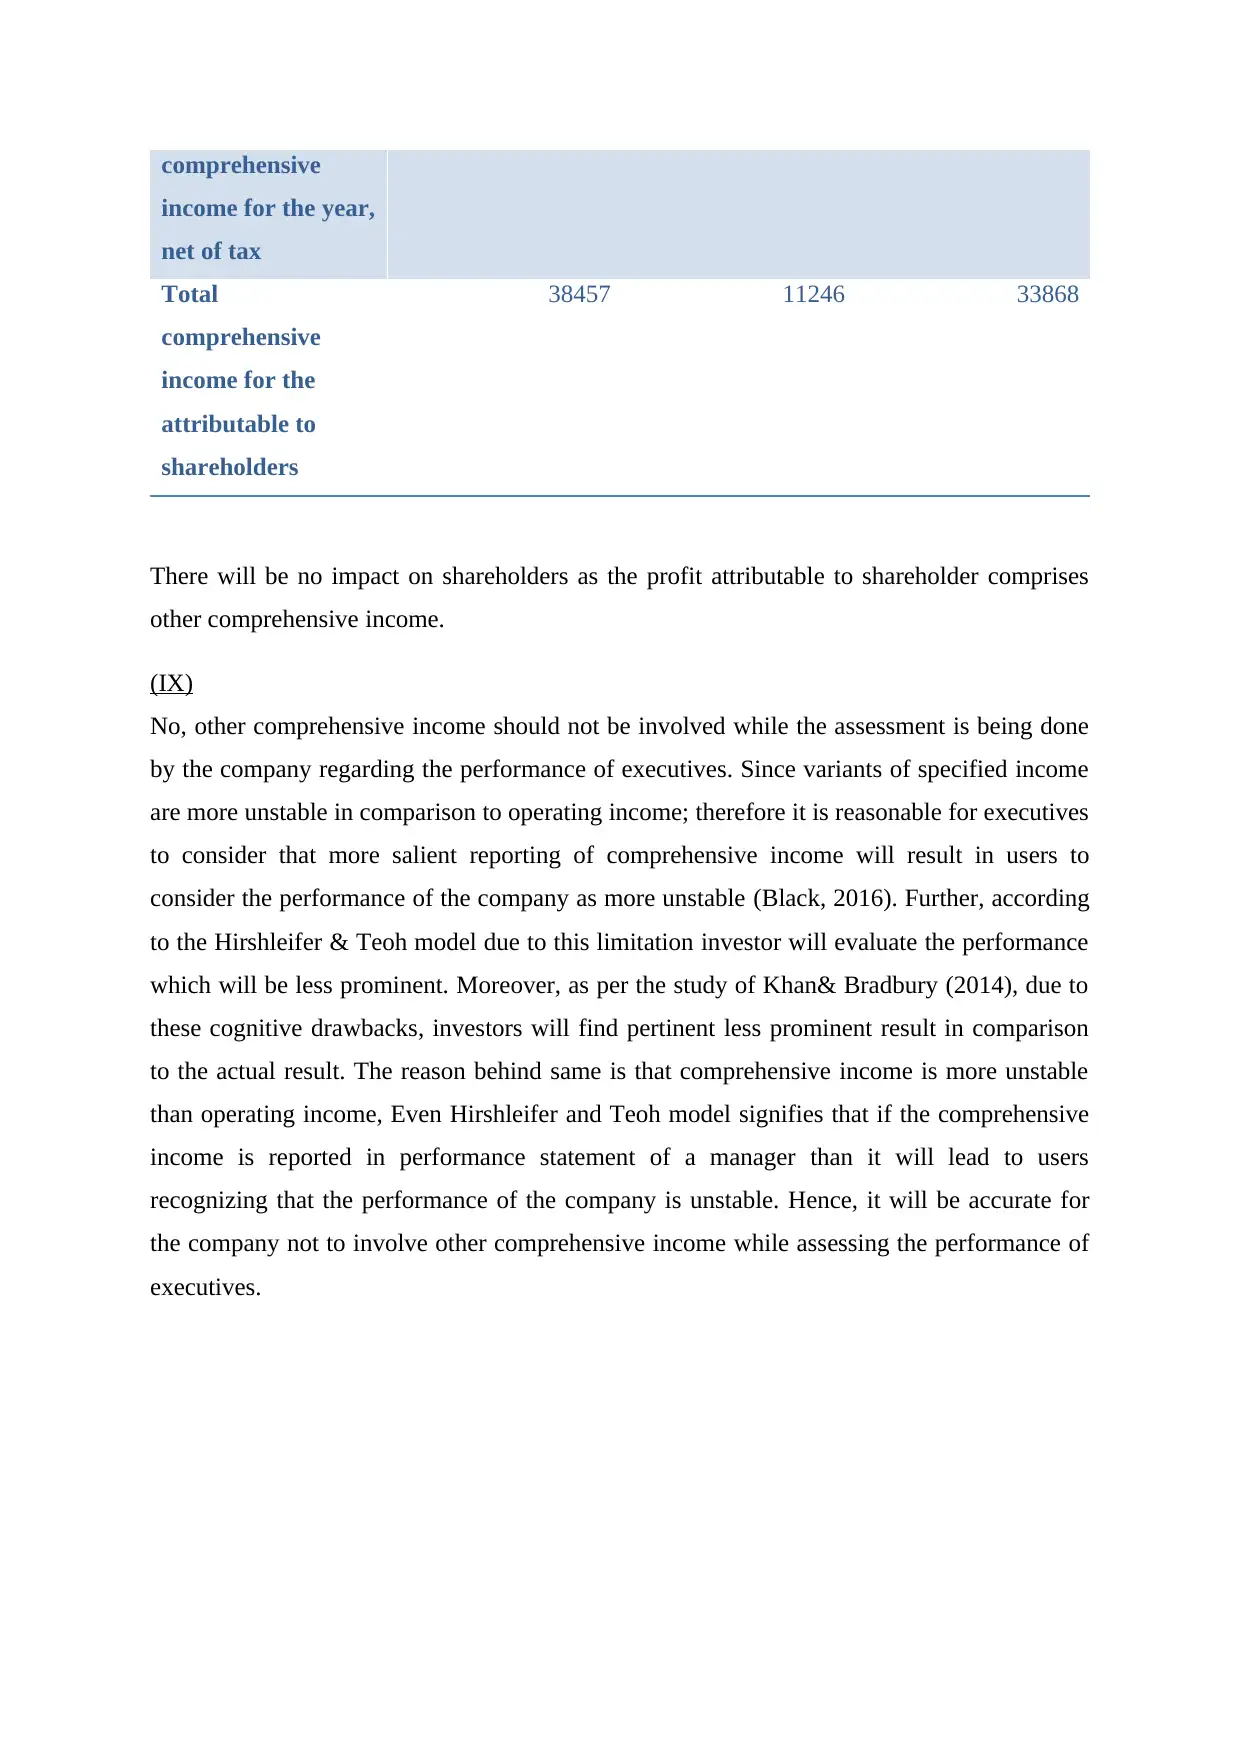
comprehensive
income for the year,
net of tax
Total
comprehensive
income for the
attributable to
shareholders
38457 11246 33868
There will be no impact on shareholders as the profit attributable to shareholder comprises
other comprehensive income.
(IX)
No, other comprehensive income should not be involved while the assessment is being done
by the company regarding the performance of executives. Since variants of specified income
are more unstable in comparison to operating income; therefore it is reasonable for executives
to consider that more salient reporting of comprehensive income will result in users to
consider the performance of the company as more unstable (Black, 2016). Further, according
to the Hirshleifer & Teoh model due to this limitation investor will evaluate the performance
which will be less prominent. Moreover, as per the study of Khan& Bradbury (2014), due to
these cognitive drawbacks, investors will find pertinent less prominent result in comparison
to the actual result. The reason behind same is that comprehensive income is more unstable
than operating income, Even Hirshleifer and Teoh model signifies that if the comprehensive
income is reported in performance statement of a manager than it will lead to users
recognizing that the performance of the company is unstable. Hence, it will be accurate for
the company not to involve other comprehensive income while assessing the performance of
executives.
⊘ This is a preview!⊘
Do you want full access?
Subscribe today to unlock all pages.
Trusted by 1+ million students worldwide
1 out of 18
Related Documents


Your All-in-One AI-Powered Toolkit for Academic Success.
+13062052269
info@desklib.com
Available 24*7 on WhatsApp / Email
![[object Object]](/_next/static/media/star-bottom.7253800d.svg)
Unlock your academic potential
Copyright © 2020–2026 A2Z Services. All Rights Reserved. Developed and managed by ZUCOL.