HI6007 Statistics for Business Decisions Holmes Institute Assignment
VerifiedAdded on 2023/06/08
|6
|836
|321
Homework Assignment
AI Summary
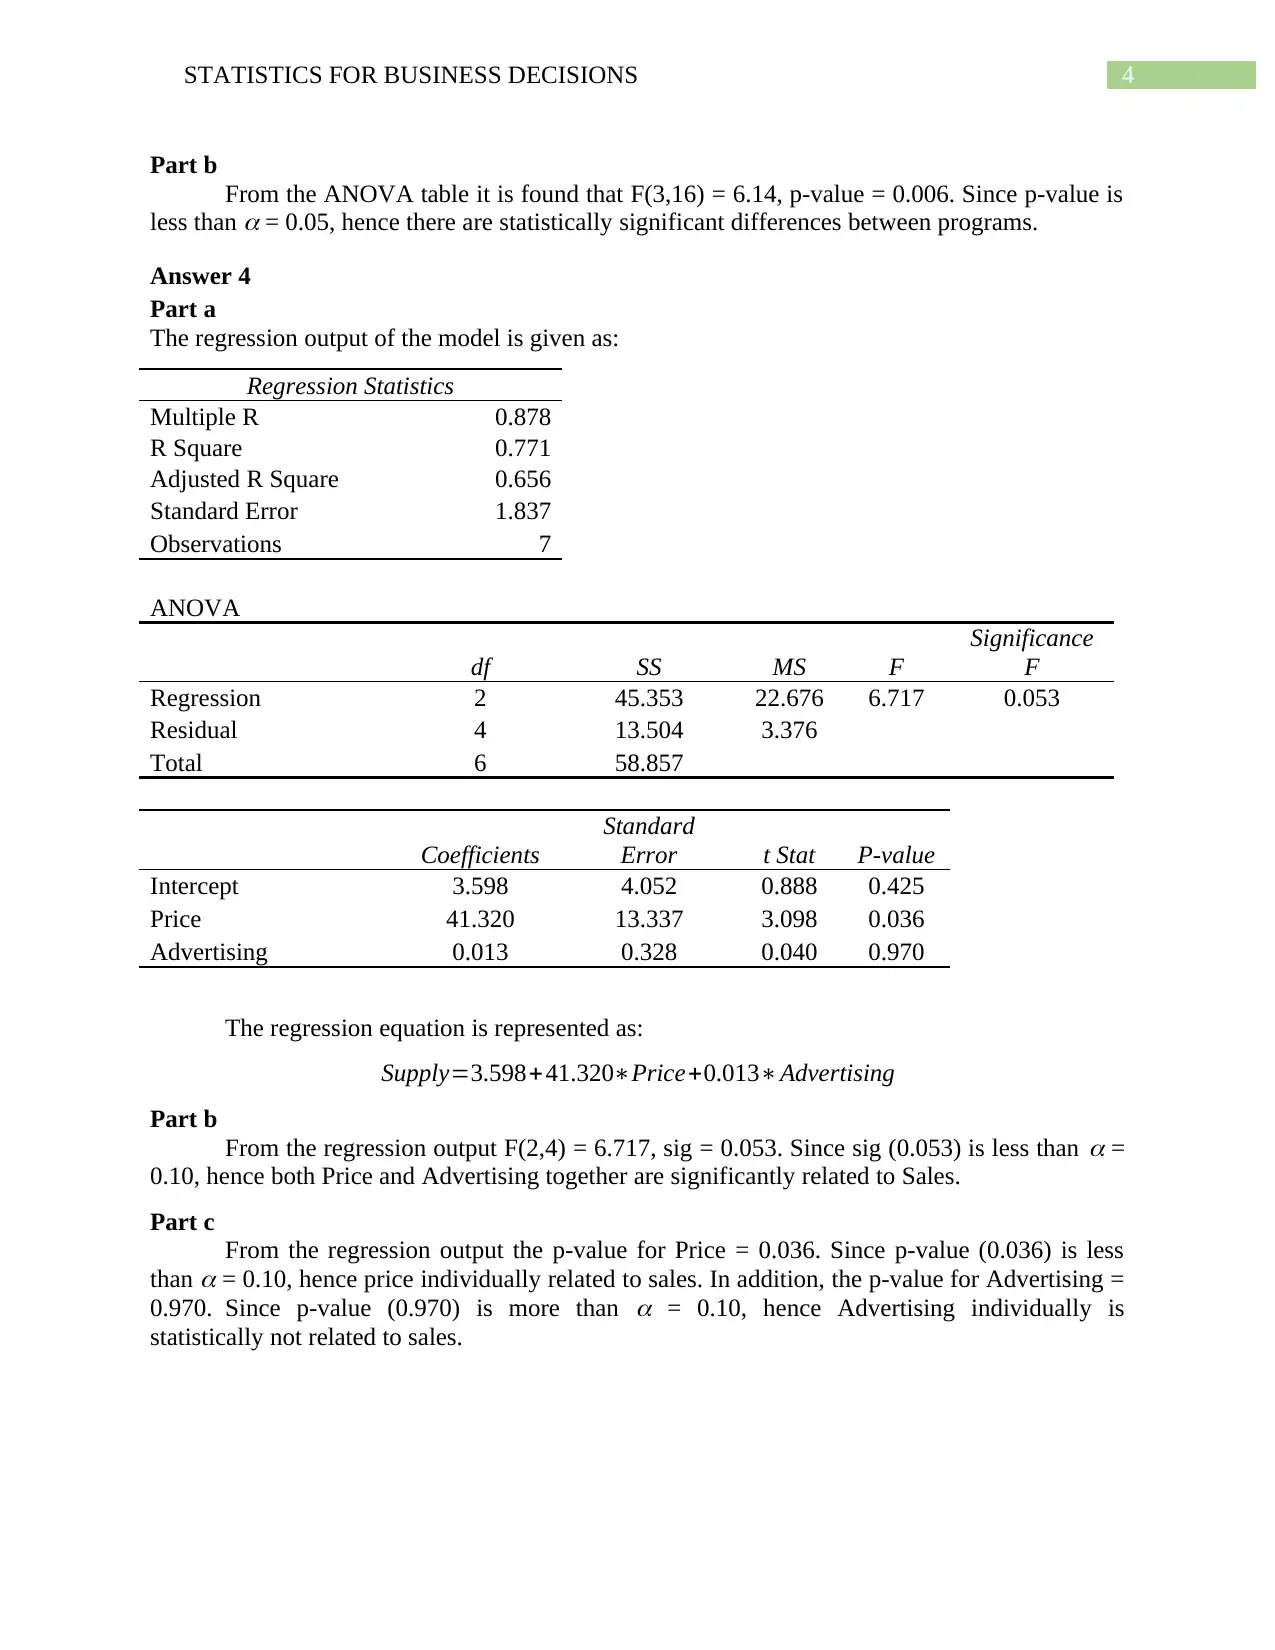
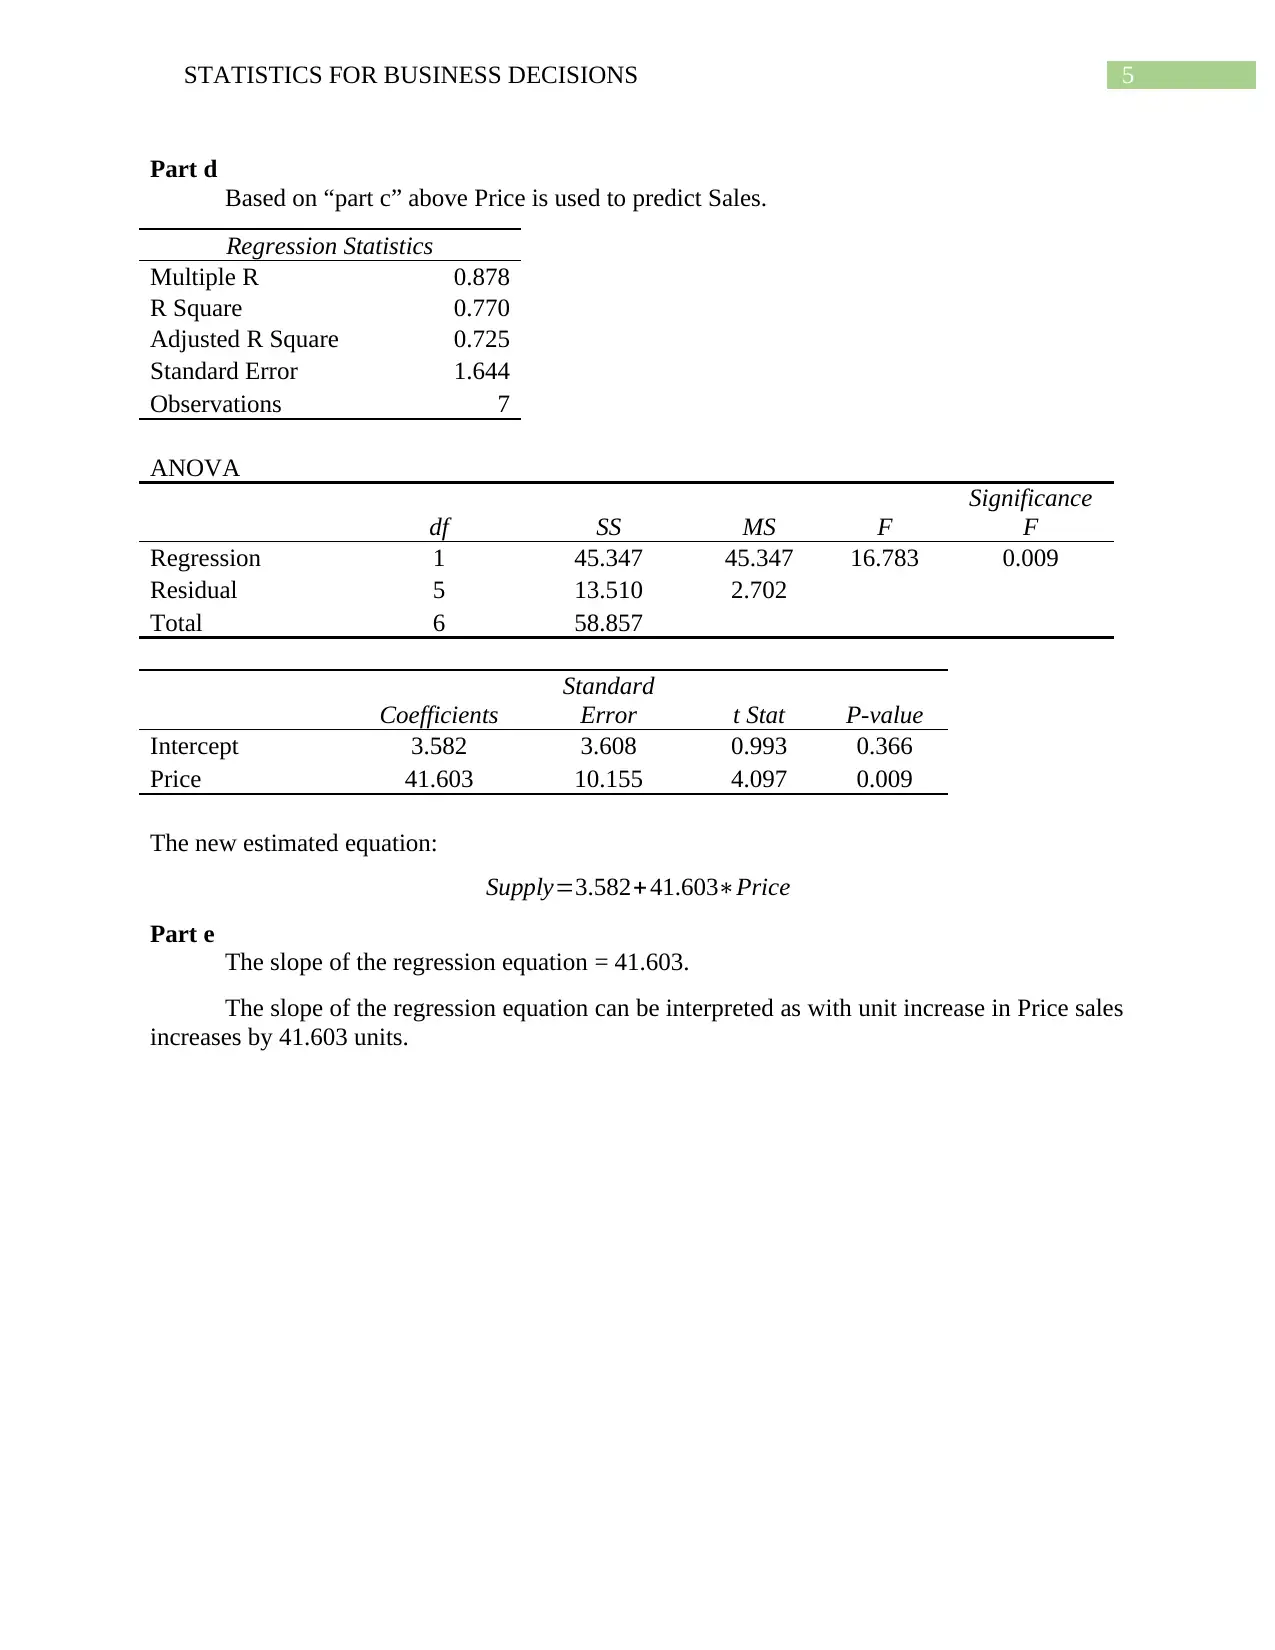
This assignment provides solutions to statistical problems related to business decisions. It includes constructing frequency distributions, histograms, and performing regression analysis to determine the relationship between supply and unit price. ANOVA is used to analyze differences between programs, and regression models are built to predict sales based on price and advertising. The assignment concludes with interpretations of regression coefficients and their impact on sales, offering a comprehensive overview of statistical applications in business. Desklib provides this solved assignment and other resources for students.

Running Head: STATISTICS FOR BUSINESS DECISIONS
Statistics for business decisions
Name of the Student
Name of the University
Author Note
Statistics for business decisions
Name of the Student
Name of the University
Author Note
Paraphrase This Document
Need a fresh take? Get an instant paraphrase of this document with our AI Paraphraser

1STATISTICS FOR BUSINESS DECISIONS
Table of Contents
Answer 1..........................................................................................................................................2
Part a............................................................................................................................................2
Part b............................................................................................................................................2
Answer 2..........................................................................................................................................2
Part a............................................................................................................................................2
Part b............................................................................................................................................3
Part c............................................................................................................................................3
Part d............................................................................................................................................3
Part e............................................................................................................................................3
Answer 3..........................................................................................................................................3
Part a............................................................................................................................................3
Part b............................................................................................................................................3
Answer 4..........................................................................................................................................4
Part a............................................................................................................................................4
Part b............................................................................................................................................4
Part c............................................................................................................................................4
Part d............................................................................................................................................5
Part e............................................................................................................................................5

2STATISTICS FOR BUSINESS DECISIONS
Answer 1
Part a
Class
Width
Frequenc
y
Cumulative
Frequency
Relative
Frequenc
y
Cumulative
Relative
Frequency
Percent
Frequency
50 - 60 3 3 0.15 0.15 15%
70 - 60 2 5 0.1 0.25 10%
80 - 70 6 11 0.3 0.55 30%
90 - 80 4 15 0.2 0.75 20%
100 - 90 5 20 0.25 1 25%
Part b
50 - 60 70 - 60 80 - 70 90 - 80 100 - 90
0%
5%
10%
15%
20%
25%
30%
35%
Distribution of Scores
Class Width
Percentage Frequency
The above image presents the histogram of Scores. From the histogram the scores seem
to be normally distributed.
Answer 2
df SS MS F Significance F
Regression 1 354.689 354.689 1.96622 0.16876
Residual 39 7035.262 180.3913
Total 40 7389.951
Coefficients Standard Error
Intercept 54.076 2.358
X 0.029 0.021
⊘ This is a preview!⊘
Do you want full access?
Subscribe today to unlock all pages.

Trusted by 1+ million students worldwide

3STATISTICS FOR BUSINESS DECISIONS
Part a
The total sample size = d f Regression+d f Residual +1=1+39+1=41
Part b
From the above calculation it is found that F(1,39) = 1.96622, Sig = 0.16876. Since sig-
value is less than
= 0.05 demand and unit price are not significantly related.
Part c
The coefficient of determination ¿ SSM
SST = 354.689
7389.951=¿0.048
From the value of coefficient of determination (r2) it can be said that 4.8% of the supply
can be predicted from Unit Price.
Part d
The coefficient of correlation (r) = √0.048=0.219.
From the value of coefficient of correlation (r) it is found that the correlation between
unit price and supply is poor.
Part e
From the regression output the supply can be predicted as:
Supply=54.076+ 0.029∗Unit Price
Thus, when unit price = $30,000
Supply=54.076+0.029∗50000=1504.076 ≈1504
Thus, the supply = 1504 thousands
Answer 3
Part a
Anova: Single Factor
SUMMARY
Groups Count Sum Average Variance
Program A 5 725 145 525
Program B 5 675 135 425
Program C 5 950 190 312.5
Program D 5 750 150 637.5
ANOVA
Source of Variation SS df MS F P-value F crit
Between Groups 8750 3 2916.667 6.140 0.006 3.239
Within Groups 7600 16 475
Total 16350 19
Part a
The total sample size = d f Regression+d f Residual +1=1+39+1=41
Part b
From the above calculation it is found that F(1,39) = 1.96622, Sig = 0.16876. Since sig-
value is less than
= 0.05 demand and unit price are not significantly related.
Part c
The coefficient of determination ¿ SSM
SST = 354.689
7389.951=¿0.048
From the value of coefficient of determination (r2) it can be said that 4.8% of the supply
can be predicted from Unit Price.
Part d
The coefficient of correlation (r) = √0.048=0.219.
From the value of coefficient of correlation (r) it is found that the correlation between
unit price and supply is poor.
Part e
From the regression output the supply can be predicted as:
Supply=54.076+ 0.029∗Unit Price
Thus, when unit price = $30,000
Supply=54.076+0.029∗50000=1504.076 ≈1504
Thus, the supply = 1504 thousands
Answer 3
Part a
Anova: Single Factor
SUMMARY
Groups Count Sum Average Variance
Program A 5 725 145 525
Program B 5 675 135 425
Program C 5 950 190 312.5
Program D 5 750 150 637.5
ANOVA
Source of Variation SS df MS F P-value F crit
Between Groups 8750 3 2916.667 6.140 0.006 3.239
Within Groups 7600 16 475
Total 16350 19
Paraphrase This Document
Need a fresh take? Get an instant paraphrase of this document with our AI Paraphraser

4STATISTICS FOR BUSINESS DECISIONS
Part b
From the ANOVA table it is found that F(3,16) = 6.14, p-value = 0.006. Since p-value is
less than
= 0.05, hence there are statistically significant differences between programs.
Answer 4
Part a
The regression output of the model is given as:
Regression Statistics
Multiple R 0.878
R Square 0.771
Adjusted R Square 0.656
Standard Error 1.837
Observations 7
ANOVA
df SS MS F
Significance
F
Regression 2 45.353 22.676 6.717 0.053
Residual 4 13.504 3.376
Total 6 58.857
Coefficients
Standard
Error t Stat P-value
Intercept 3.598 4.052 0.888 0.425
Price 41.320 13.337 3.098 0.036
Advertising 0.013 0.328 0.040 0.970
The regression equation is represented as:
Supply=3.598+41.320∗Price+0.013∗Advertising
Part b
From the regression output F(2,4) = 6.717, sig = 0.053. Since sig (0.053) is less than
=
0.10, hence both Price and Advertising together are significantly related to Sales.
Part c
From the regression output the p-value for Price = 0.036. Since p-value (0.036) is less
than
= 0.10, hence price individually related to sales. In addition, the p-value for Advertising =
0.970.Since p-value (0.970) is more than
= 0.10, hence Advertising individually is
statistically not related to sales.
Part b
From the ANOVA table it is found that F(3,16) = 6.14, p-value = 0.006. Since p-value is
less than
= 0.05, hence there are statistically significant differences between programs.
Answer 4
Part a
The regression output of the model is given as:
Regression Statistics
Multiple R 0.878
R Square 0.771
Adjusted R Square 0.656
Standard Error 1.837
Observations 7
ANOVA
df SS MS F
Significance
F
Regression 2 45.353 22.676 6.717 0.053
Residual 4 13.504 3.376
Total 6 58.857
Coefficients
Standard
Error t Stat P-value
Intercept 3.598 4.052 0.888 0.425
Price 41.320 13.337 3.098 0.036
Advertising 0.013 0.328 0.040 0.970
The regression equation is represented as:
Supply=3.598+41.320∗Price+0.013∗Advertising
Part b
From the regression output F(2,4) = 6.717, sig = 0.053. Since sig (0.053) is less than
=
0.10, hence both Price and Advertising together are significantly related to Sales.
Part c
From the regression output the p-value for Price = 0.036. Since p-value (0.036) is less
than
= 0.10, hence price individually related to sales. In addition, the p-value for Advertising =
0.970.Since p-value (0.970) is more than
= 0.10, hence Advertising individually is
statistically not related to sales.

5STATISTICS FOR BUSINESS DECISIONS
Part d
Based on “part c” above Price is used to predict Sales.
Regression Statistics
Multiple R 0.878
R Square 0.770
Adjusted R Square 0.725
Standard Error 1.644
Observations 7
ANOVA
df SS MS F
Significance
F
Regression 1 45.347 45.347 16.783 0.009
Residual 5 13.510 2.702
Total 6 58.857
Coefficients
Standard
Error t Stat P-value
Intercept 3.582 3.608 0.993 0.366
Price 41.603 10.155 4.097 0.009
The new estimated equation:
Supply=3.582+ 41.603∗Price
Part e
The slope of the regression equation = 41.603.
The slope of the regression equation can be interpreted as with unit increase in Price sales
increases by 41.603 units.
⊘ This is a preview!⊘
Do you want full access?
Subscribe today to unlock all pages.

Trusted by 1+ million students worldwide
1 out of 6