HI6007 Statistics Assignment: Regression and Data Exploration
VerifiedAdded on 2023/04/25
|10
|2104
|278
Homework Assignment
AI Summary
This assignment for HI6007 Statistics focuses on data analysis and regression techniques. It involves analyzing a dataset of 100 students' preparation time and exam marks, including determining variable types, addressing potential survey issues, and creating distribution tables and histograms. The assignment also covers scatter plot analysis to investigate the relationship between variables, calculating a regression equation, and interpreting its coefficients. Furthermore, it includes a numerical summary report with descriptive statistics and correlation analysis. The second part of the assignment involves multiple regression analysis to determine the relationship between sons' height and their parents' heights, interpreting regression coefficients, and testing the overall utility of the model.

HOLMES INSTITUTE
FACULTY OF HIGHER EDUCATION
HI6007 Group Assignment
Due End of Week/Lecture 10
WORTH 30%
(Maximum 5 students in the group)
"This is an applied assignment, not a research assignment. You have to show that you
understand the principles and techniques taught in this course. Therefore, you are
expected to show all your workings, and all problems must be completed in the format
taught in class, the lecture notes or prescribed text book. Any problems not done in the
prescribed format will not be marked, regardless of the ultimate correctness of the
answer."
Instructions:
Your assignment must be submitted in WORD format only!
When answering questions, wherever required, you should copy/cut and paste the
Excel output (e.g., plots, regression output etc) to show your working/output.
Submit your assignment through Safe-Assign in the course website, under the
Assignments and due dates, Assignment Final Submission before the due date.
You are required to keep an electronic copy of your submitted assignment to re-submit,
in case the original submission is failed and/or you are asked to resubmit.
Please check your Holmes email prior to reporting your assignment mark regularly for
possible communications due to failure in your submission.
Important Notice:
All assignments submitted undergo plagiarism checking; if found to have cheated, all
involving submissions would receive a mark of zero for this assessment item.
Paraphrase This Document
Need a fresh take? Get an instant paraphrase of this document with our AI Paraphraser
Please read below information carefully and respond all questions listed.
1. Many Holmes Institute instructors believe that students need to spend at least 2 hours
studying outside of class for every hour of lecture. They believe that the number of hours’
students study to prepare for the exam affect students’ marks significantly. As opposed,
few of the lecturers believe that the number of preparation hours do not essentially affect
students’ marks while some other factors are to be considered. To study the relationship
between the preparation time spent by each student (in hours) for the exam and the
reported mark, a sample of 100 students were selected randomly from a large statistics
class. The data are stored in the file named “ASSIGNMENTDATA” in the course website.
Answer below 9 questions:
a. What type of survey method could be used? Explain your answer.
A cross-sectional survey would be efficient since the research involves collection of data which are
obtained at a specific time for a sample population.
b. What sampling method could be used to select the sample? Explain your answer.
Probability sampling:
Use of Probability sampling would ensure that every member of the population (students in
Holmes Institute) have got an equal probability of inclusion in the sample and hence remove
biasness and increase accuracy of the research results.
c. On the basis of given data, determine the dependent and independent variables
we should use, and why? Also, identify the data type(s) for each variable.
The independent variable is preparation time since it is the variable hypothesized to influence the
students’ marks. As such, marks variable is the dependent variable since it is the variable that will
be affected hypothetically given change in preparation time.
d. What kind of issues we may face in collecting the data using this type of survey
method? List and explain two cases.
Non-response
Some of the respondents may choose to not respond to some of the survey questions which may
lead to the issue of missing data consequently affecting the data analysis results.
Page 2

Instrumentation problem
During preparation of questionnaires there might arise the problem of instrumentation where the
survey questions might not be exactly relevant in collection of the desired information, for
instance given the fact that students take more than one exam in the Institution, time taken for
preparation for the exams might differ hence use of a single exam’s time of preparation might not
be the right instrument for data collection.
e. Using 8 classes and intervals of 20 - 30, 30 - 40, etc. for both of the variables
selected in question 3, develop a distribution table including class intervals,
frequency, relative frequency and cumulative relative frequency for each variable.
Then, draw frequency histogram, relative frequency histogram and cumulative
relative frequency histogram for each variable. Also, Comment on the shape of
frequency histogram for each variable and provide reason(s) for your comment.
Preparation time
20-29 30-39 40-49 50-59 60-69 70-79 80-89 90-100
0
5
10
15
20
25
Frequency
Total
Figure 1: Frequency of preparation time
Page 3
⊘ This is a preview!⊘
Do you want full access?
Subscribe today to unlock all pages.
Trusted by 1+ million students worldwide

Relative Frequency
0
0.05
0.1
0.15
0.2
0.25
Figure 2: Relative Frequency of preparation time
Cumulative frequency
0
20
40
60
80
100
120
Figure 3: Cumulative Frequency of preparation time
Marks
20-29 30-39 40-49 50-59 60-69 70-79 80-89 90-100
0
5
10
15
20
25
Frequency
Total
Figure 4: Frequency of marks
Page 4
0
0.05
0.1
0.15
0.2
0.25
Figure 2: Relative Frequency of preparation time
Cumulative frequency
0
20
40
60
80
100
120
Figure 3: Cumulative Frequency of preparation time
Marks
20-29 30-39 40-49 50-59 60-69 70-79 80-89 90-100
0
5
10
15
20
25
Frequency
Total
Figure 4: Frequency of marks
Page 4
Paraphrase This Document
Need a fresh take? Get an instant paraphrase of this document with our AI Paraphraser
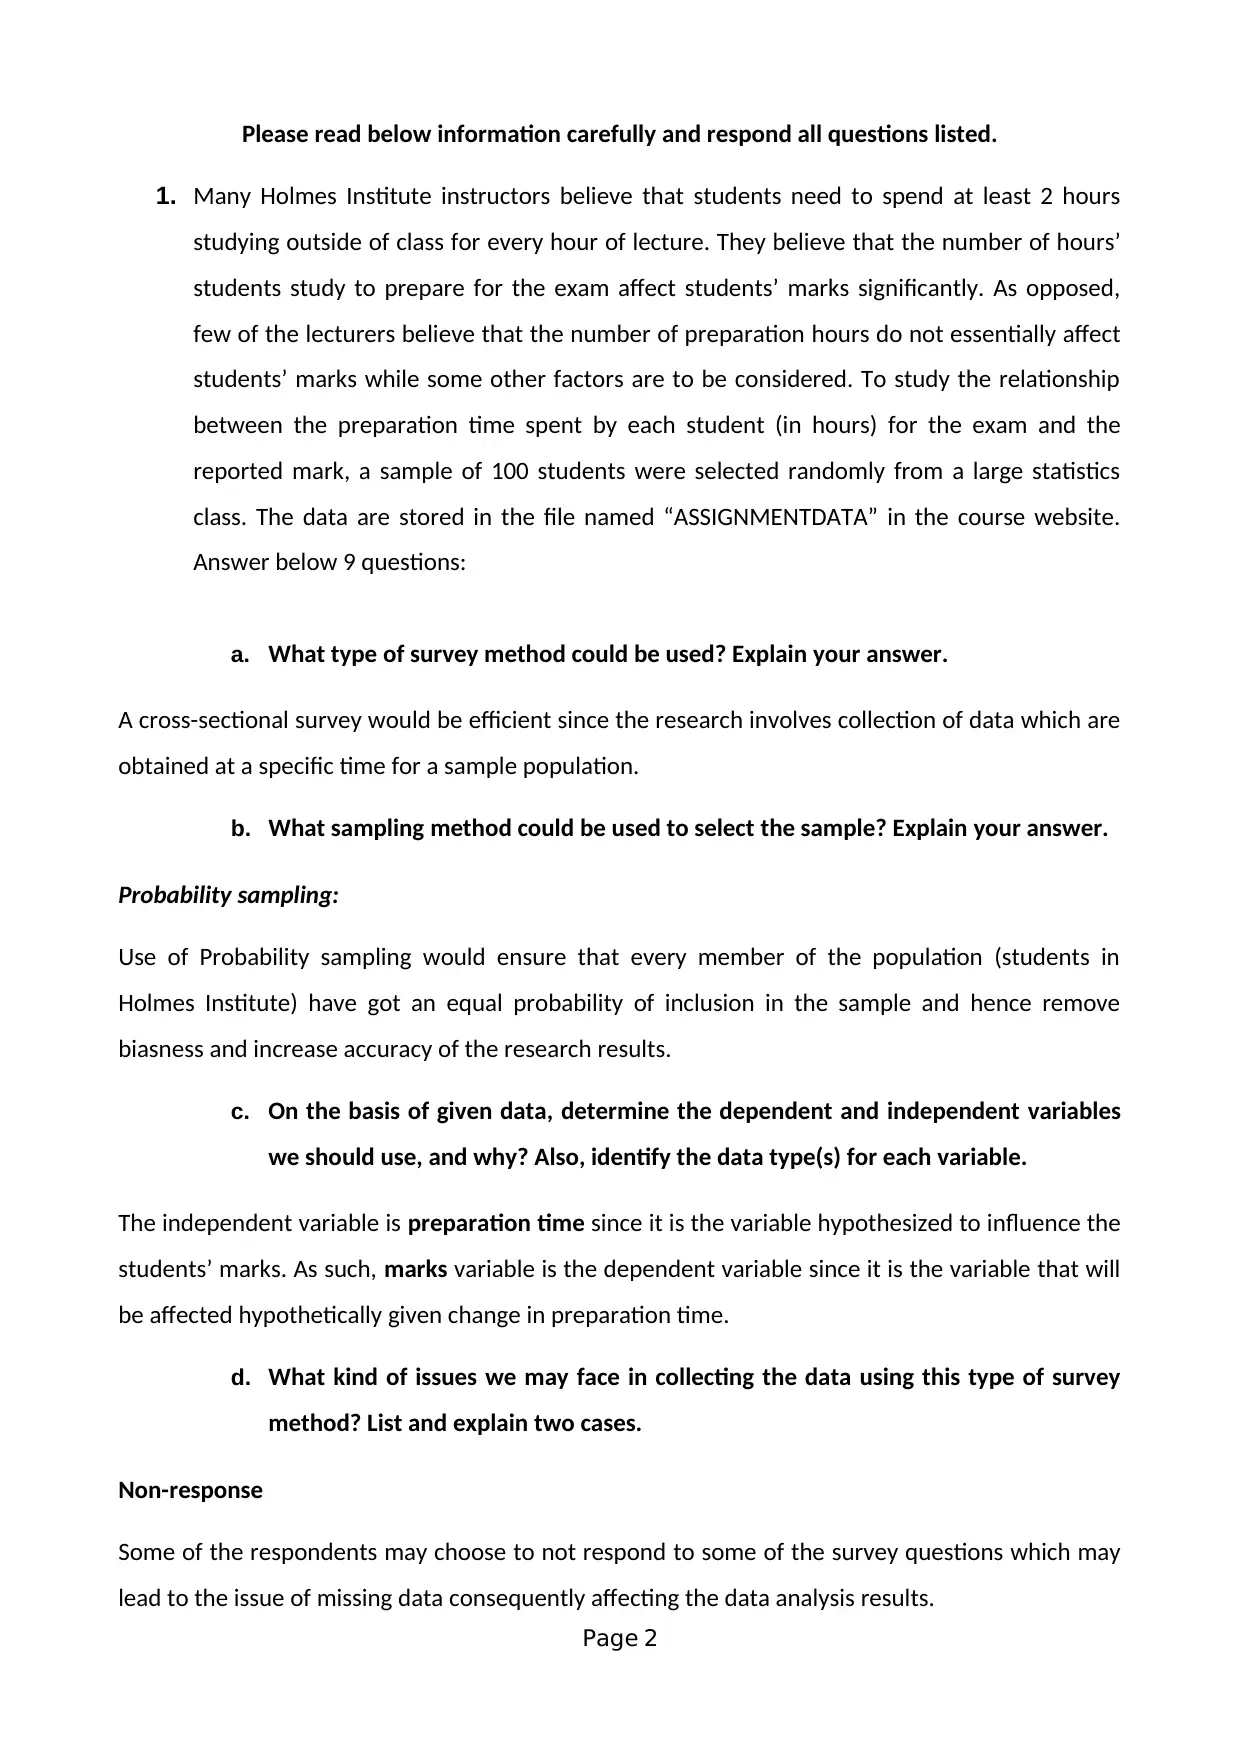
Relative frequency
0
0.05
0.1
0.15
0.2
0.25
Figure 5: Relative Frequency of marks
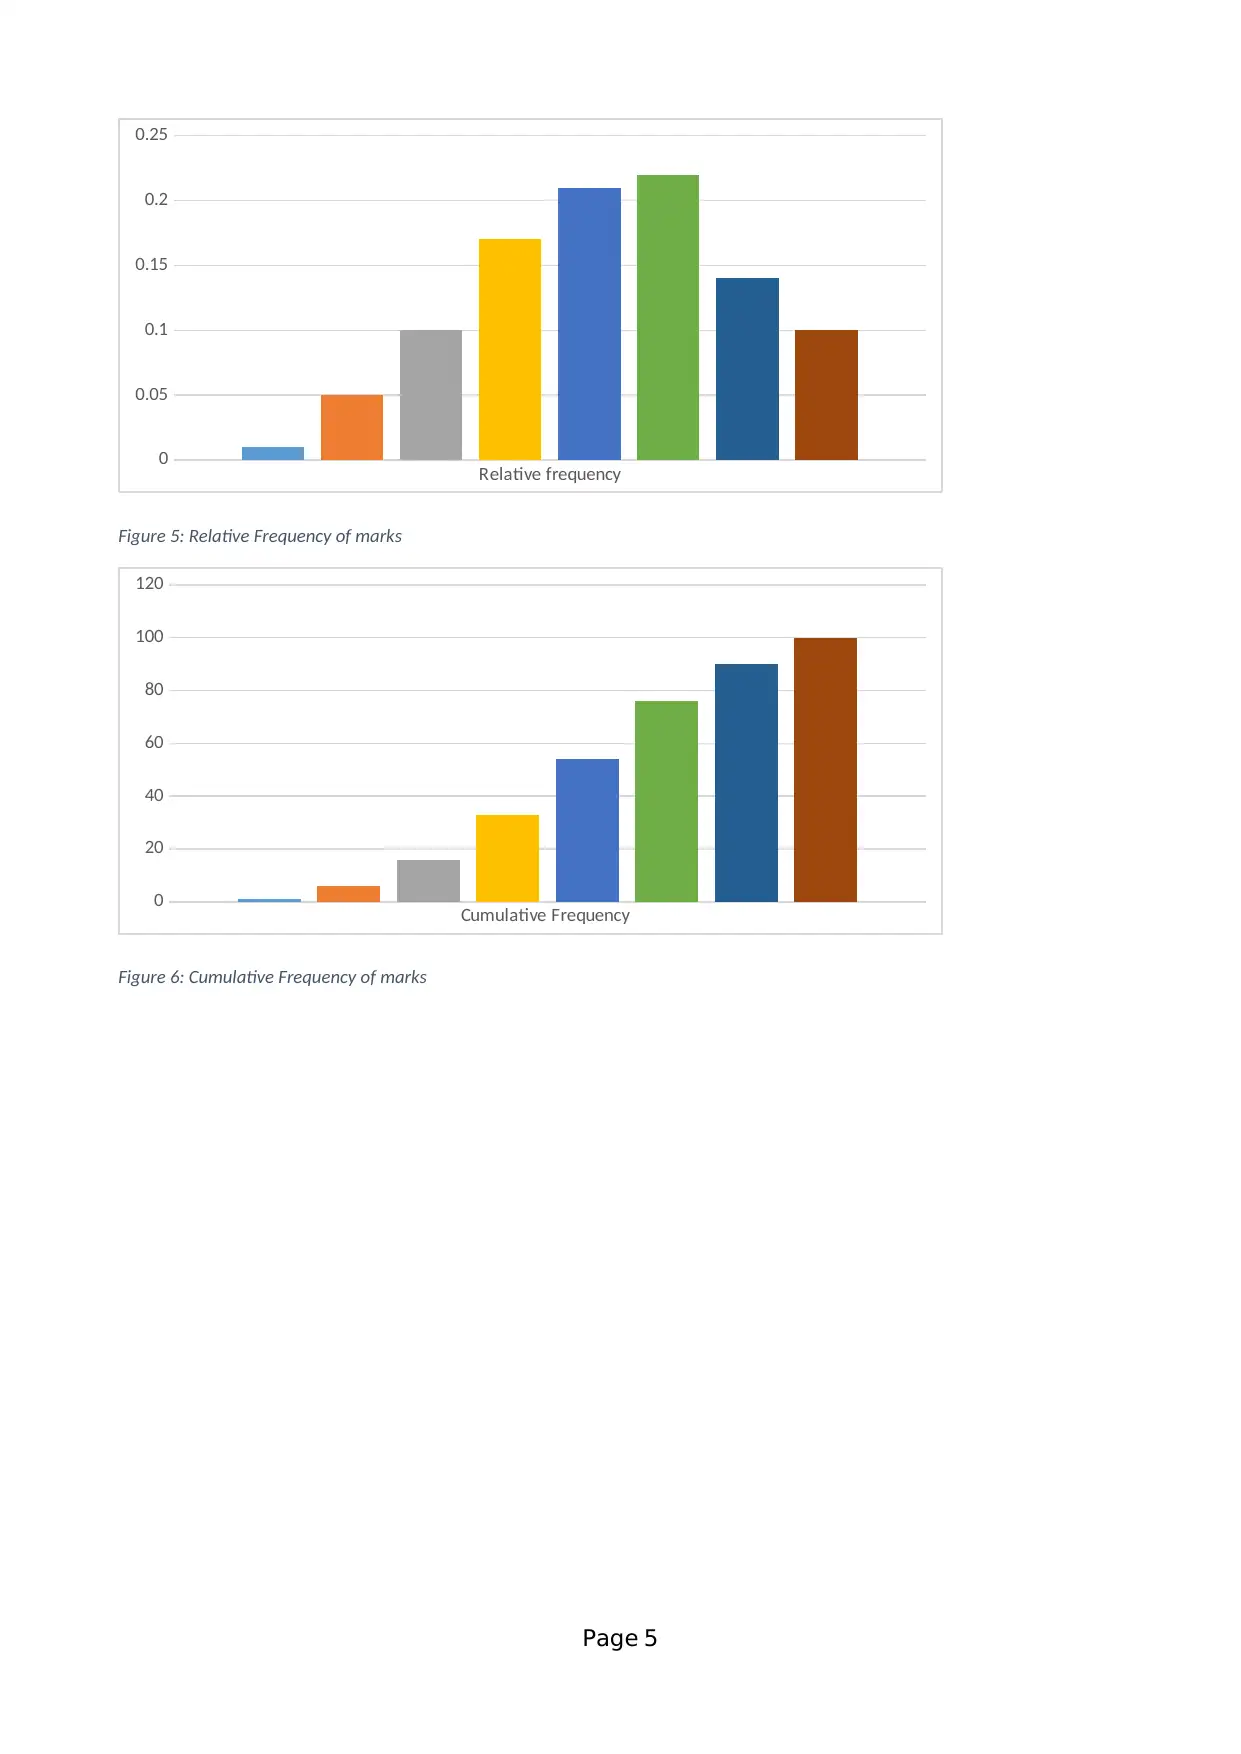
Cumulative Frequency
0
20
40
60
80
100
120
Figure 6: Cumulative Frequency of marks
Page 5
0
0.05
0.1
0.15
0.2
0.25
Figure 5: Relative Frequency of marks
Cumulative Frequency
0
20
40
60
80
100
120
Figure 6: Cumulative Frequency of marks
Page 5

f. Draw and use an appropriate scatter plot to investigate the relationship between
the two variables. Also, briefly explain the selection of each variable on the X and
Y axes and the reason? Finally, draw the fitting line for the plotted observations.
20 30 40 50 60 70 80 90 100
0
20
40
60
80
100
120
Scatterplot for relationship between marks and
preparation time
Preparation time
Marks
Figure 7: Scatterplot without line of fit
The X-axis variable is the preparation time while the Y-axis variable is the marks
given the fact that, marks is the dependent variable whereas preparation time is
the predictor variable therefore it is imperative to use the dependent variable at
the y-axis in order to investigate the changes given the preparation time in the x-
axis.
20 30 40 50 60 70 80 90 100
0
20
40
60
80
100
120
f(x) = 0.583053973782169 x + 28.9842774927721
R² = 0.298723931997605
Scatterplot for relationship between marks and
preparation time
Preparation time
Marks
Figure 8: Scatterplot with regression line
Page 6
⊘ This is a preview!⊘
Do you want full access?
Subscribe today to unlock all pages.
Trusted by 1+ million students worldwide

g. Present the equation of the estimated fitting line (regression) in your answer to
Question f. Then, estimate the effect of an increase in the independent variable
by one unit on the dependent variable. (2.5
marks)
From the scatterplot in figure 8, the regression equation takes the form: y = 0.5831x + 28.984
Where Y is the marks and x is the preparation time. Given the regression equation, an increase in
the preparation time by one unit leads to a change in marks by 29.5671 units
h. Prepare a numerical summary report about the data on the two variables by
including the mean, median, range, variance, standard deviation, smallest and
largest values, quartiles, interquartile range and the 30th percentile for each
variable.
(3.5 marks)
Preparation time
PREPARATION TIME
Mean 63.04
Standard Error 1.63206
Median 64
Mode 64
Standard Deviation 16.3206
Sample Variance 266.362
Kurtosis -0.883705
Skewness -0.019386
Range 65
Minimum 25
Maximum 90
Sum 6304
First quartile 51
Third Quartile 76.25
54
Largest(1) 90
Smallest(1) 25
30th percentile
Table 1: Summary Report for Preparation time
Marks
Page 7
Paraphrase This Document
Need a fresh take? Get an instant paraphrase of this document with our AI Paraphraser

MARKS
Mean 65.74
Standard Error 1.741045
Median 68
Mode 70
Standard Deviation 17.41045
Sample Variance 303.1236
Kurtosis -0.345095
Skewness -0.121785
Range 75
First Quartile 54
Third Quartile 78
58
Minimum 25
Maximum 100
Largest(1) 100
Smallest(1) 25
30th percentile
Table 2: Summary Report for Marks
i. Compute a numerical measurement which measures the strength and direction of
the linear relationship between the two variables. Also, interpret this value.
PREPARATION TIME MARK
PREPARATION TIME 1
MARK 0.546556430753134 1
Table 3: Strength and Direction of linear relationship
From table 3, the correlation coefficient which measures the strength and direction of the linear
relationship is 0.546556 indicating there is an average positive linear relationship between the response
and predictor variables.
2. To determine whether or not the height of sons is related to father’s height (x1) and
mother’s height (x2), data were gathered and part of the multiple regression excel
output is shown below. Fill the table and answer the following questions.
SUMMARY OUTPUT
Regression Statistics
Multiple R 0.5169
R Square 0.2672
Page 8

Adjusted R Square 0.2635
Standard Error 8.0683
Observations 400
ANOVA
df SS MS F Significance F
Regression 2 9421.58 4710.79 72.3657 0.0000
Residual 397 25843.41 65.097
Total 399 35264.98
Coefficients Standard Error t Stat P-value
Intercept 93.8993 8.0072 11.7269 0.0000
X1 0.4849 0.0412 11.7772 0.0000
X2 -0.0229 0.0395 -0.5811 0.5615
a. What is the standard error of estimate? What does this statistic tell you?
The standard error of the estimate is 8.0683 which is relatively large implying that the predicted values of
the dependent variable are comparatively scattered far above and below the regression line.
b. What is the coefficient of determination? What does this statistic tell you?
The coefficient of determination is 0.2672 implying that 26.72% of the variance in son’s height is
predictable from X1 and X2.
c. What is the adjusted coefficient of determination for degree of freedom? What do this
statistic and the one referred to in part (b) tell you about how well the model fits the
data?
The adjusted coefficient of determination is 0.2635 which is less than 0.5 and closer to 0 than it is closer
than 1.
The low coefficient of determination and low adjusted coefficient of determination indicates that the
regression model is not a good fit.
d. Test the overall utility of the model. What does the test result tell you?
The F-statistic of the regression model for the test of the relationship of a son’s height and
that of the mother and father is 72.3657 with a p-value of 0.000 which is less than 0.05 at a 95%
confidence interval indicating that the model is significant in testing the relationship between the
independent and dependent variable.
Page 9
⊘ This is a preview!⊘
Do you want full access?
Subscribe today to unlock all pages.
Trusted by 1+ million students worldwide

e. Interpret each of the coefficients.
From the ANOVA table, the regression model is:
Son’s height=β0 +β1X1+ β2X2
Son’s height=93.8993 + 0.4849X1 -0.0229X2
The regression equation indicates that for every increase in father’s height by 1 unit, the son’s height
changes by 94.3842 while an increase of the mother’s height by 1 unit leads to change in son’s height by
93.8764. Therefore, there is a negative relationship between the mother’s height and the son’s height while
there is a positive relationship between the son’s height and that of the father.
f. Do these data allow the statistic practitioner to infer that the heights of the sons
and the fathers are linearly related?
From the ANOVA table, X1 variable has a p-value of 0.0000 which is less than 0.05 at 95% confidence
interval indicating that father’s height (X1) is significant in predicting son’s height
g. Do these data allow the statistic practitioner to infer that the heights of the sons
and the mothers are linearly related?
From the ANOVA table, X2 variable has a p-value of 0.5615 which is greater than 0.05 at 95% confidence
interval hence we reject the null hypothesis that a mother’s height is linearly related to a son’s height
hence conclude that mother’s height (X1) is not significant in predicting son’s height therefore the statistic
practitioner cannot infer that the heights of the sons and the mothers are linearly related.
END OF THE ASSIGNMENT
Page 10
1 out of 10
Related Documents


Your All-in-One AI-Powered Toolkit for Academic Success.
+13062052269
info@desklib.com
Available 24*7 on WhatsApp / Email
![[object Object]](/_next/static/media/star-bottom.7253800d.svg)
Unlock your academic potential
Copyright © 2020–2026 A2Z Services. All Rights Reserved. Developed and managed by ZUCOL.