HI6007 Data Analysis Assignment: Statistical Modeling and Results
VerifiedAdded on 2023/06/11
|4
|550
|85
Homework Assignment
AI Summary
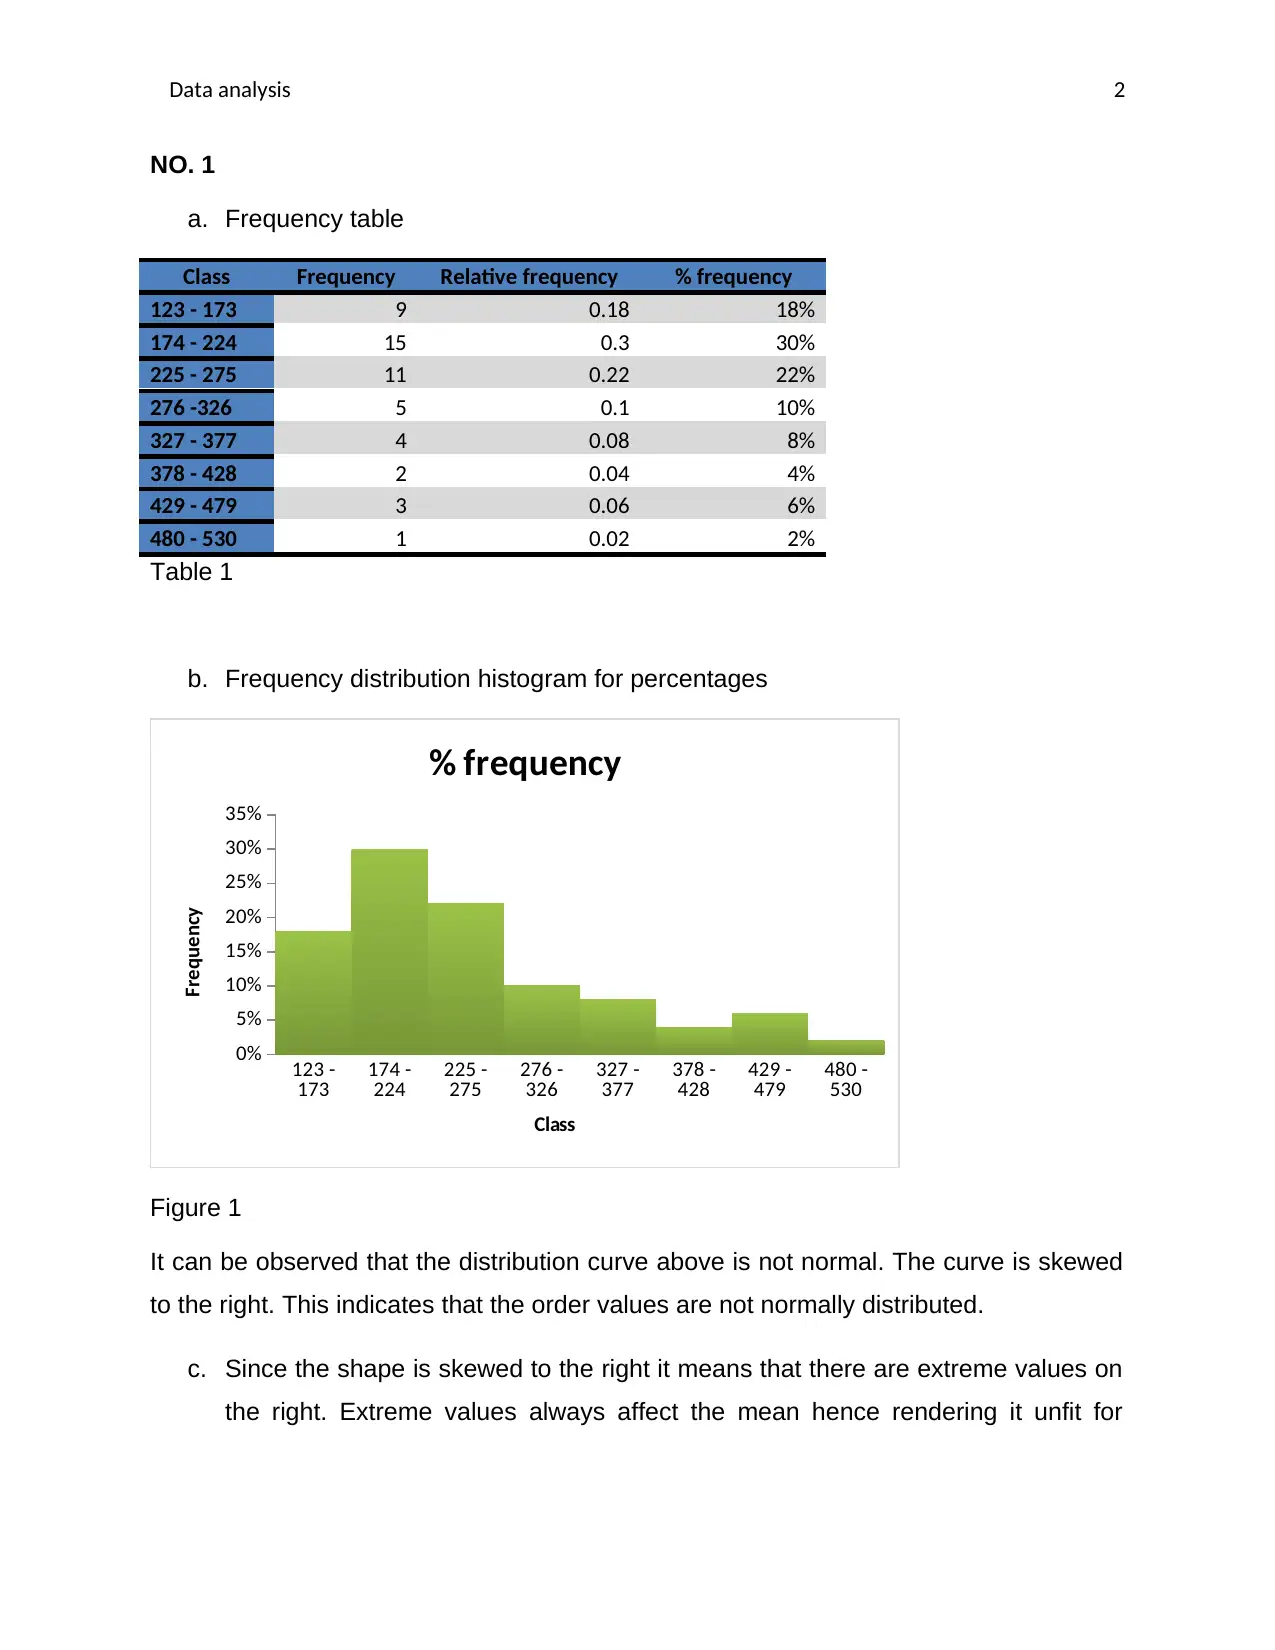
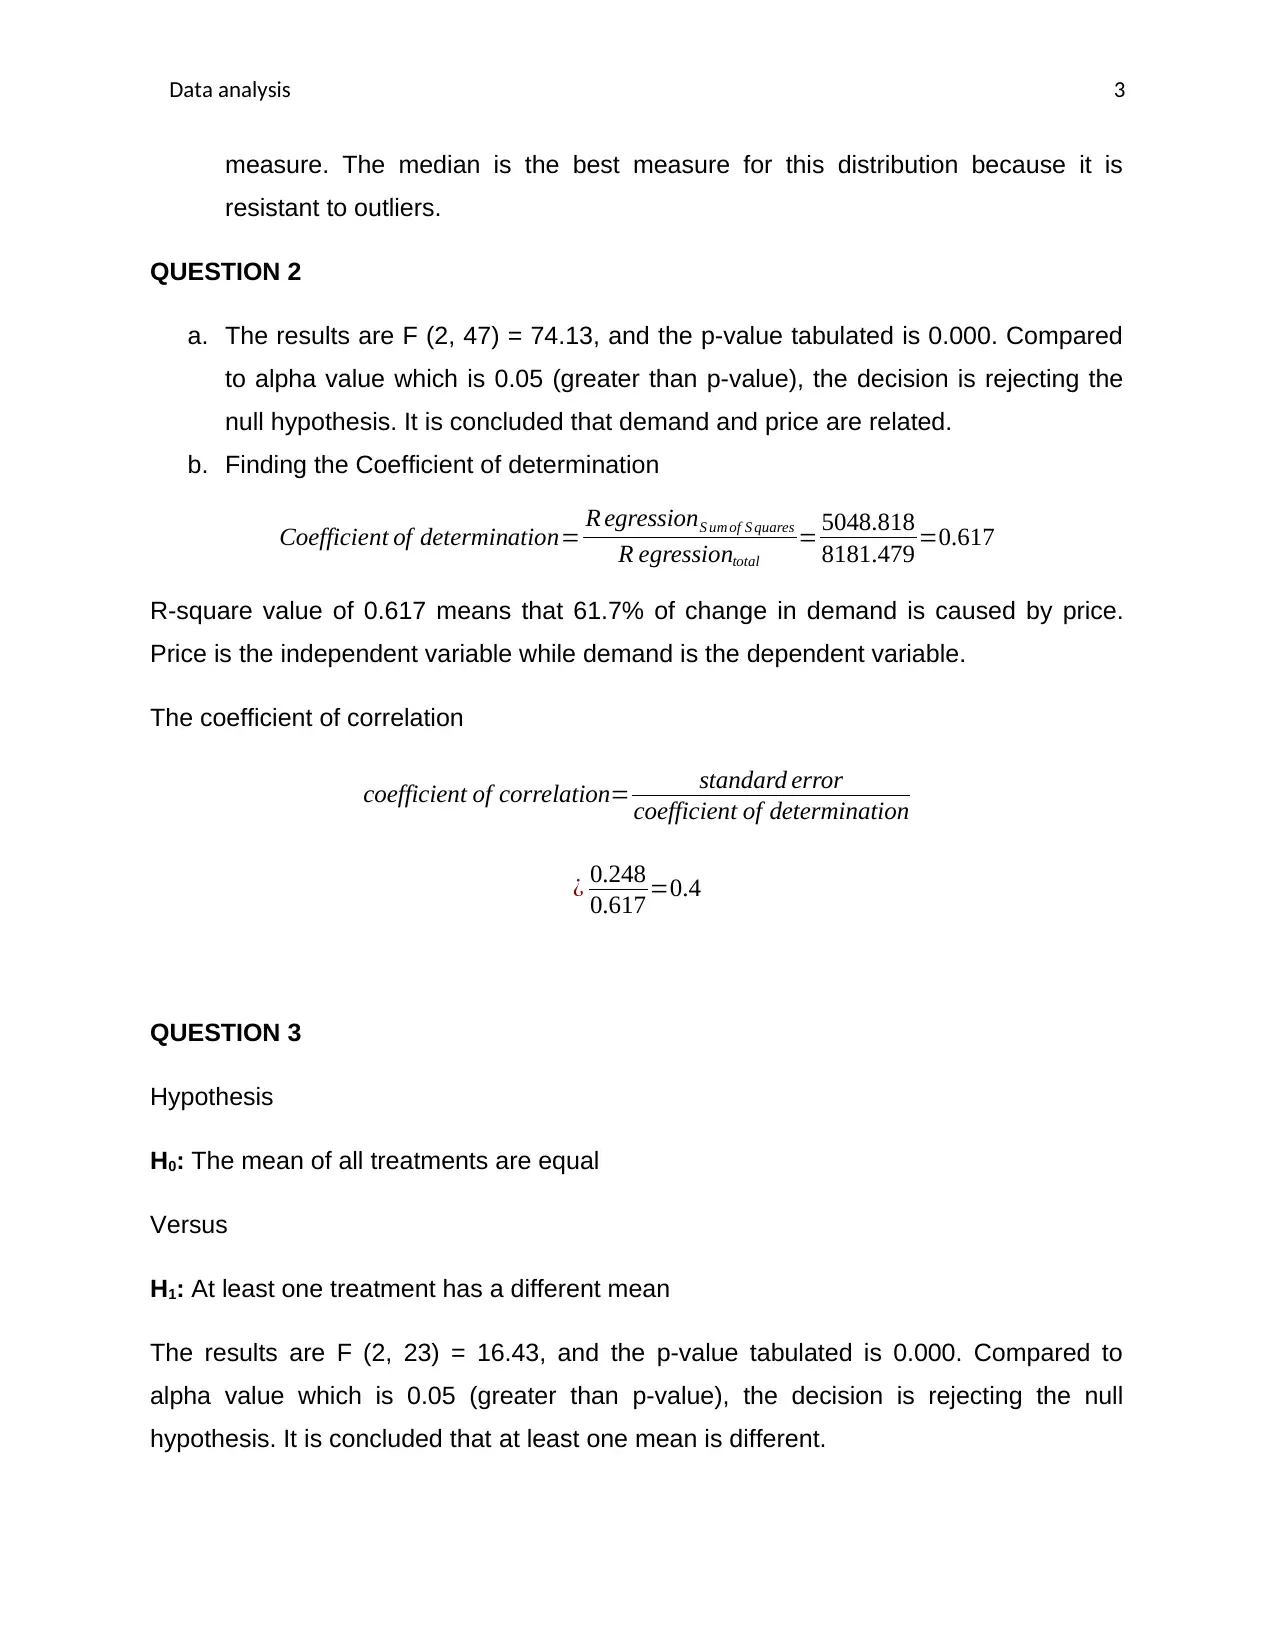
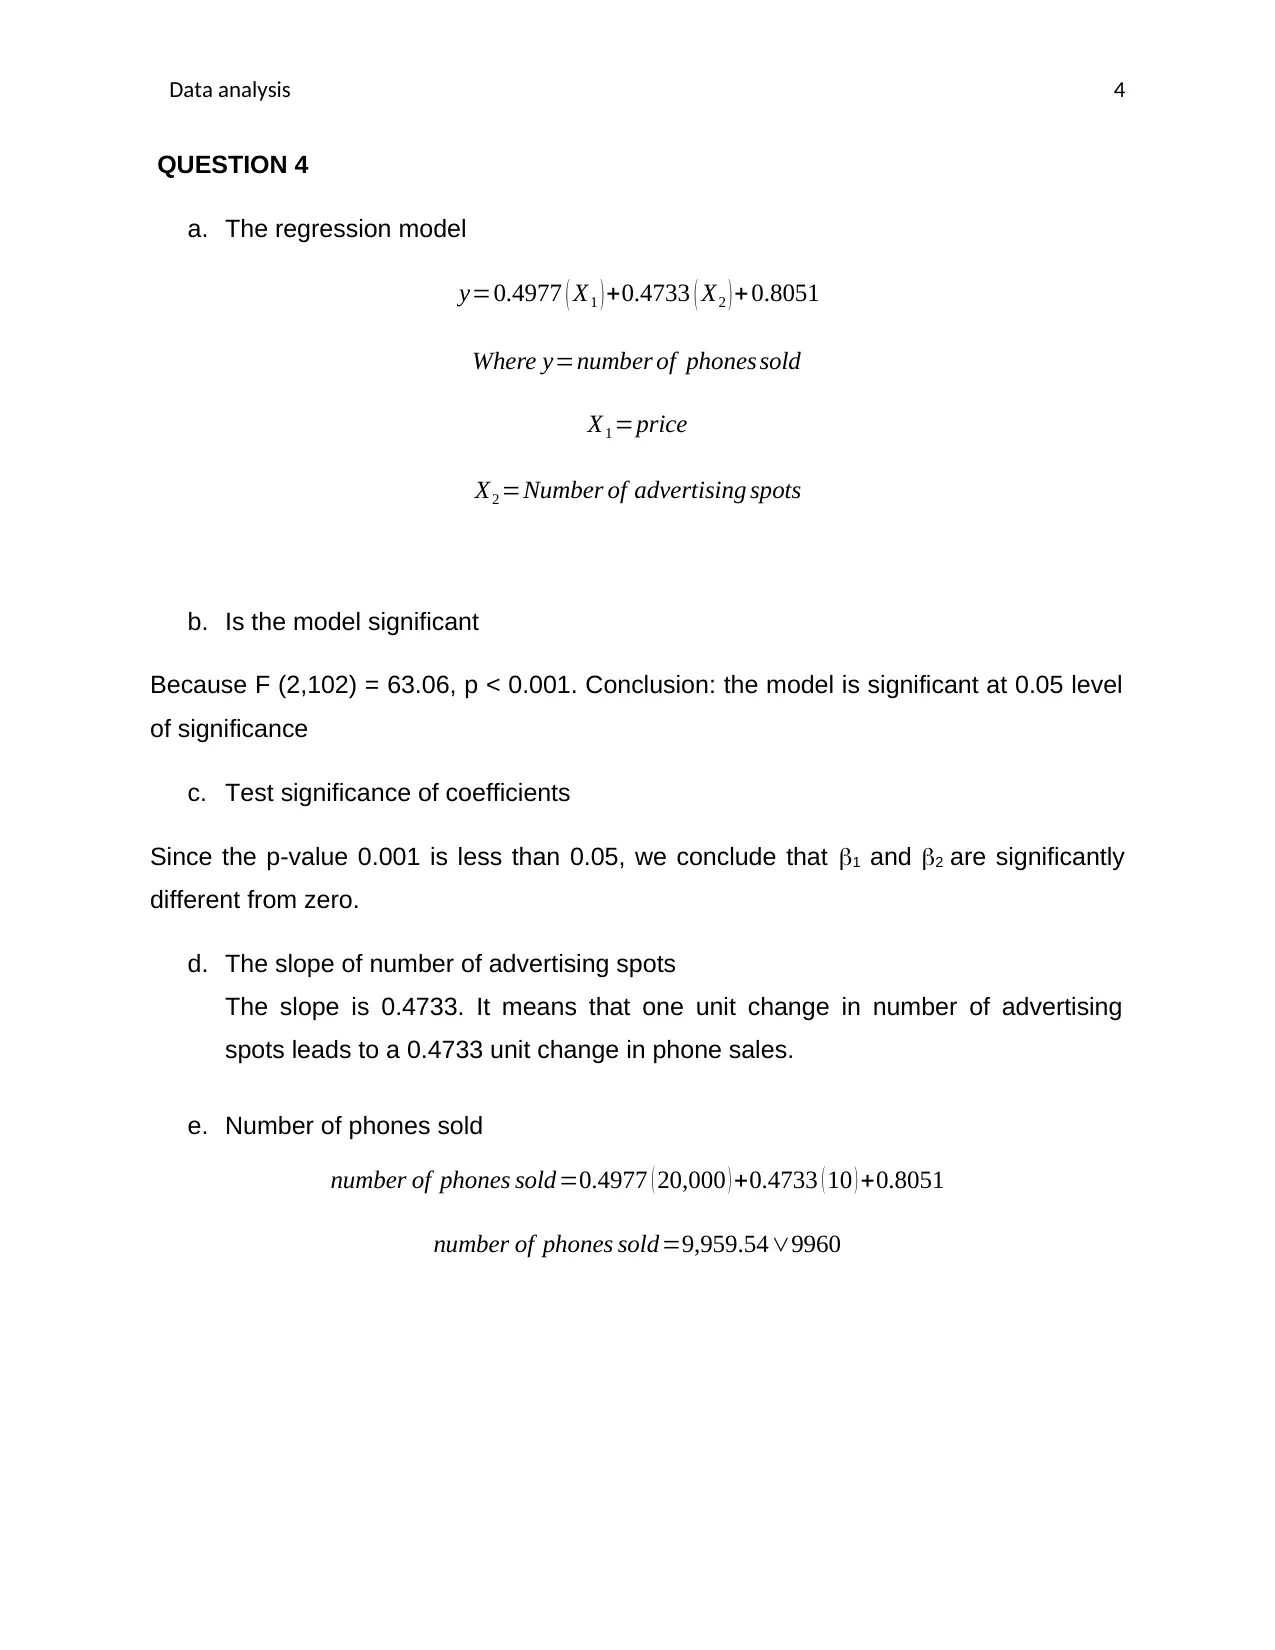
This assignment solution covers various aspects of data analysis, including frequency distribution, histogram interpretation, and hypothesis testing. It begins by constructing a frequency table and histogram to analyze the distribution of furniture order values, determining that the distribution is skewed to the right and that the median is the best measure of central tendency. The solution then addresses hypothesis testing using ANOVA, interpreting p-values to determine the significance of relationships between variables like price and demand. Furthermore, it includes a regression model to predict phone sales based on price and advertising spots, assessing the model's significance and interpreting the coefficients. The document concludes with a calculation of predicted phone sales based on given values for price and advertising spots. Desklib offers a platform to explore similar assignments and study tools.

1 out of 4
Related Documents


Your All-in-One AI-Powered Toolkit for Academic Success.
+13062052269
info@desklib.com
Available 24*7 on WhatsApp / Email
![[object Object]](/_next/static/media/star-bottom.7253800d.svg)
Copyright © 2020–2026 A2Z Services. All Rights Reserved. Developed and managed by ZUCOL.