HI6007 Group Assignment: Statistical Analysis and Interpretation

Verified

Added on  2021/06/15

|6
|758
|136
Homework Assignment
AI Summary
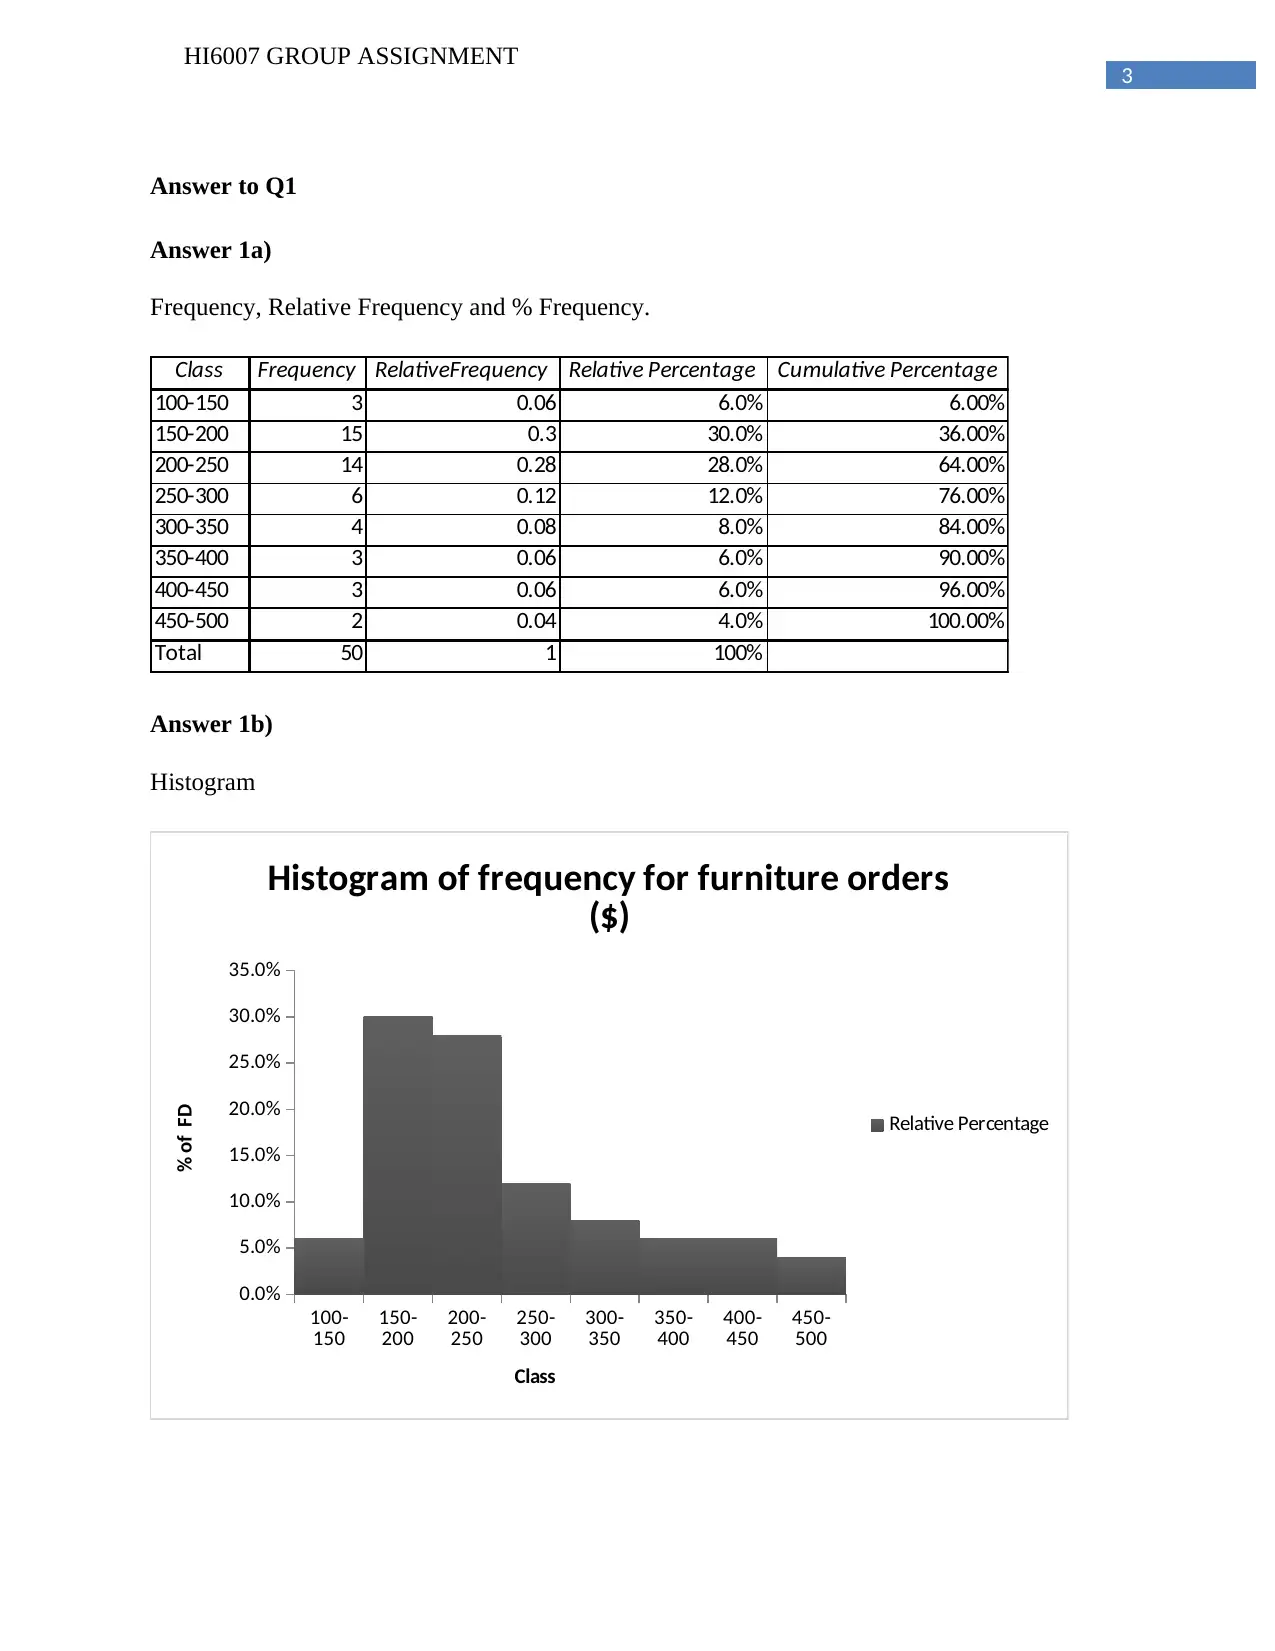
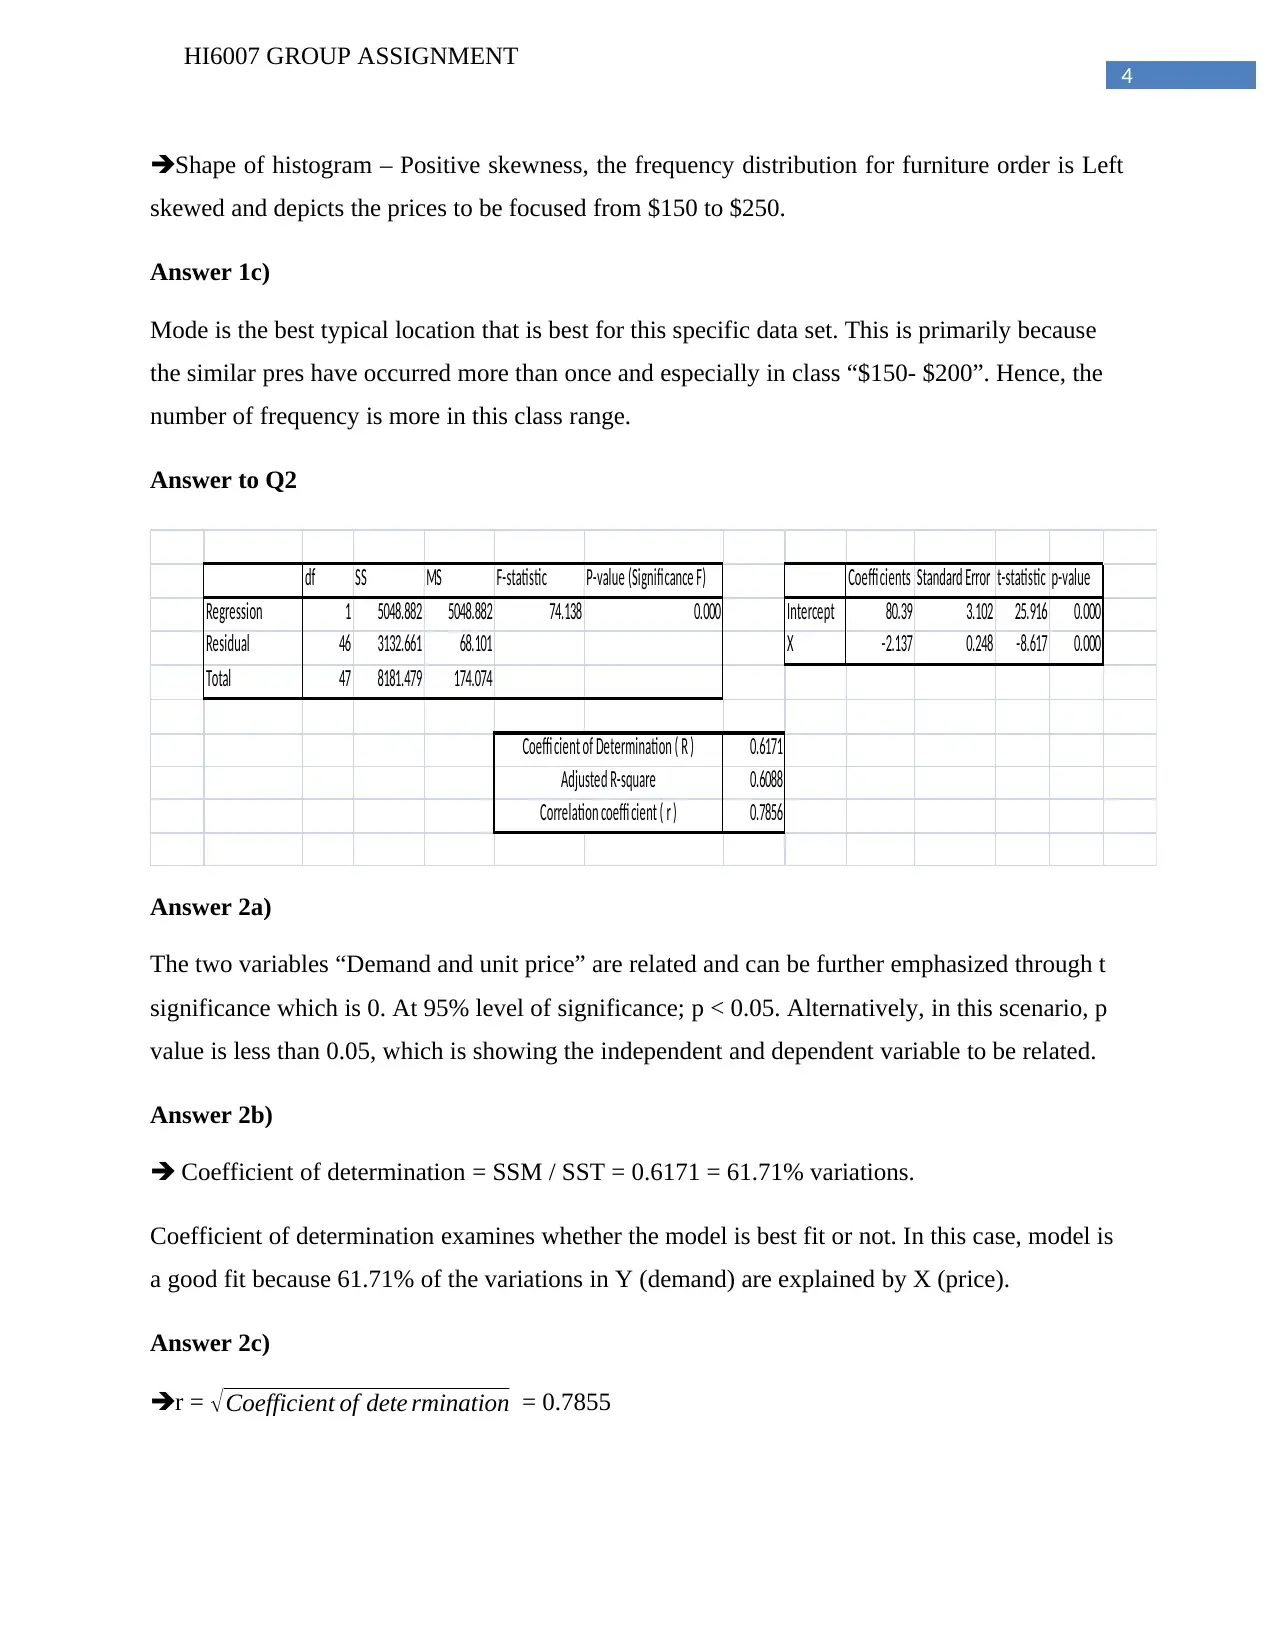
This document presents a comprehensive solution to a group assignment for the HI6007 course, focusing on statistical analysis. The assignment covers various statistical concepts including frequency, relative frequency, histograms, and measures of central tendency like mode. It delves into regression analysis, examining the relationship between variables such as demand and unit price, calculating coefficients of determination and correlation. Hypothesis testing is also a key component, with analyses performed to determine significant differences among population means using ANOVA, and to assess the significance of regression coefficients. The solution provides detailed answers to each question, including interpretations of statistical results and conclusions drawn from the analyses. This assignment demonstrates the application of statistical methods to real-world scenarios, providing a valuable resource for students studying statistics.
tabler-icon-diamond-filled.svg

Contribute Materials

Your contribution can guide someone’s learning journey. Share your documents today.
Document Page
Running head: HI6007 GROUP ASSIGNMENT
HI6007 Group Assignment
Student I:_________________________ Student Id:__________
Student II:_________________________ Student Id:__________
Student III:_________________________ Student Id:__________
Student IV:_________________________ Student Id:__________
Student V:_________________________ Student Id:__________
tabler-icon-diamond-filled.svg

Secure Best Marks with AI Grader

Need help grading? Try our AI Grader for instant feedback on your assignments.
Document Page
2
HI6007 GROUP ASSIGNMENT
Table of Contents
Answer to Q1...................................................................................................................................3
Answer 1a)...................................................................................................................................3
Answer 1b)...................................................................................................................................3
Answer 1c)...................................................................................................................................4
Answer to Q2...................................................................................................................................4
Answer 2a)...................................................................................................................................4
Answer 2b)...................................................................................................................................4
Answer 2c)...................................................................................................................................4
Answer to Q3...................................................................................................................................5
Answer to Q4...................................................................................................................................5
Answer 4a)...................................................................................................................................5
Answer 4b)...................................................................................................................................6
Answer 4c)...................................................................................................................................6
Answer 4d)...................................................................................................................................6
Answer 4e)...................................................................................................................................6
Document Page
3
HI6007 GROUP ASSIGNMENT
Answer to Q1
Answer 1a)
Frequency, Relative Frequency and % Frequency.
Class Frequency RelativeFrequency Relative Percentage Cumulative Percentage
100-150 3 0.06 6.0% 6.00%
150-200 15 0.3 30.0% 36.00%
200-250 14 0.28 28.0% 64.00%
250-300 6 0.12 12.0% 76.00%
300-350 4 0.08 8.0% 84.00%
350-400 3 0.06 6.0% 90.00%
400-450 3 0.06 6.0% 96.00%
450-500 2 0.04 4.0% 100.00%
Total 50 1 100%
Answer 1b)
Histogram
100-
150 150-
200 200-
250 250-
300 300-
350 350-
400 400-
450 450-
500
0.0%
5.0%
10.0%
15.0%
20.0%
25.0%
30.0%
35.0%
Histogram of frequency for furniture orders
($)
Relative Percentage
Class
% of FD
Document Page
4
HI6007 GROUP ASSIGNMENT
Shape of histogram – Positive skewness, the frequency distribution for furniture order is Left
skewed and depicts the prices to be focused from $150 to $250.
Answer 1c)
Mode is the best typical location that is best for this specific data set. This is primarily because
the similar pres have occurred more than once and especially in class “$150- $200”. Hence, the
number of frequency is more in this class range.
Answer to Q2
df SS MS F-statistic P-value (Significance F) Coeffi cients Standard Error t-statistic p-value
Regression 1 5048.882 5048.882 74.138 0.000 Intercept 80.39 3.102 25.916 0.000
Residual 46 3132.661 68.101 X -2.137 0.248 -8.617 0.000
Total 47 8181.479 174.074
0.6171
0.6088
0.7856
Coeffi cient of Determination ( R )
Correlation coeffi cient ( r )
Adjusted R-square
Answer 2a)
The two variables “Demand and unit price” are related and can be further emphasized through t
significance which is 0. At 95% level of significance; p < 0.05. Alternatively, in this scenario, p
value is less than 0.05, which is showing the independent and dependent variable to be related.
Answer 2b)
Coefficient of determination = SSM / SST = 0.6171 = 61.71% variations.
Coefficient of determination examines whether the model is best fit or not. In this case, model is
a good fit because 61.71% of the variations in Y (demand) are explained by X (price).
Answer 2c)
r = Coefficient of dete rmination = 0.7855
tabler-icon-diamond-filled.svg

Secure Best Marks with AI Grader

Need help grading? Try our AI Grader for instant feedback on your assignments.
Document Page
5
HI6007 GROUP ASSIGNMENT
Based on the above result, demand and price are positive correlated and being more than r>0.5, it
is strongly correlated as well. Hence, change in price will affirm the change in demand whether it
is positive or negative.
Answer to Q3
SS df MS F-statistic P-value (Significance F)
Regression 390.580 2 195.290 25.891 0.000
Residual 158.400 21 7.543
Total 548.980 23 23.869
H0: There is no significant difference among the means of the three populations.
H1: There is significant difference among the means of the three populations.
At 95% level of significance; p < 0.05 for F statistics. Alternatively, in this scenario, p value is
less than 0.05, which is showing the independent and dependent variable to be related. In this
case, p value < 0.05 gives statistically valid results. Hence, there is significant difference among
the means of the three populations (α=0.05).
Answer to Q4
df SS MS F-statistic P-value (Significance F) Coeffi cients Standard Error t-statistic p-value
Regression 2 40.700 20.350 80.118 0.001 Intercept 0.805
Residual 4 1.016 0.254 X1 0.498 0.462 1.078 0.322
Total 6 41.716 6.953 X2 0.473 0.039 12.230 0.000
0.9756
0.9635
0.9877
Multiple R-square
Adjusted R-square
Correlation coeffi cient ( r )
Answer 4a)
Y = 0.8501 + 0.4977*X1 + 0.4733* X2
Document Page
6
HI6007 GROUP ASSIGNMENT
Phones sold per day = 0.8501 + 0.4977*Price + 0.4733*Advertising spots
Answer 4b)
At 95% level of significance; p < 0.05 for F statistics. Alternatively, in this scenario, p value =
0.001 which is less than 0.05, which is showing the independent and dependent variable to be
related. In this case, p value < 0.05 gives statistically valid results (α=0.05).
Answer 4c)
H0: β1 and β2 is not significantly different from zero. .
H1: β1 and β2 is significantly different from zero.
At α = 0.05, β1 has p = 0.32246> 0.05, making it not significantly different from zero. Hence,
accepting null hypothesis is case of β1.
Whereas, at α = 0.05, β2 has p = 0.00 < 0.05, making it significantly different from zero. Hence,
rejecting null hypothesis is case of β2
Answer 4d)
The slope coefficient for X2 (β2) = 0.473. Hence, this illustrates that with one unit change in X2,
and then Y would be changed by 0.4733 units. Even though, the relation is directional such as
increase in X2 will lead to positive change in Y/
Answer 4e)
Y = 0.8501 + 0.4977*X1 + 0.4733* X2
Y = 0.8501 + 0.4977*20 + 0.4733*10
Y= 0.8501 + 9.954 + 4.733
Y = 15.5371 16 = Phones sold per day
chevron_up_icon
1 out of 6
circle_padding
hide_on_mobile
zoom_out_icon
logo.png

Your All-in-One AI-Powered Toolkit for Academic Success.

Available 24*7 on WhatsApp / Email

[object Object]