HI6007 Data Analysis: Applying Statistical Methods to Business Data
VerifiedAdded on 2023/06/11
|4
|549
|225
Homework Assignment
AI Summary
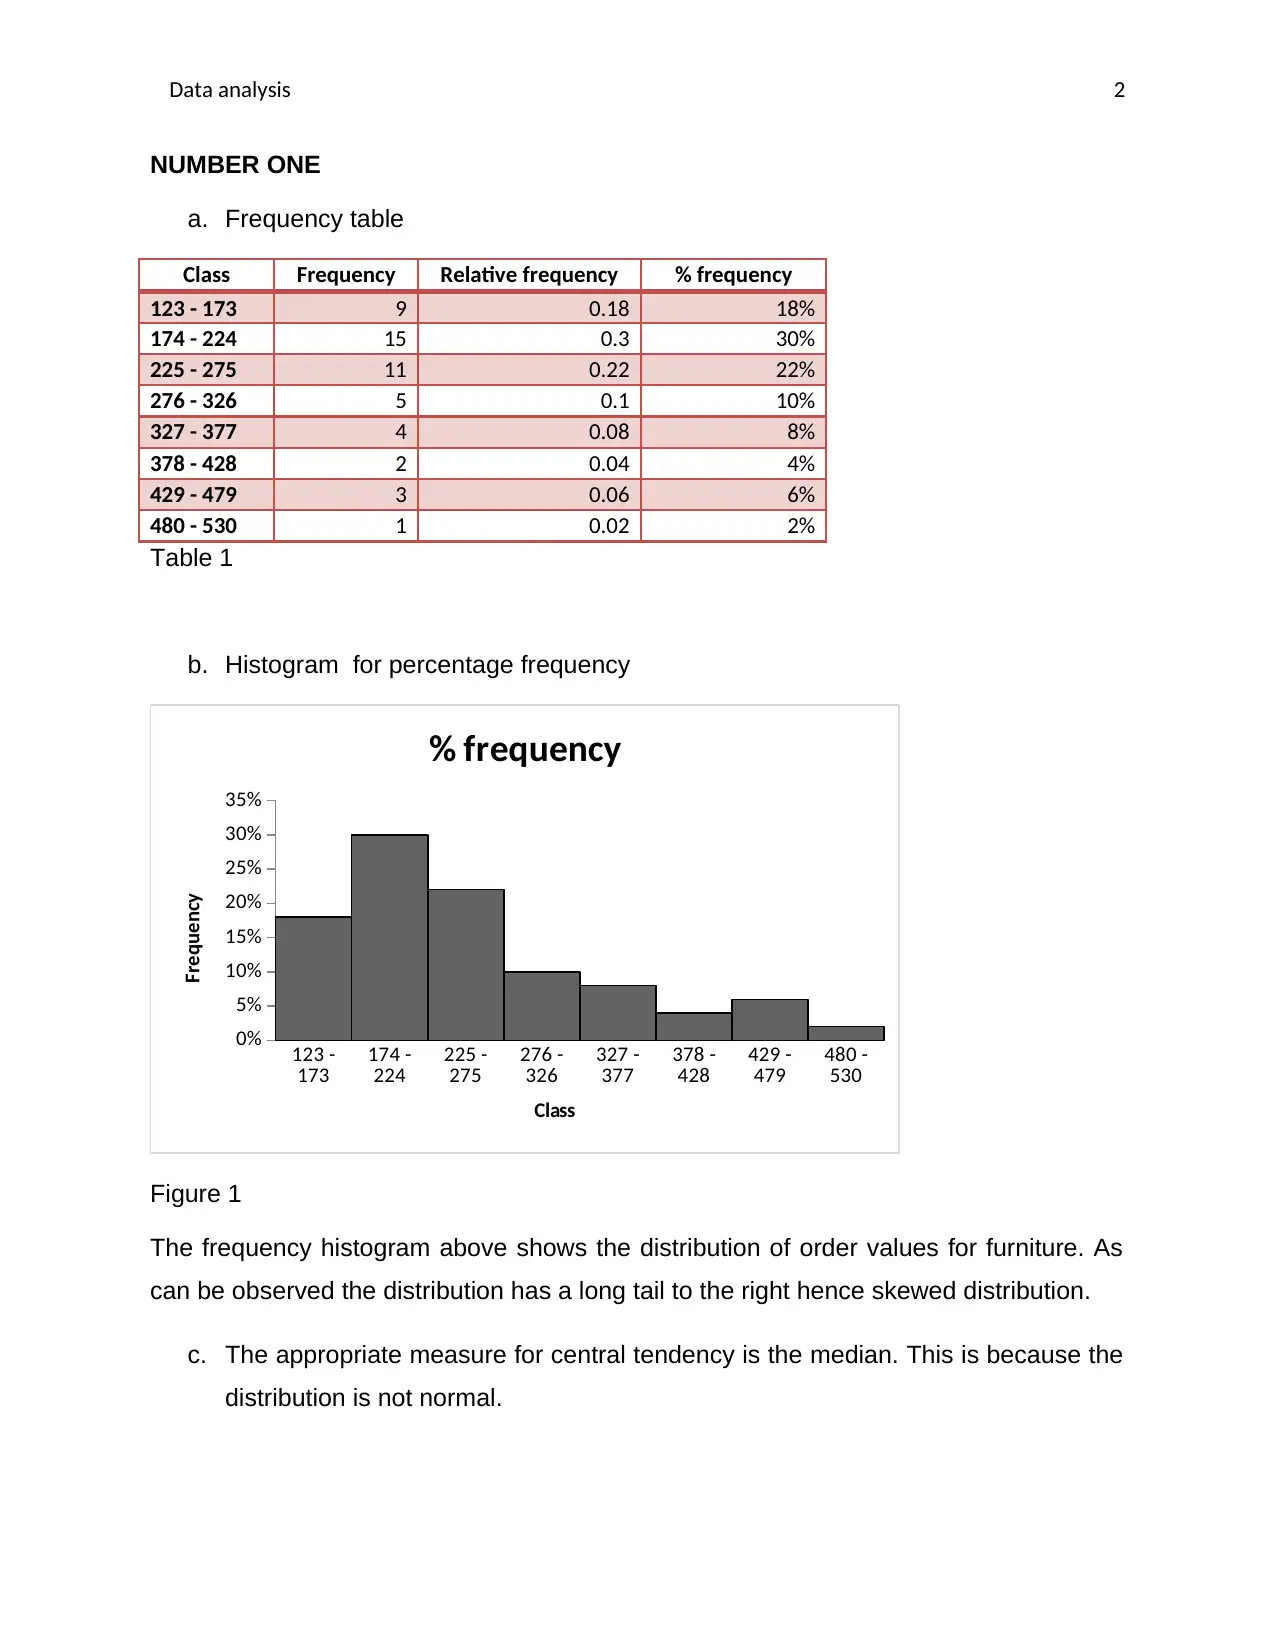
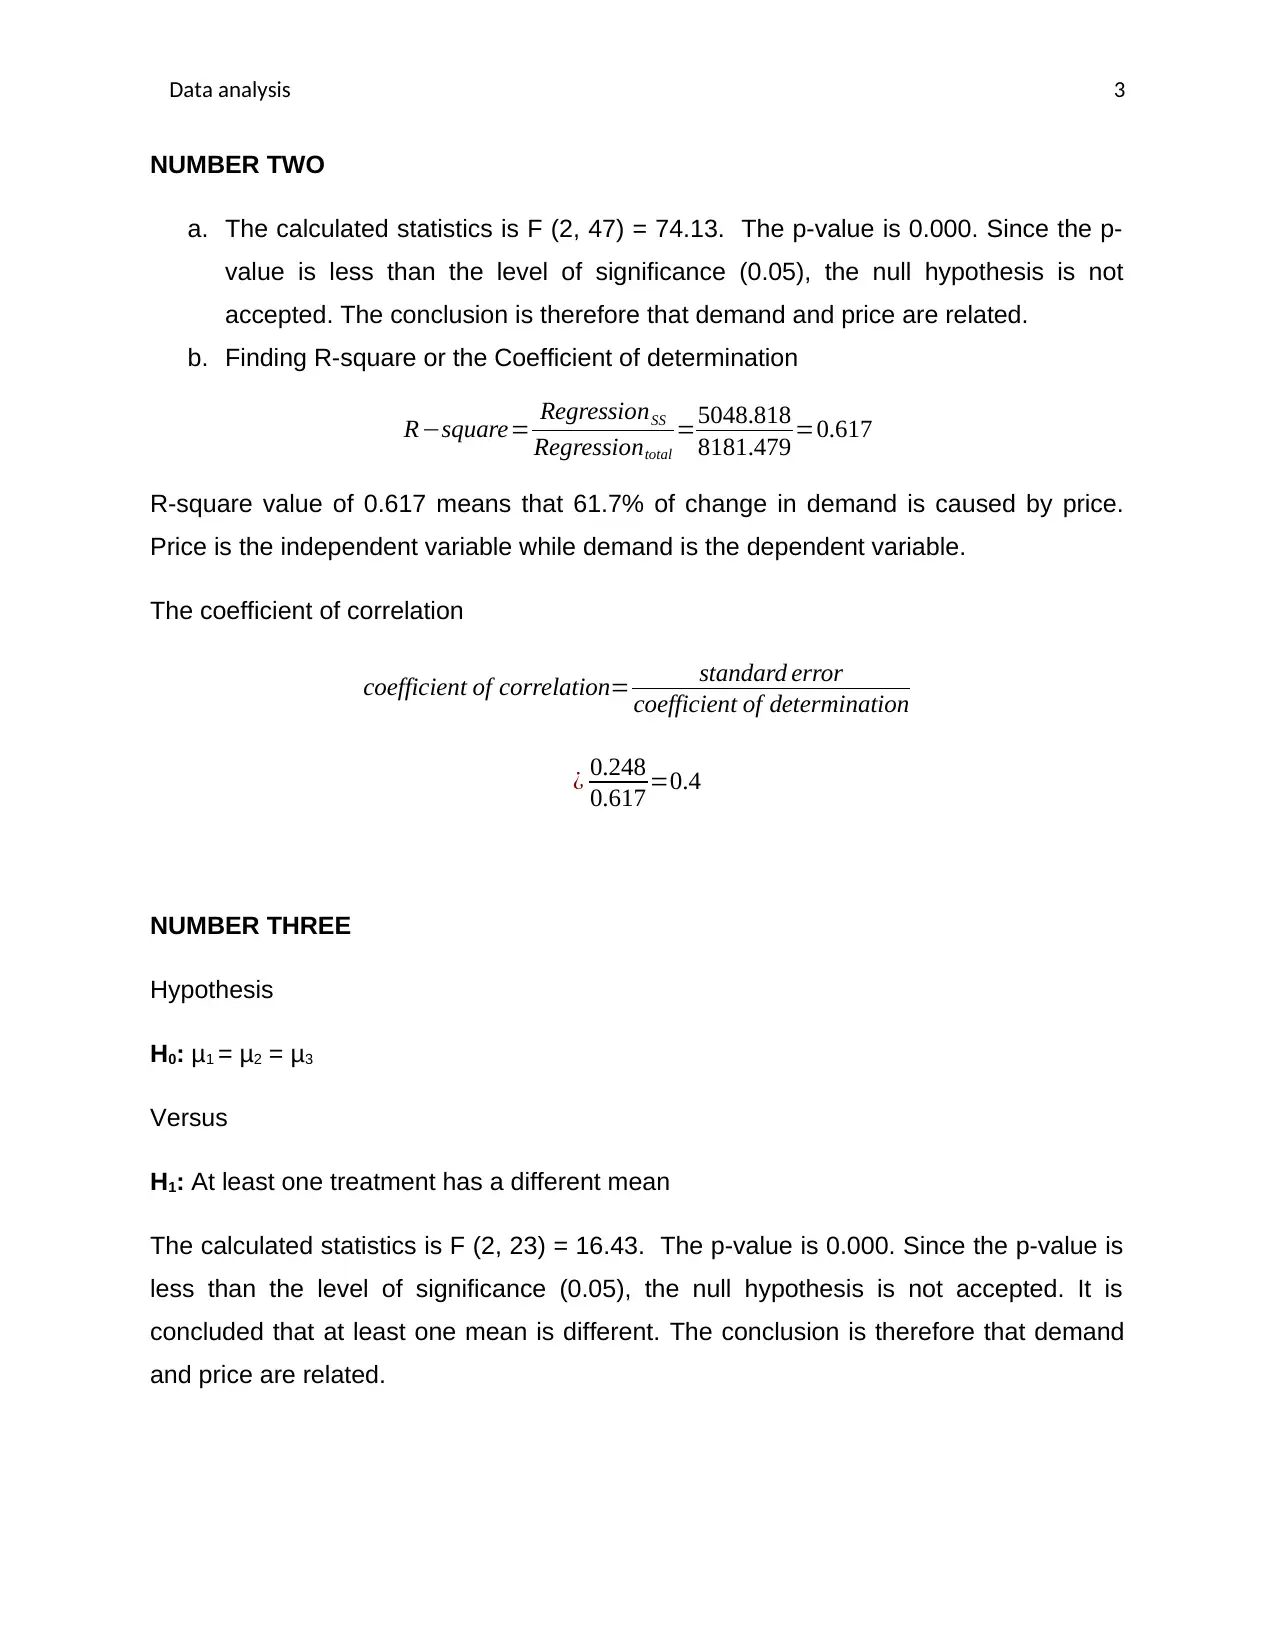
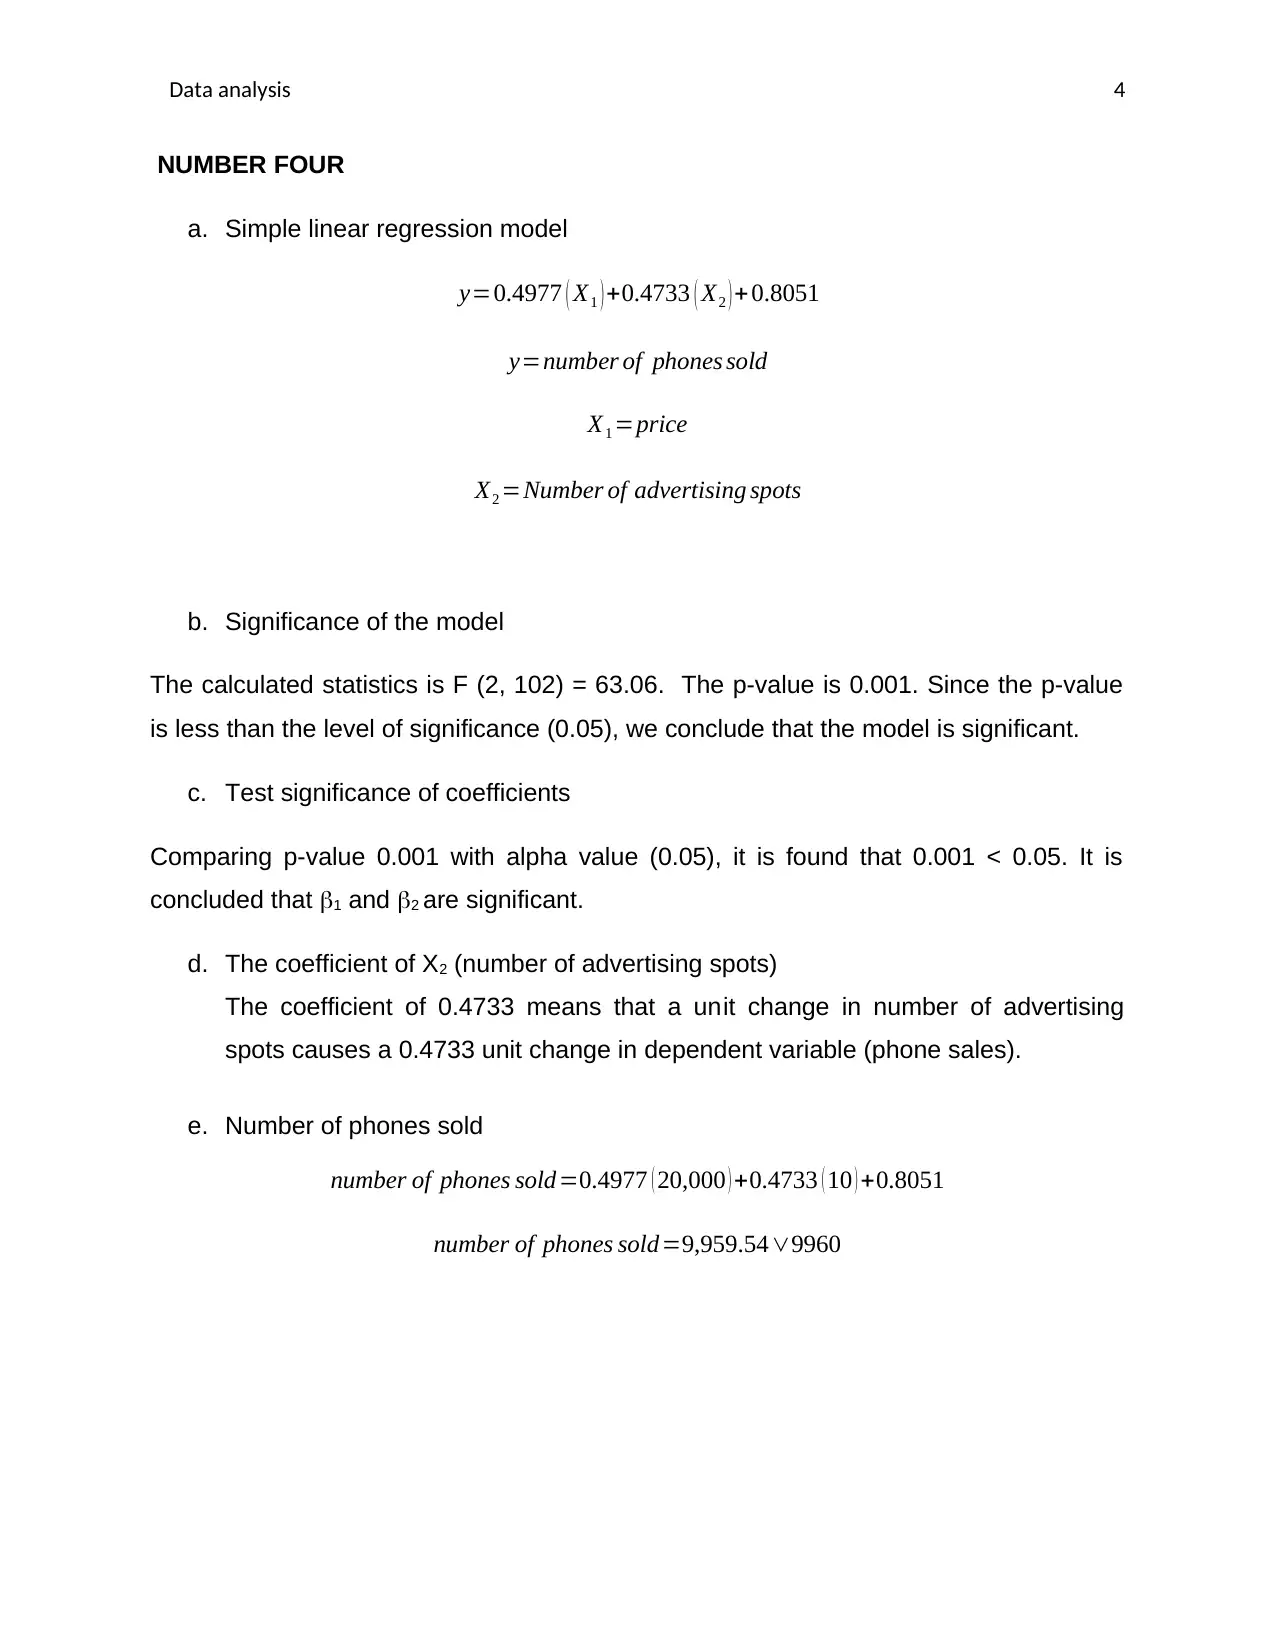
This assignment solution covers various aspects of data analysis, including creating frequency distributions and histograms, determining appropriate measures of central tendency, and conducting hypothesis testing using ANOVA and regression analysis. The analysis involves interpreting p-values and R-squared values to draw conclusions about the relationships between variables, such as demand and price. Furthermore, the assignment includes building a simple linear regression model to predict phone sales based on price and advertising spots, assessing the model's significance, and interpreting the coefficients. The calculations and interpretations are focused on providing actionable insights for business decision-making. Desklib offers a range of similar solved assignments and resources for students.

1 out of 4
Related Documents


Your All-in-One AI-Powered Toolkit for Academic Success.
+13062052269
info@desklib.com
Available 24*7 on WhatsApp / Email
![[object Object]](/_next/static/media/star-bottom.7253800d.svg)
Copyright © 2020–2026 A2Z Services. All Rights Reserved. Developed and managed by ZUCOL.