Group Assignment: Statistics and Research Methods HI6007

Verified

Added on  2022/10/10

|9
|779
|270
Homework Assignment
AI Summary
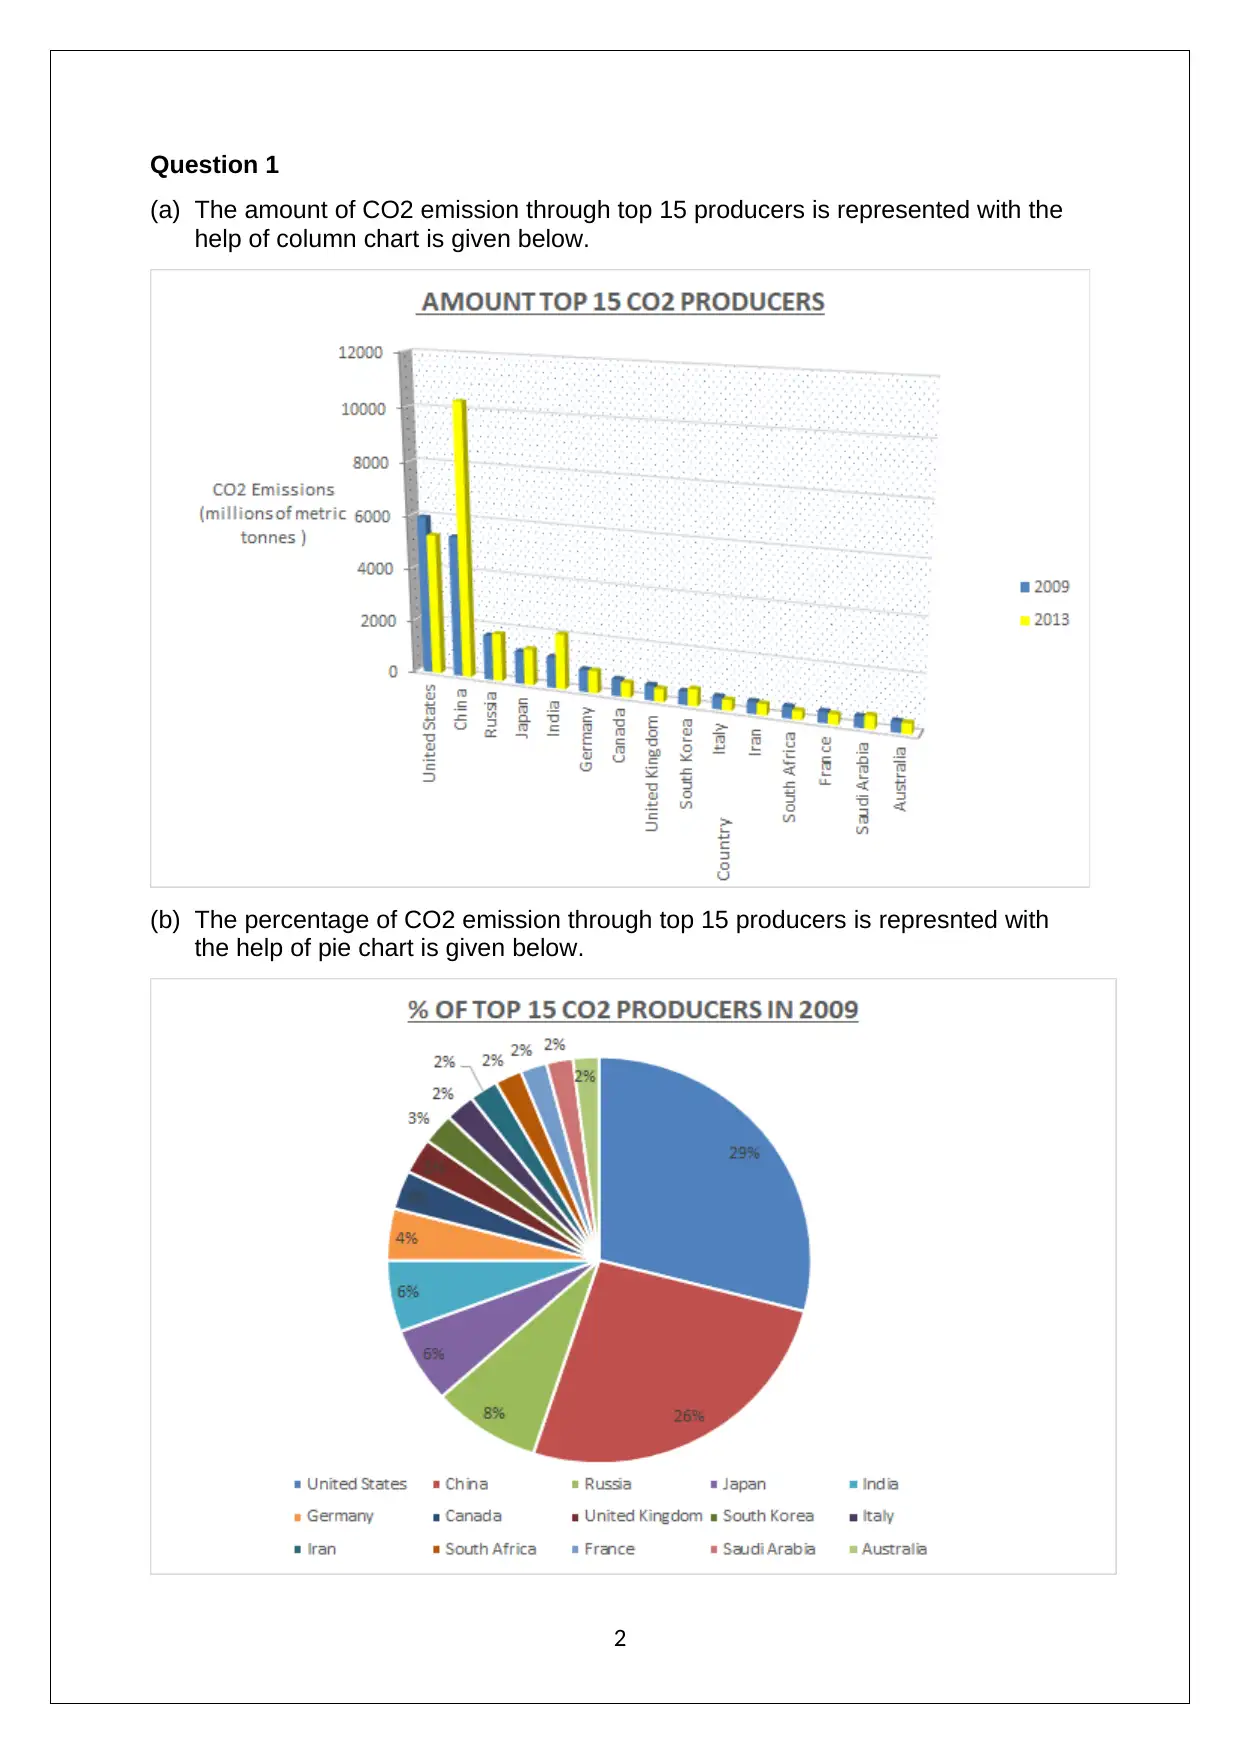
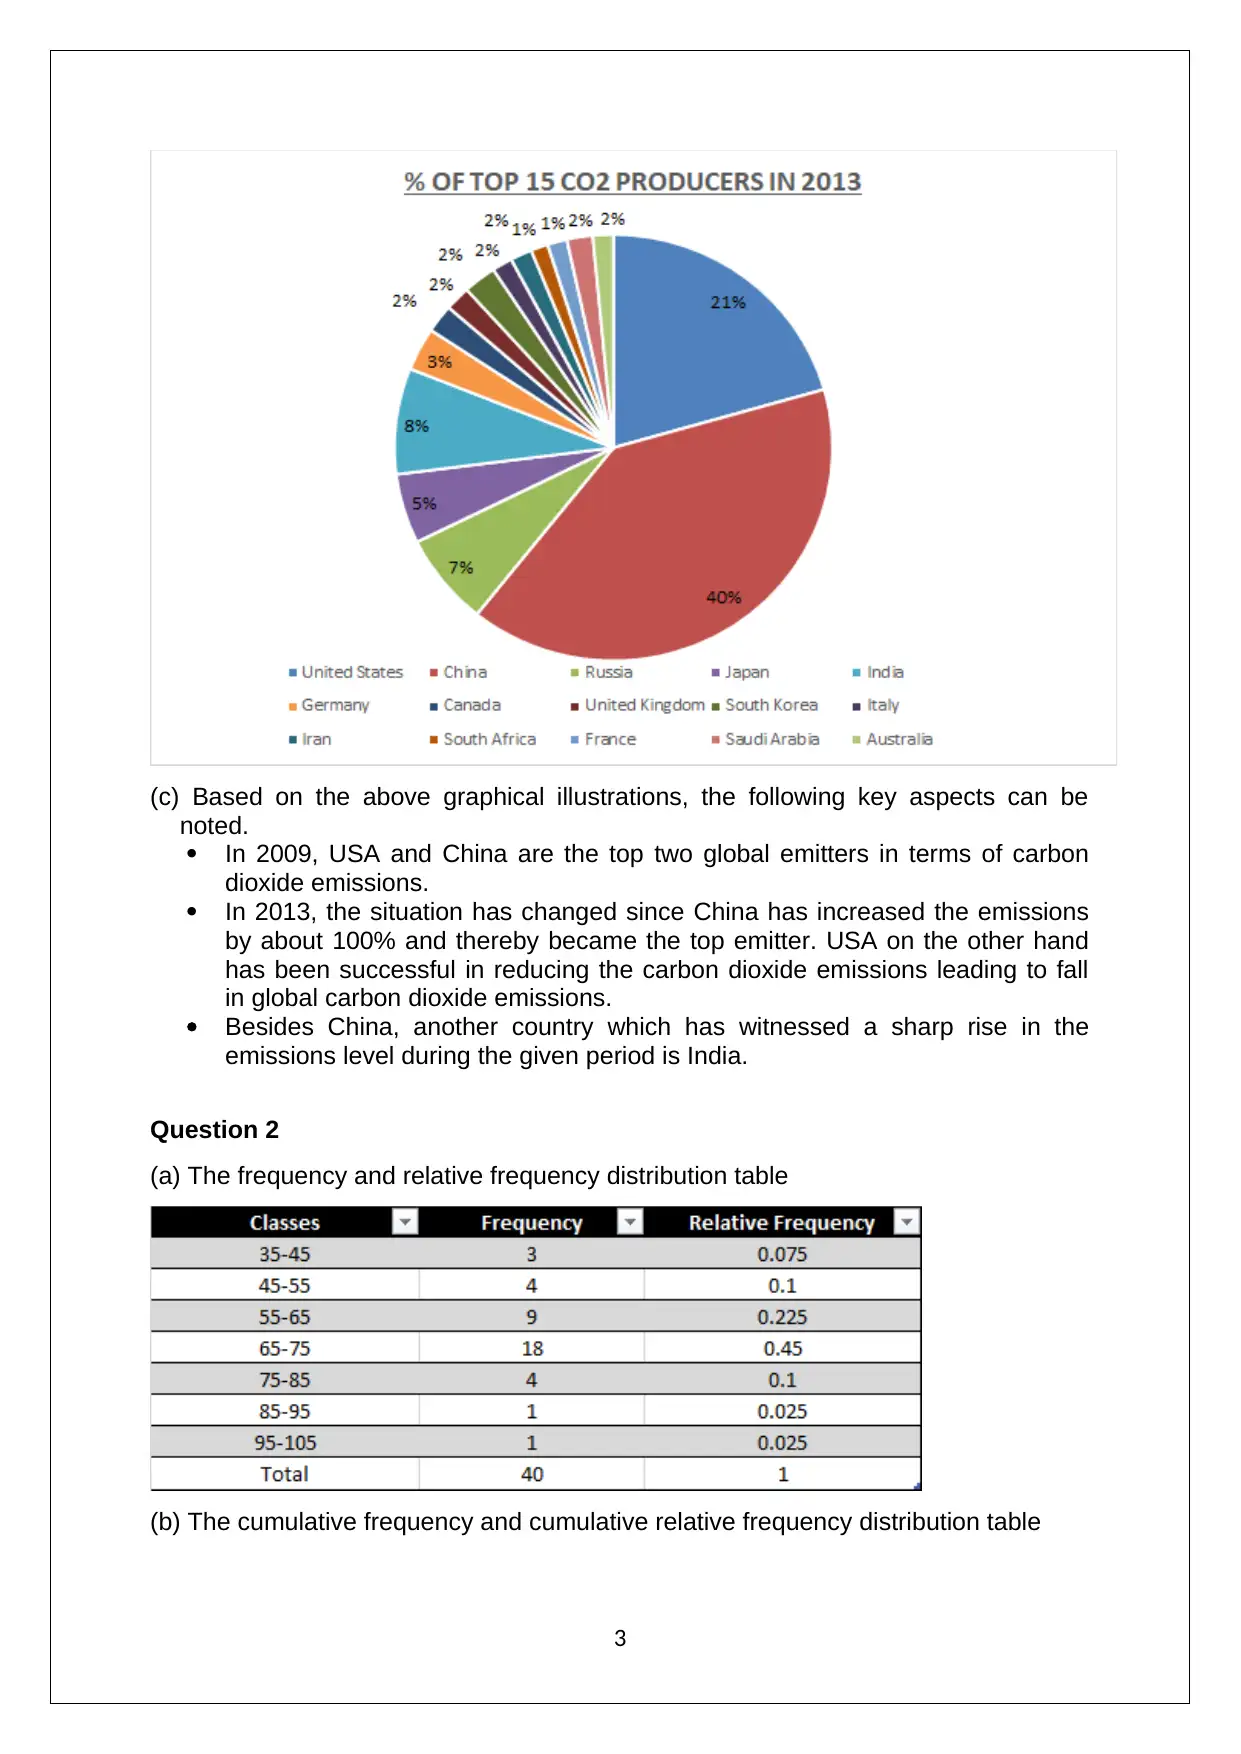
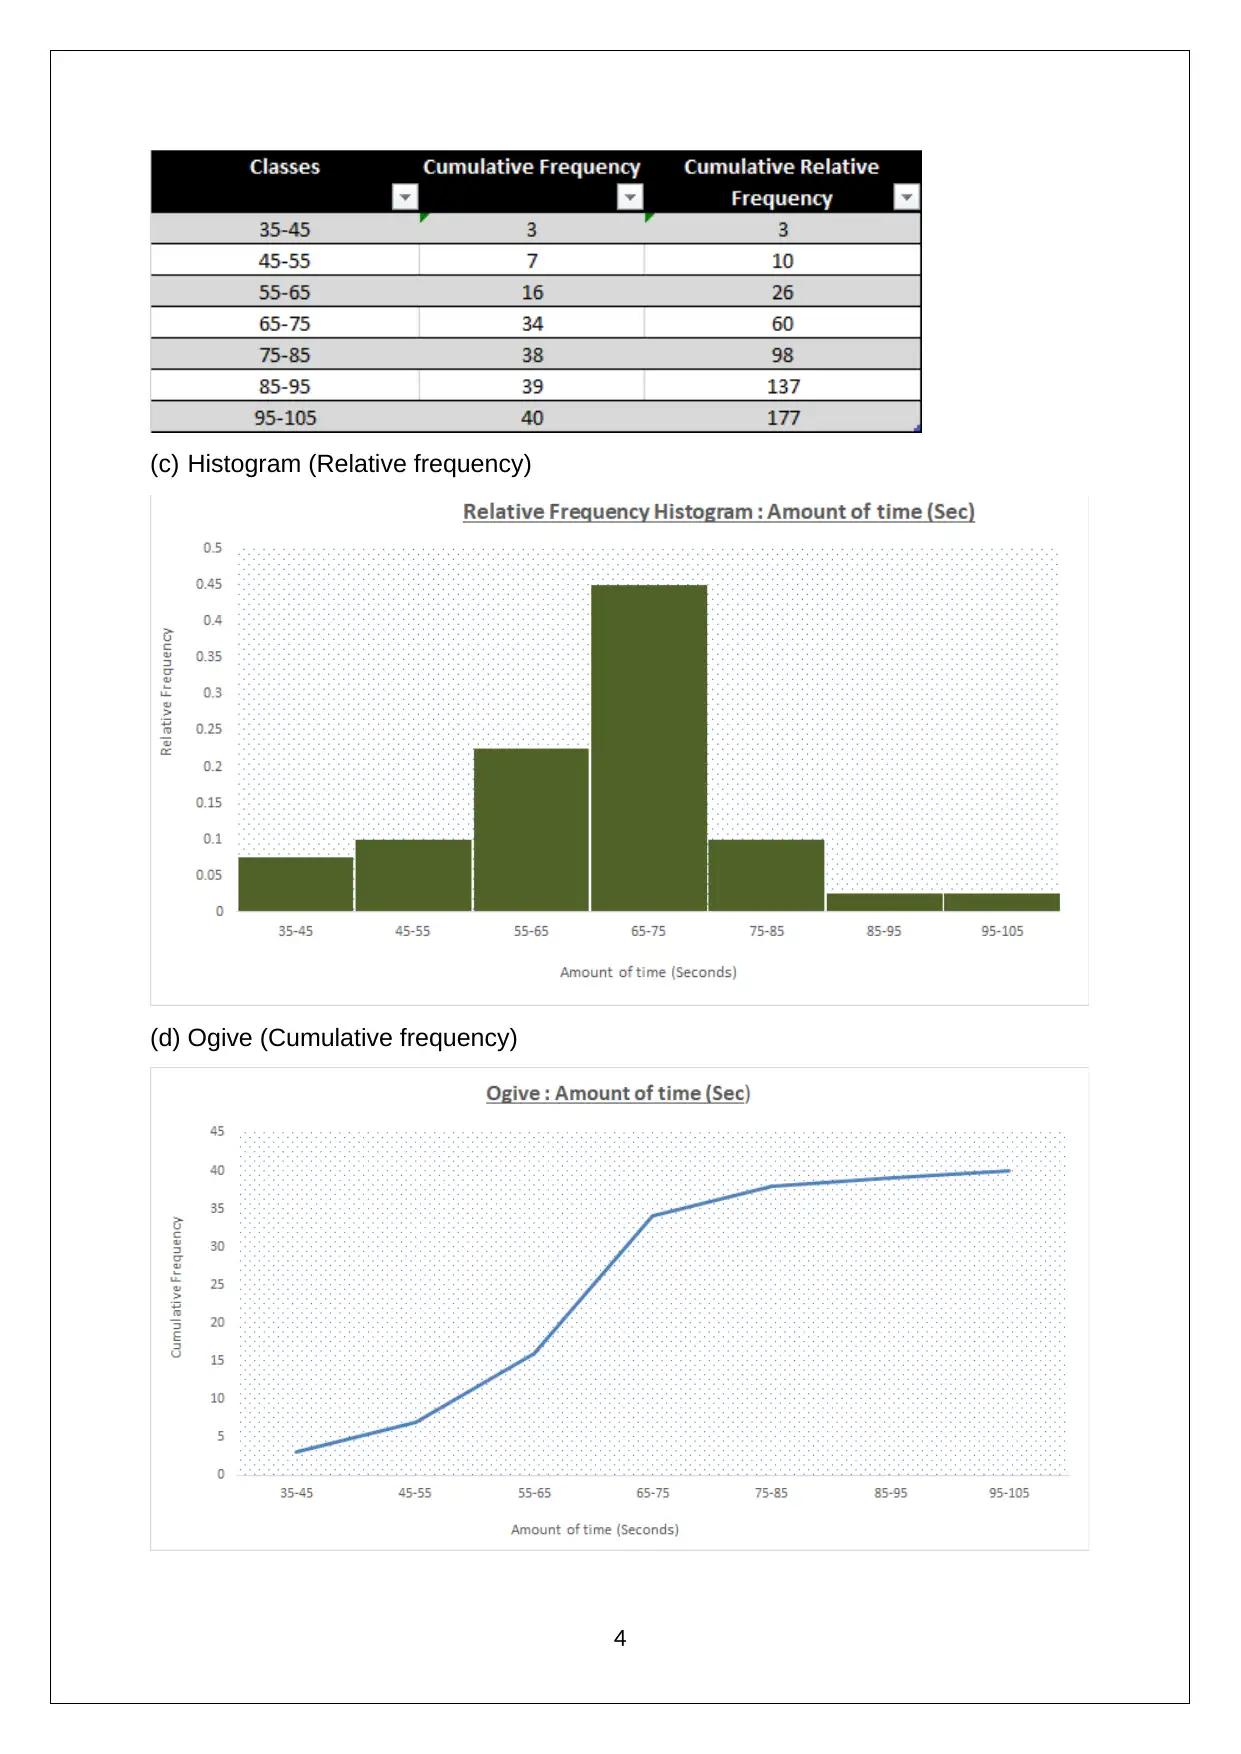
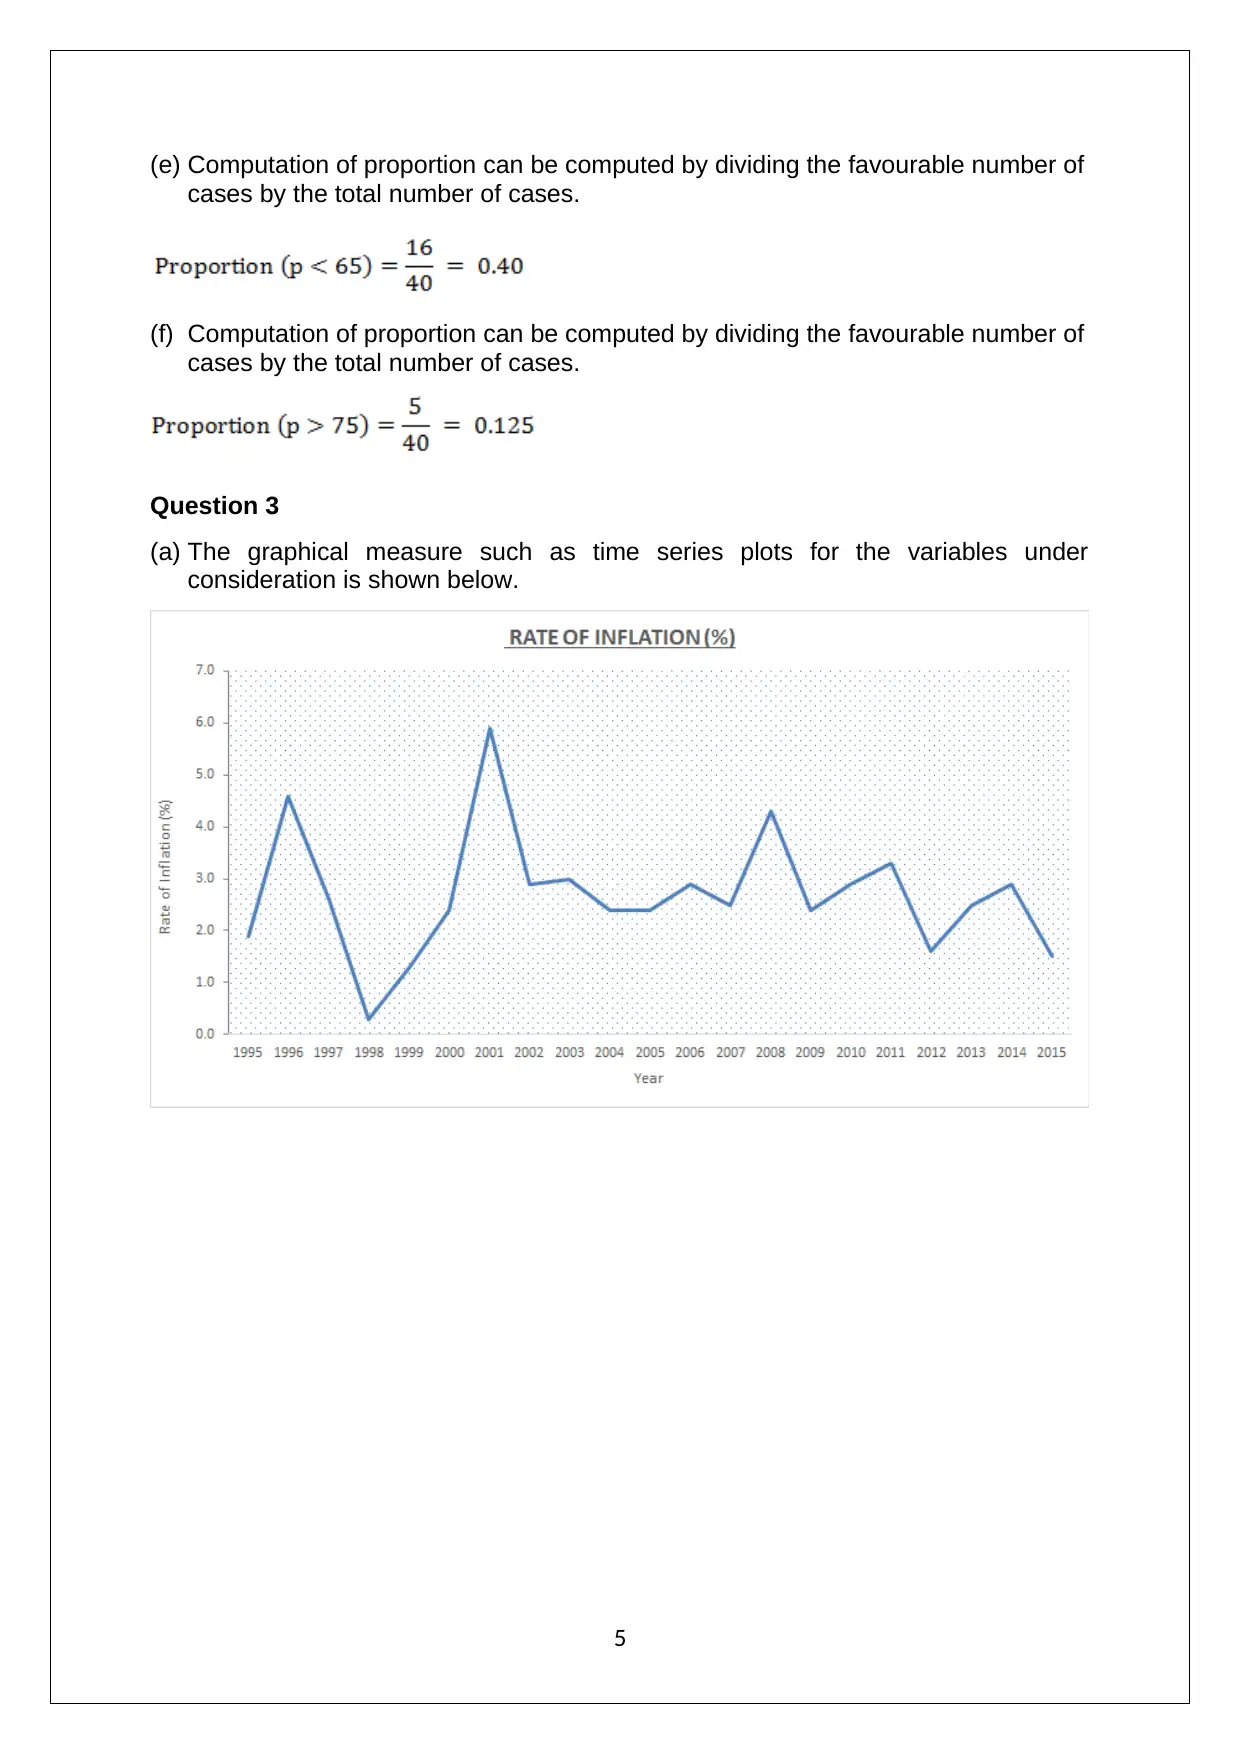
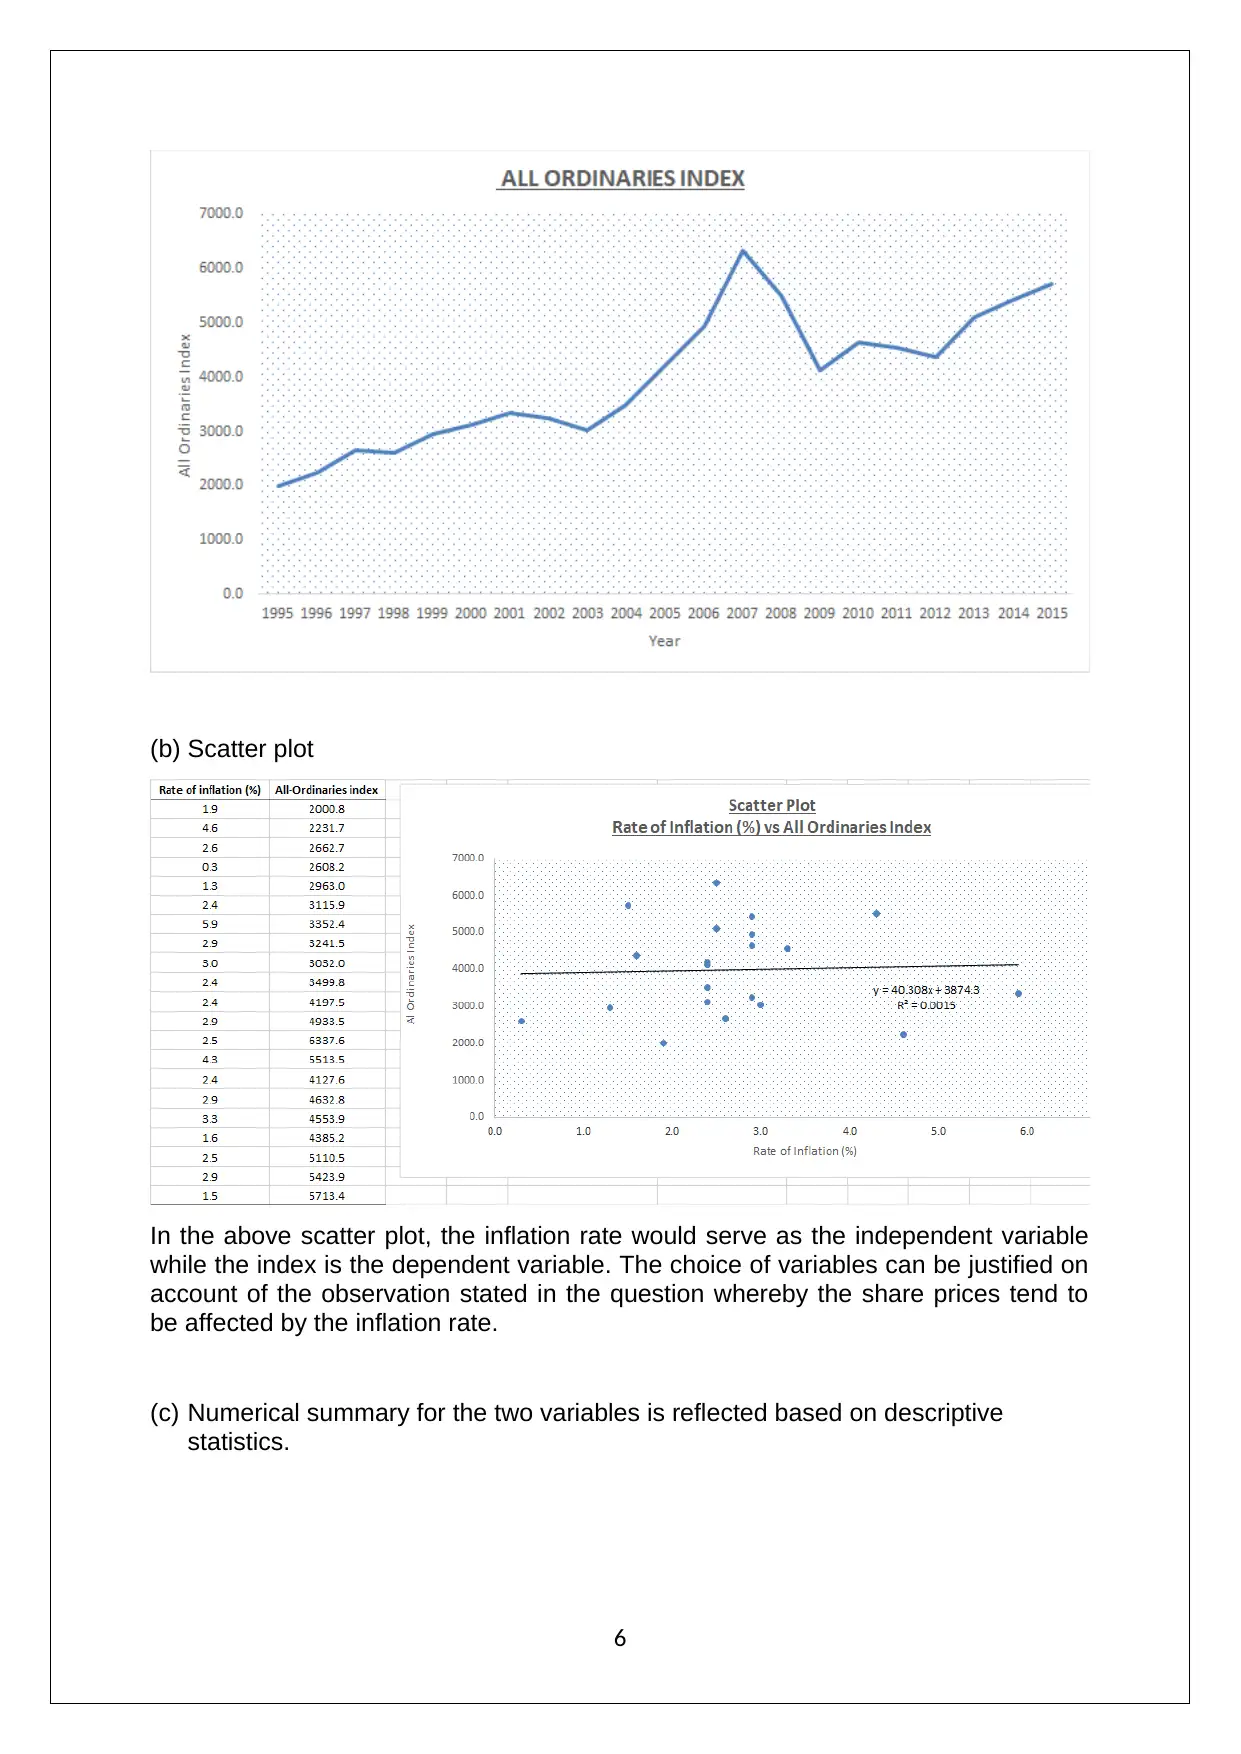
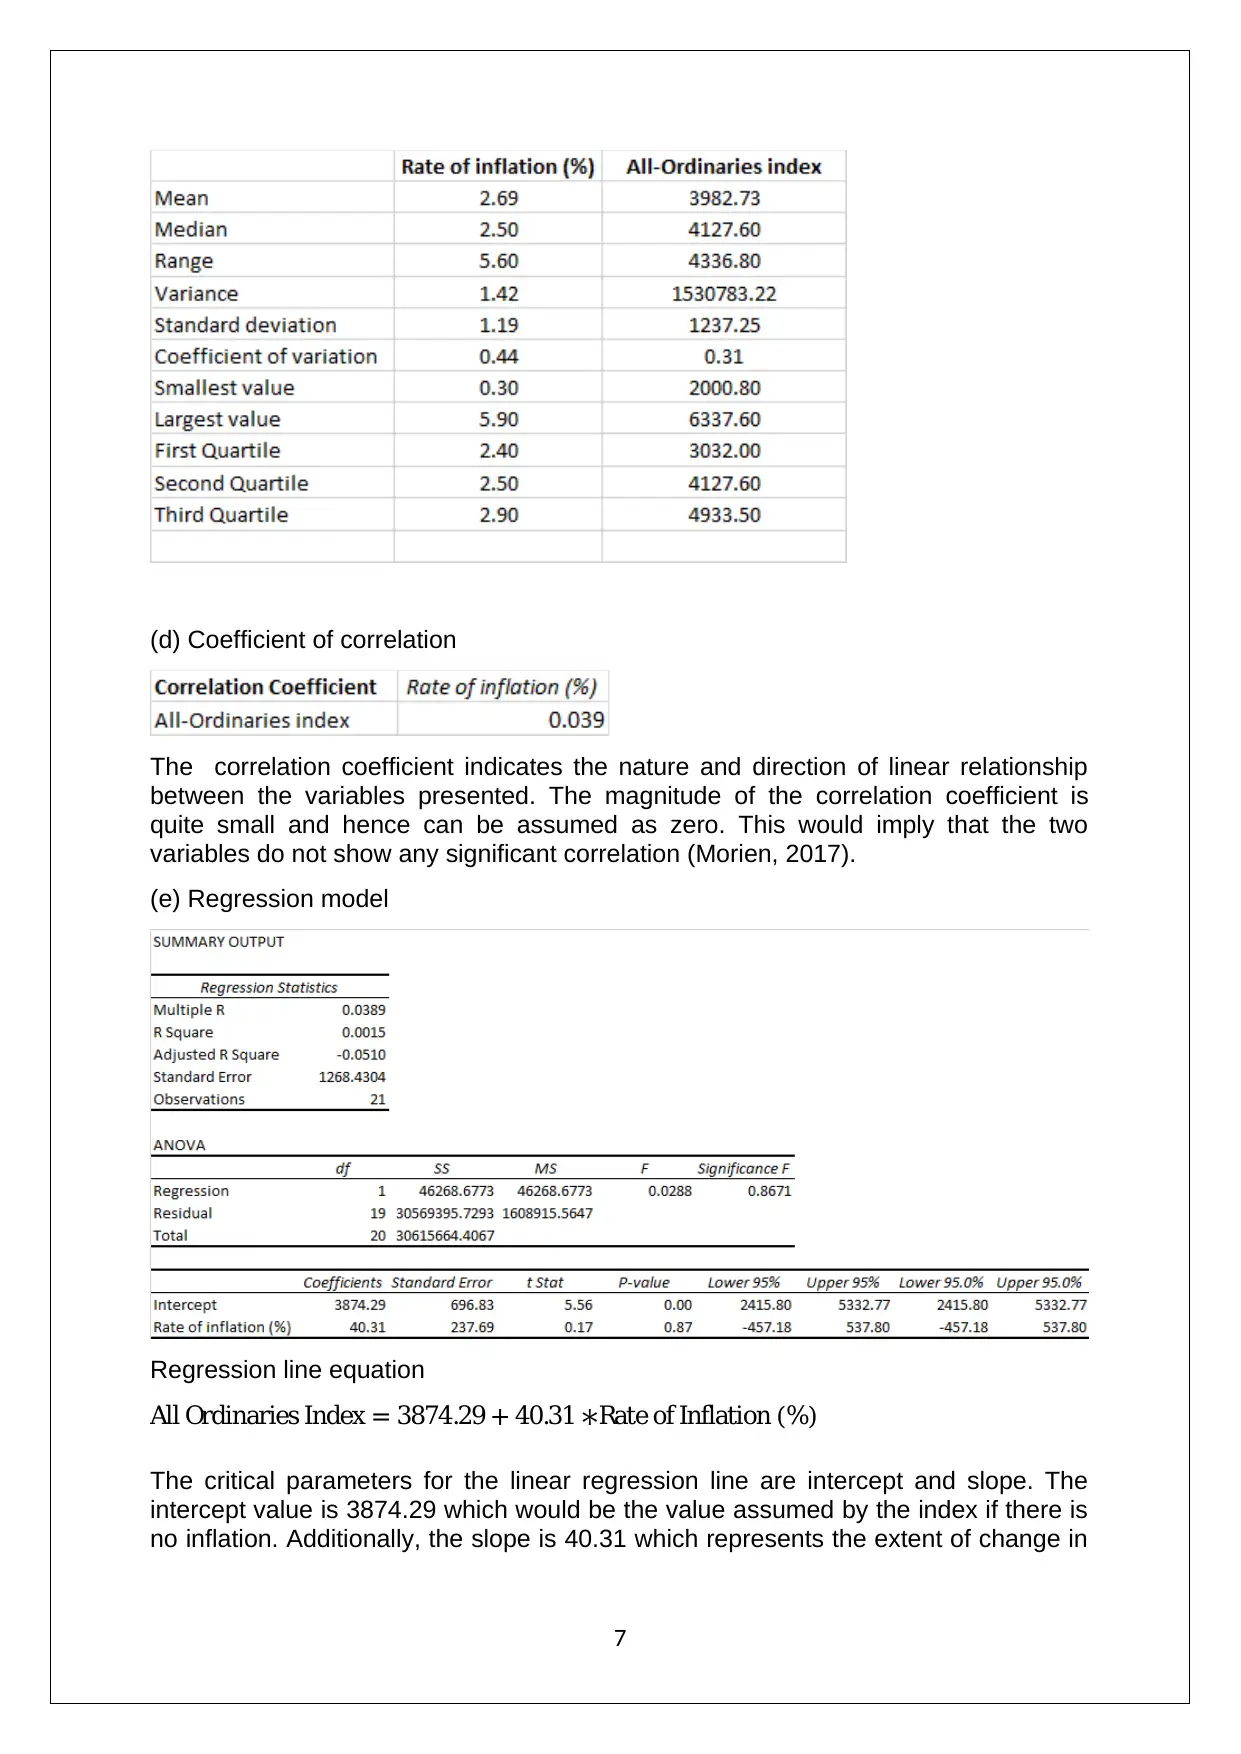
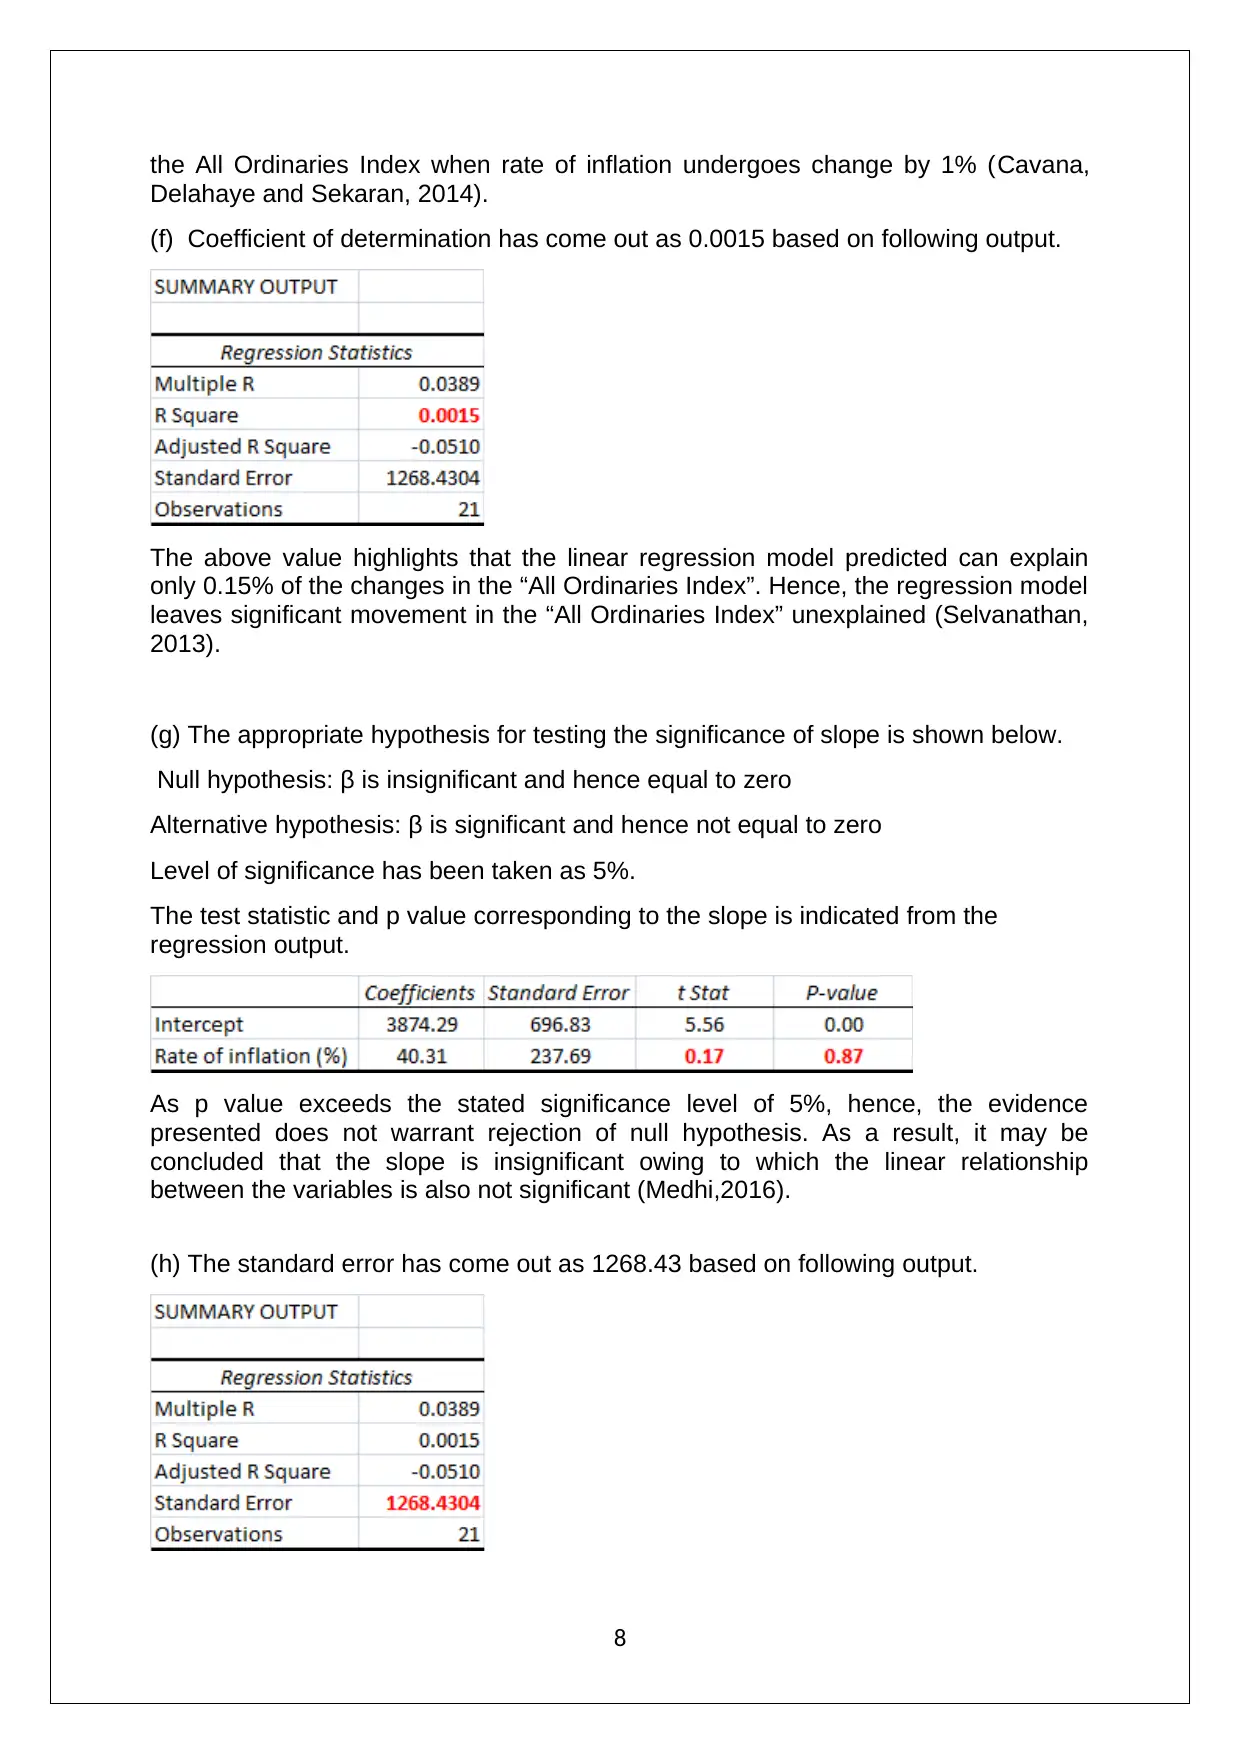
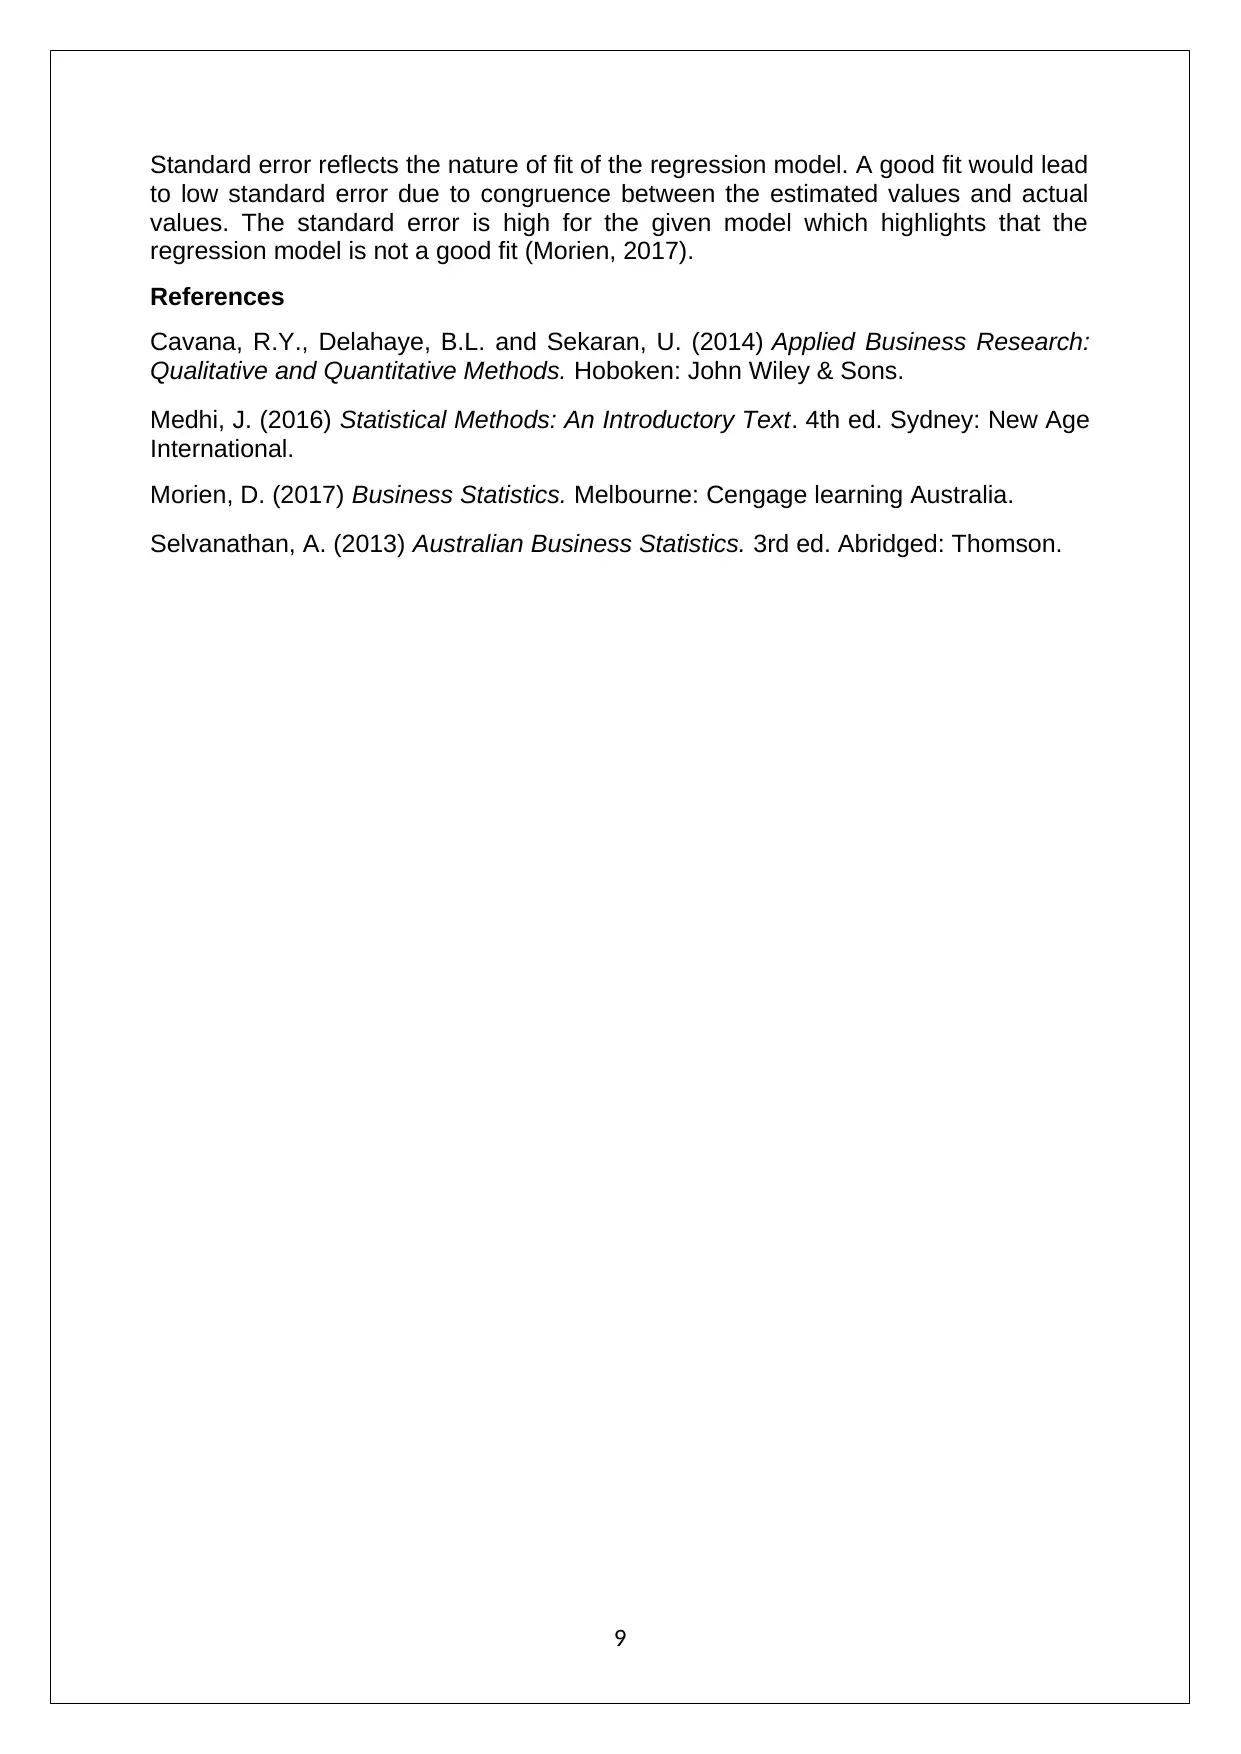
This statistics assignment analyzes CO2 emissions data through graphical illustrations, including column and pie charts, highlighting emission trends from top producers. It then delves into frequency distributions, cumulative frequencies, and histogram representations. Furthermore, the assignment explores time series plots, scatter plots, and descriptive statistics for inflation rates and an index, analyzing the correlation coefficient and developing a regression model. Key aspects include the interpretation of the intercept, slope, and coefficient of determination. Hypothesis testing is conducted to assess the significance of the slope, and the standard error is evaluated to gauge the model's fit. The assignment concludes with references in Harvard style, providing a comprehensive overview of statistical methods applied to business decision-making.
tabler-icon-diamond-filled.svg

Contribute Materials

Your contribution can guide someone’s learning journey. Share your documents today.
Document Page
STATISTICS
STUDENT ID:
[Pick the date]
tabler-icon-diamond-filled.svg

Secure Best Marks with AI Grader

Need help grading? Try our AI Grader for instant feedback on your assignments.
Document Page
Question 1
(a) The amount of CO2 emission through top 15 producers is represented with the
help of column chart is given below.
(b) The percentage of CO2 emission through top 15 producers is represnted with
the help of pie chart is given below.
2
Document Page
(c) Based on the above graphical illustrations, the following key aspects can be
noted.
In 2009, USA and China are the top two global emitters in terms of carbon
dioxide emissions.
In 2013, the situation has changed since China has increased the emissions
by about 100% and thereby became the top emitter. USA on the other hand
has been successful in reducing the carbon dioxide emissions leading to fall
in global carbon dioxide emissions.
Besides China, another country which has witnessed a sharp rise in the
emissions level during the given period is India.
Question 2
(a) The frequency and relative frequency distribution table
(b) The cumulative frequency and cumulative relative frequency distribution table
3
Document Page
(c) Histogram (Relative frequency)
(d) Ogive (Cumulative frequency)
4
tabler-icon-diamond-filled.svg

Secure Best Marks with AI Grader

Need help grading? Try our AI Grader for instant feedback on your assignments.
Document Page
(e) Computation of proportion can be computed by dividing the favourable number of
cases by the total number of cases.
(f) Computation of proportion can be computed by dividing the favourable number of
cases by the total number of cases.
Question 3
(a) The graphical measure such as time series plots for the variables under
consideration is shown below.
5
Document Page
(b) Scatter plot
In the above scatter plot, the inflation rate would serve as the independent variable
while the index is the dependent variable. The choice of variables can be justified on
account of the observation stated in the question whereby the share prices tend to
be affected by the inflation rate.
(c) Numerical summary for the two variables is reflected based on descriptive
statistics.
6
Document Page
(d) Coefficient of correlation
The correlation coefficient indicates the nature and direction of linear relationship
between the variables presented. The magnitude of the correlation coefficient is
quite small and hence can be assumed as zero. This would imply that the two
variables do not show any significant correlation (Morien, 2017).
(e) Regression model
Regression line equation
All Ordinaries Index = 3874.29 + 40.31 Rate of Inflation (%)
The critical parameters for the linear regression line are intercept and slope. The
intercept value is 3874.29 which would be the value assumed by the index if there is
no inflation. Additionally, the slope is 40.31 which represents the extent of change in
7
tabler-icon-diamond-filled.svg

Paraphrase This Document

Need a fresh take? Get an instant paraphrase of this document with our AI Paraphraser
Document Page
the All Ordinaries Index when rate of inflation undergoes change by 1% (Cavana,
Delahaye and Sekaran, 2014).
(f) Coefficient of determination has come out as 0.0015 based on following output.
The above value highlights that the linear regression model predicted can explain
only 0.15% of the changes in the “All Ordinaries Index”. Hence, the regression model
leaves significant movement in the “All Ordinaries Index” unexplained (Selvanathan,
2013).
(g) The appropriate hypothesis for testing the significance of slope is shown below.
Null hypothesis: β is insignificant and hence equal to zero
Alternative hypothesis: β is significant and hence not equal to zero
Level of significance has been taken as 5%.
The test statistic and p value corresponding to the slope is indicated from the
regression output.
As p value exceeds the stated significance level of 5%, hence, the evidence
presented does not warrant rejection of null hypothesis. As a result, it may be
concluded that the slope is insignificant owing to which the linear relationship
between the variables is also not significant (Medhi,2016).
(h) The standard error has come out as 1268.43 based on following output.
8
Document Page
Standard error reflects the nature of fit of the regression model. A good fit would lead
to low standard error due to congruence between the estimated values and actual
values. The standard error is high for the given model which highlights that the
regression model is not a good fit (Morien, 2017).
References
Cavana, R.Y., Delahaye, B.L. and Sekaran, U. (2014) Applied Business Research:
Qualitative and Quantitative Methods. Hoboken: John Wiley & Sons.
Medhi, J. (2016) Statistical Methods: An Introductory Text. 4th ed. Sydney: New Age
International.
Morien, D. (2017) Business Statistics. Melbourne: Cengage learning Australia.
Selvanathan, A. (2013) Australian Business Statistics. 3rd ed. Abridged: Thomson.
9
chevron_up_icon
1 out of 9
circle_padding
hide_on_mobile
zoom_out_icon
logo.png

Your All-in-One AI-Powered Toolkit for Academic Success.

Available 24*7 on WhatsApp / Email

[object Object]