HI6007: Statistics & Research Methods for Business Decisions T3 2019
VerifiedAdded on 2023/01/13
|14
|1494
|84
Report
AI Summary
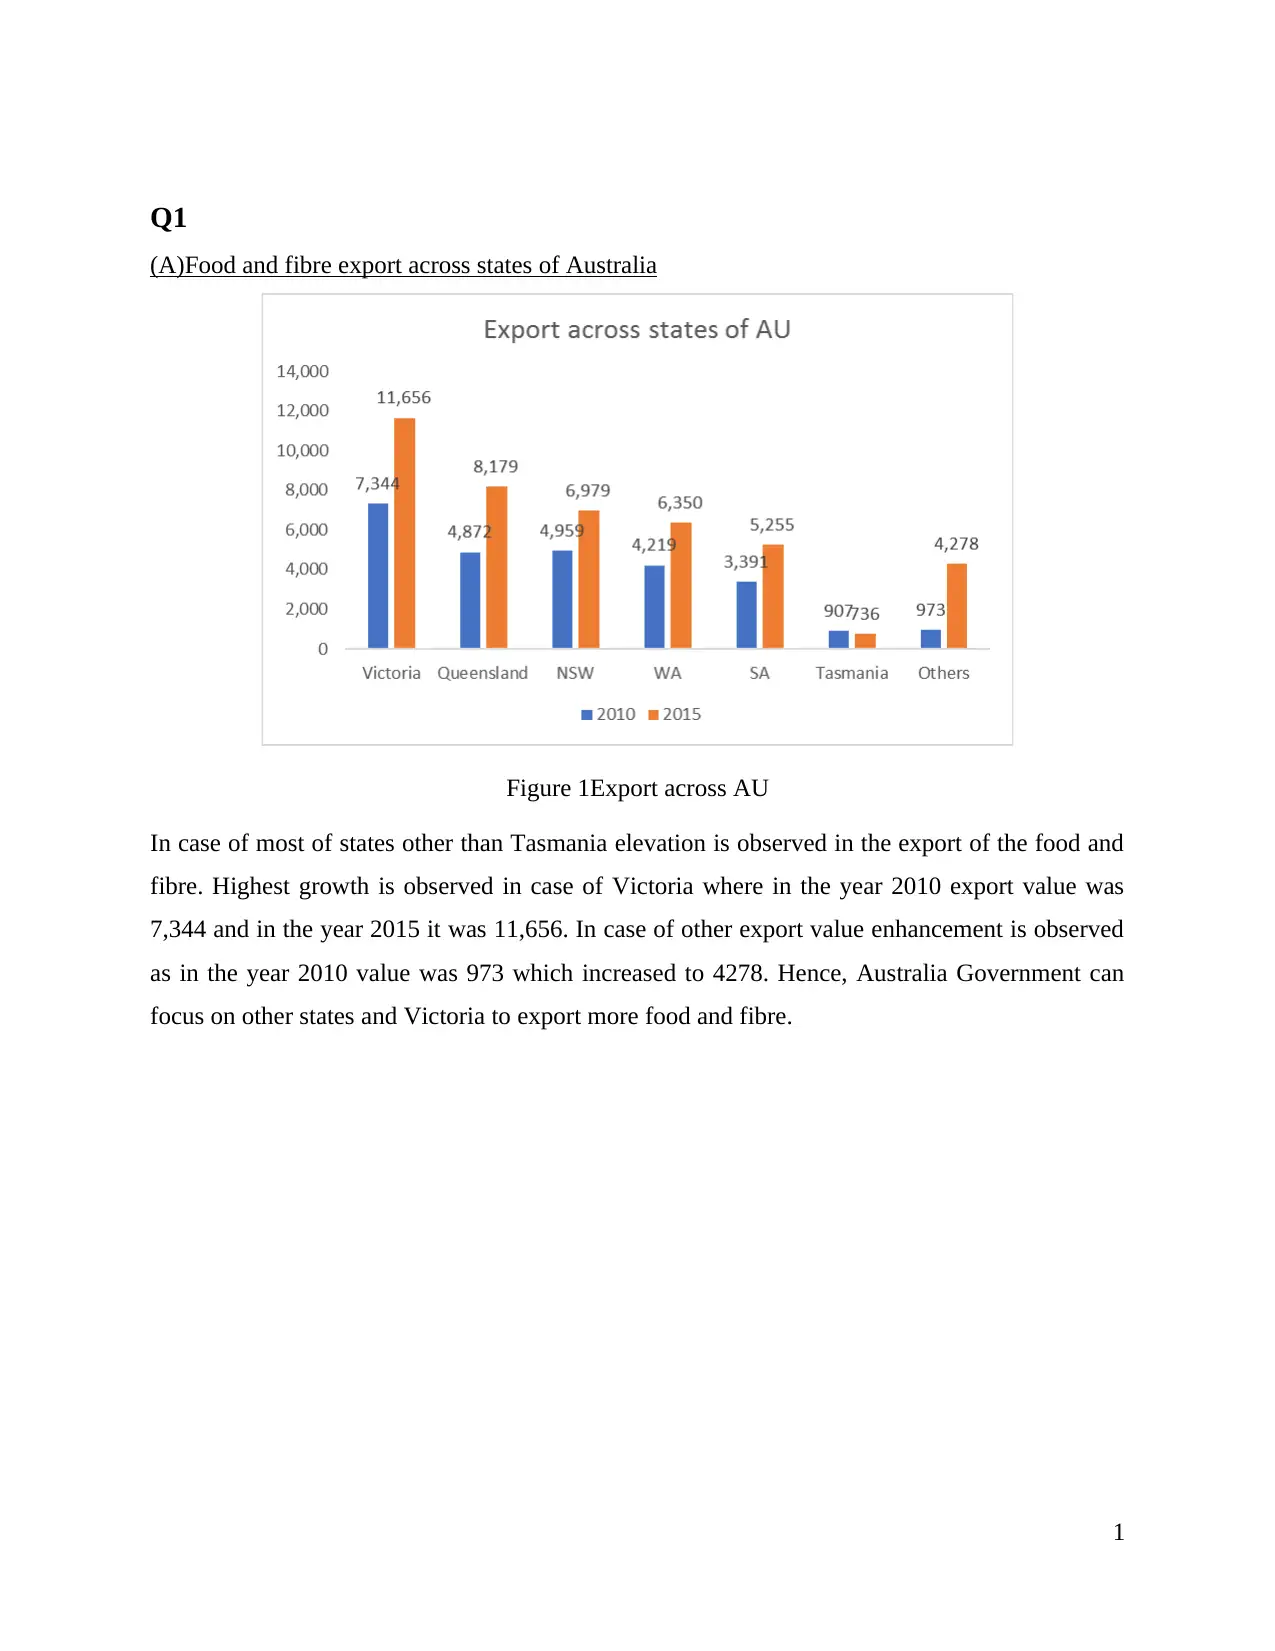
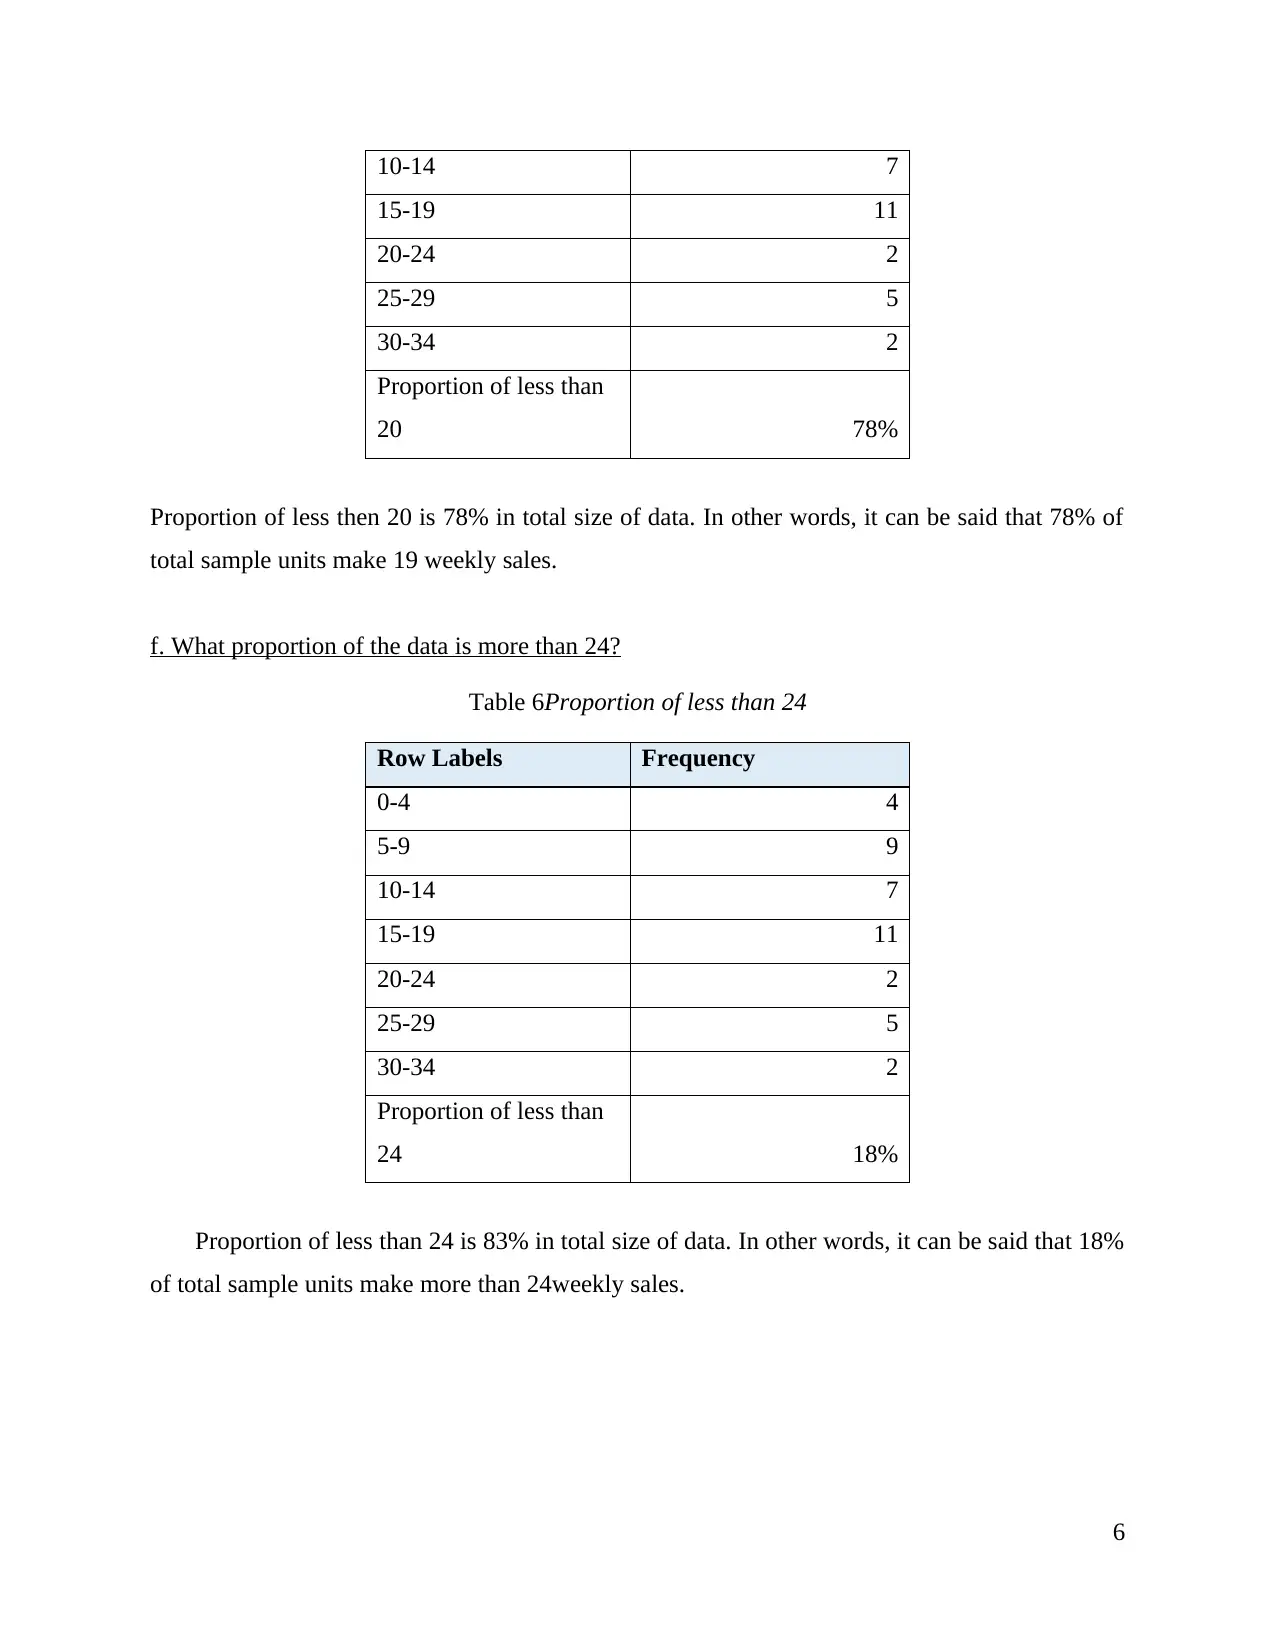
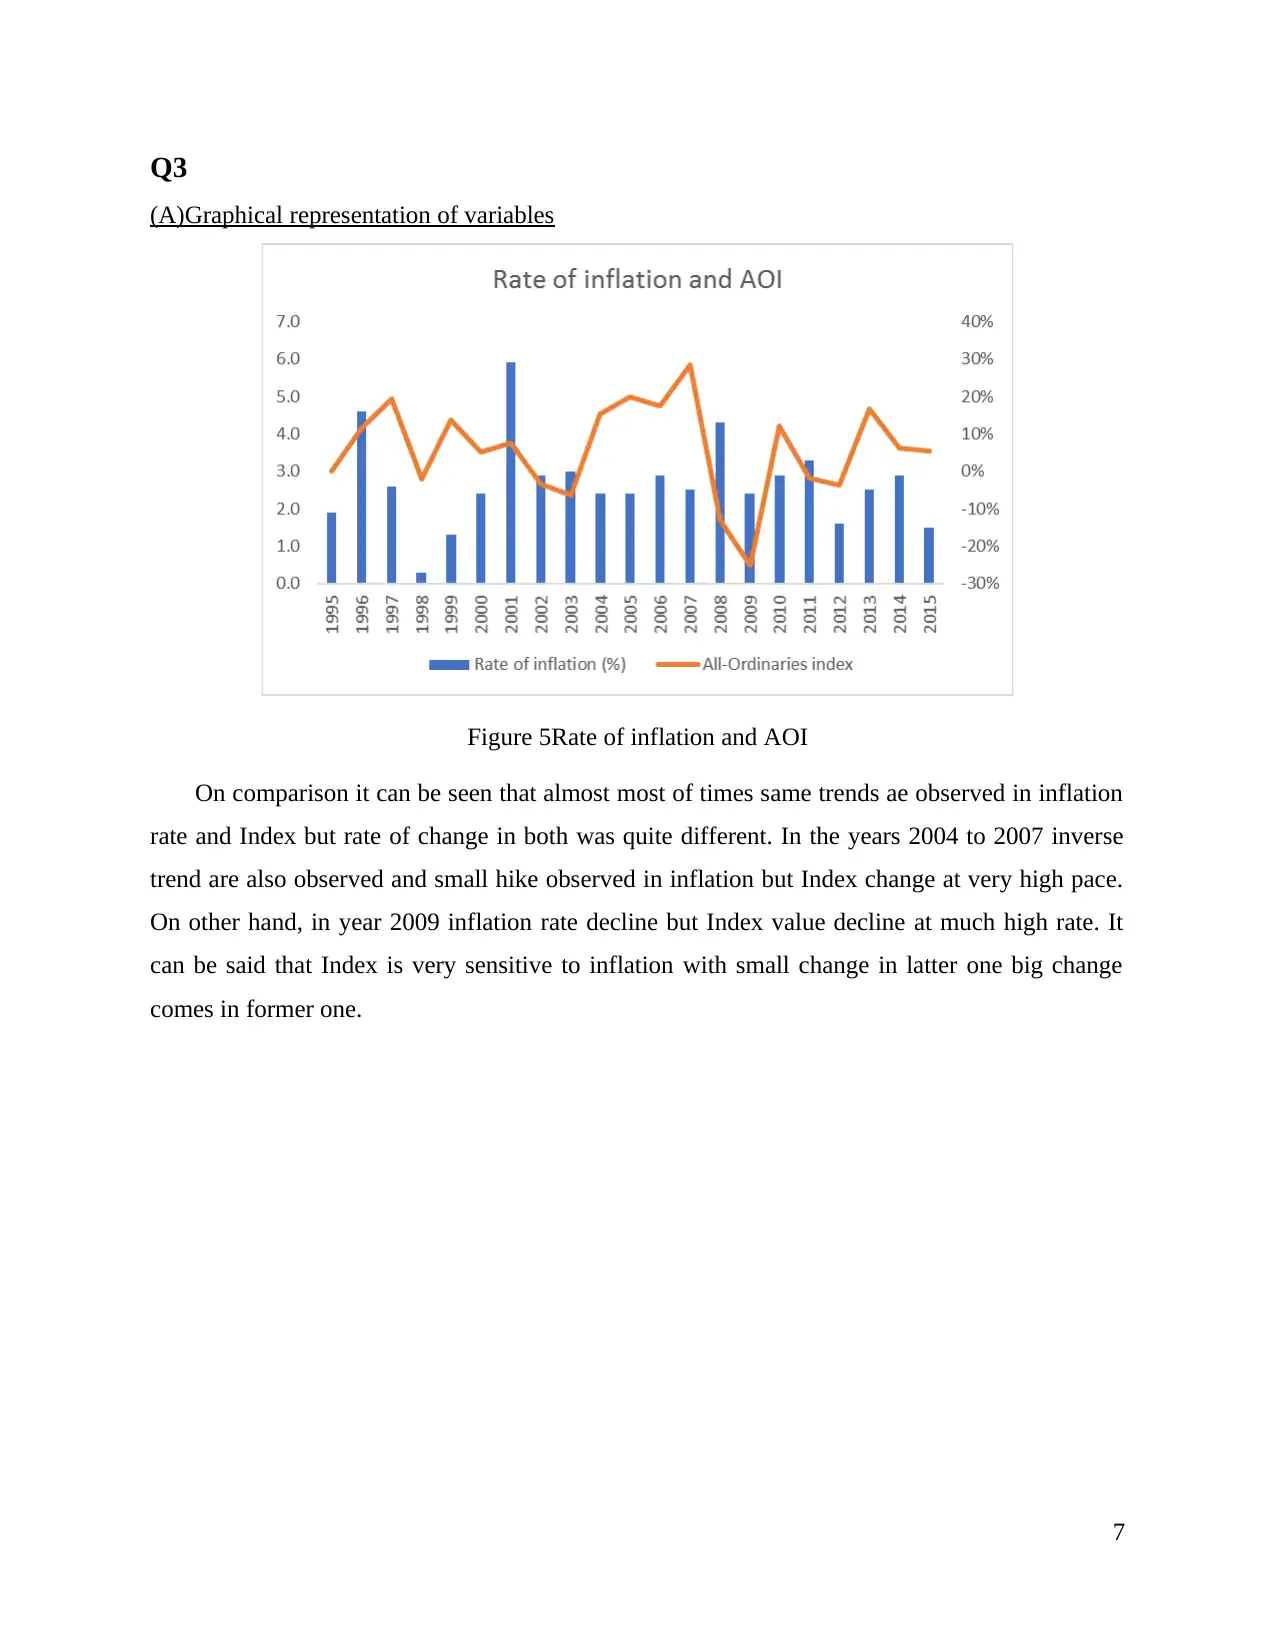
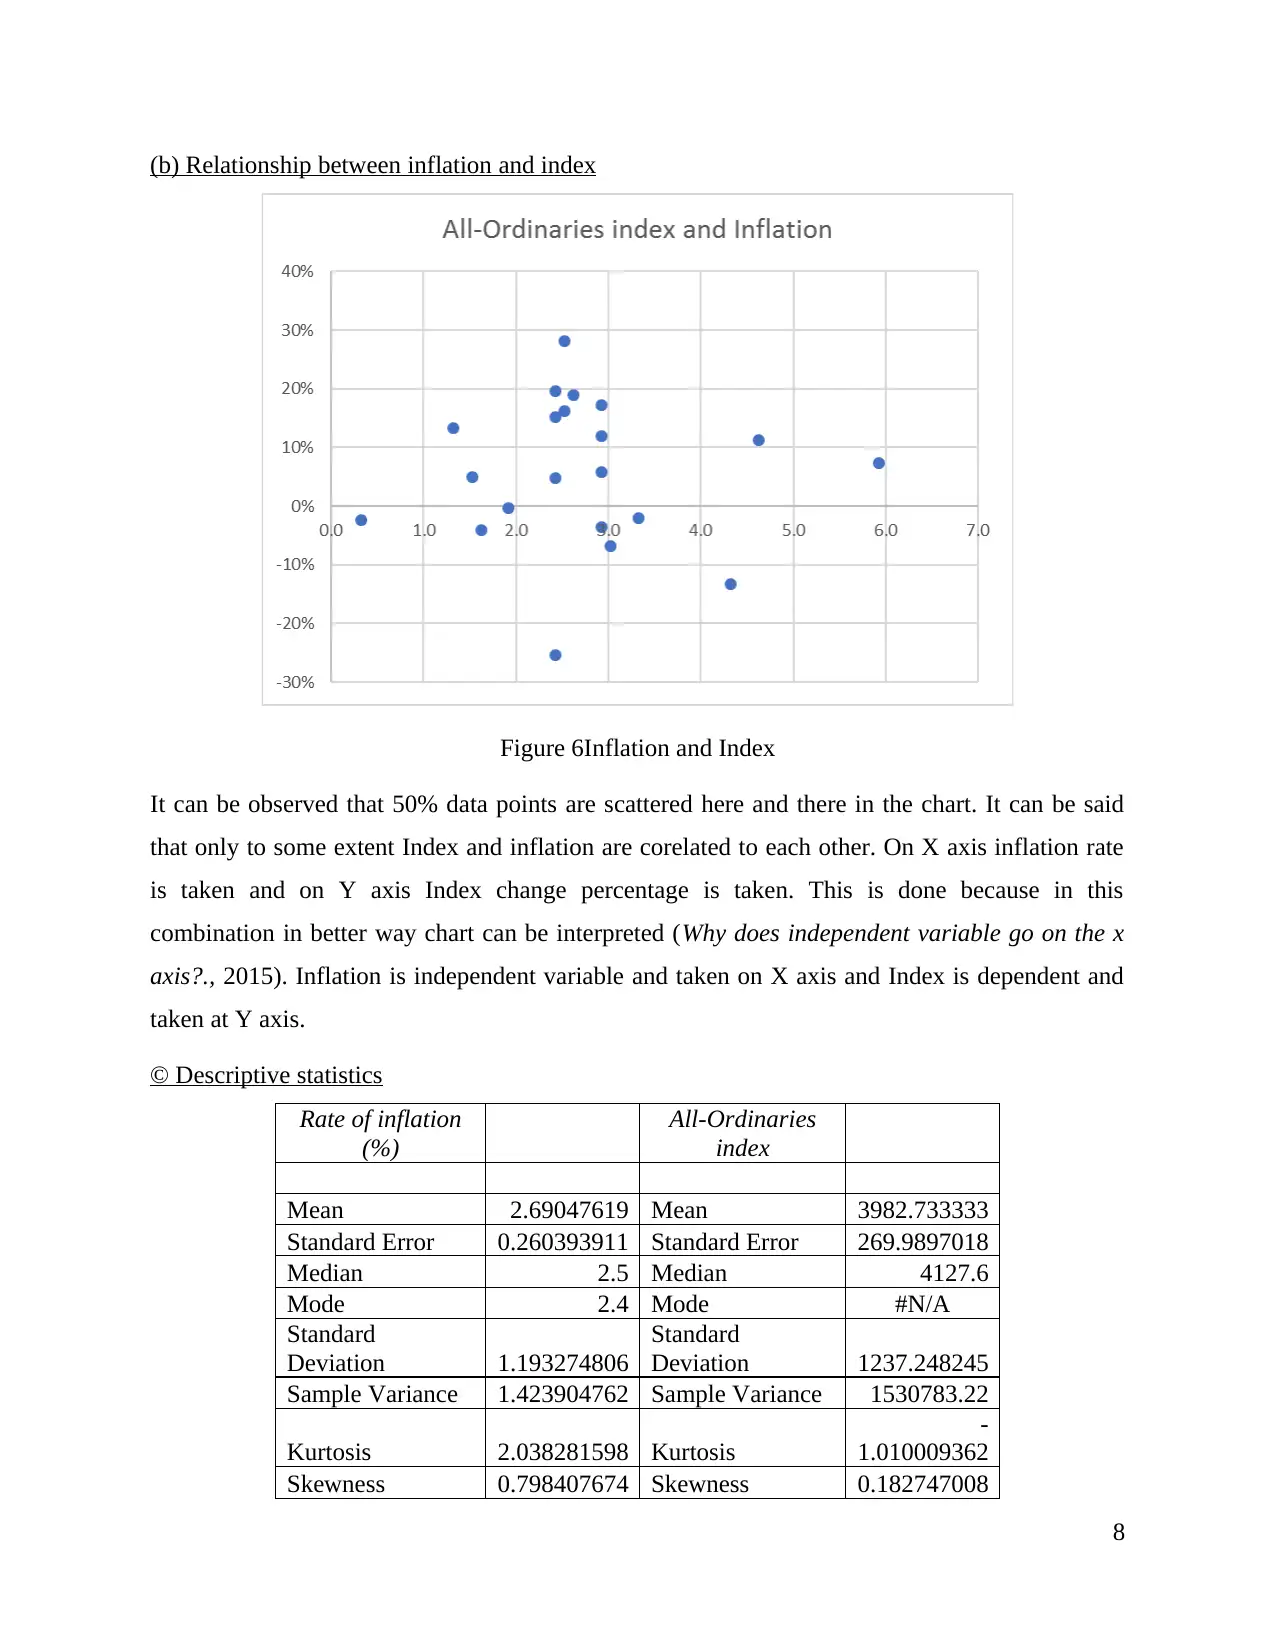
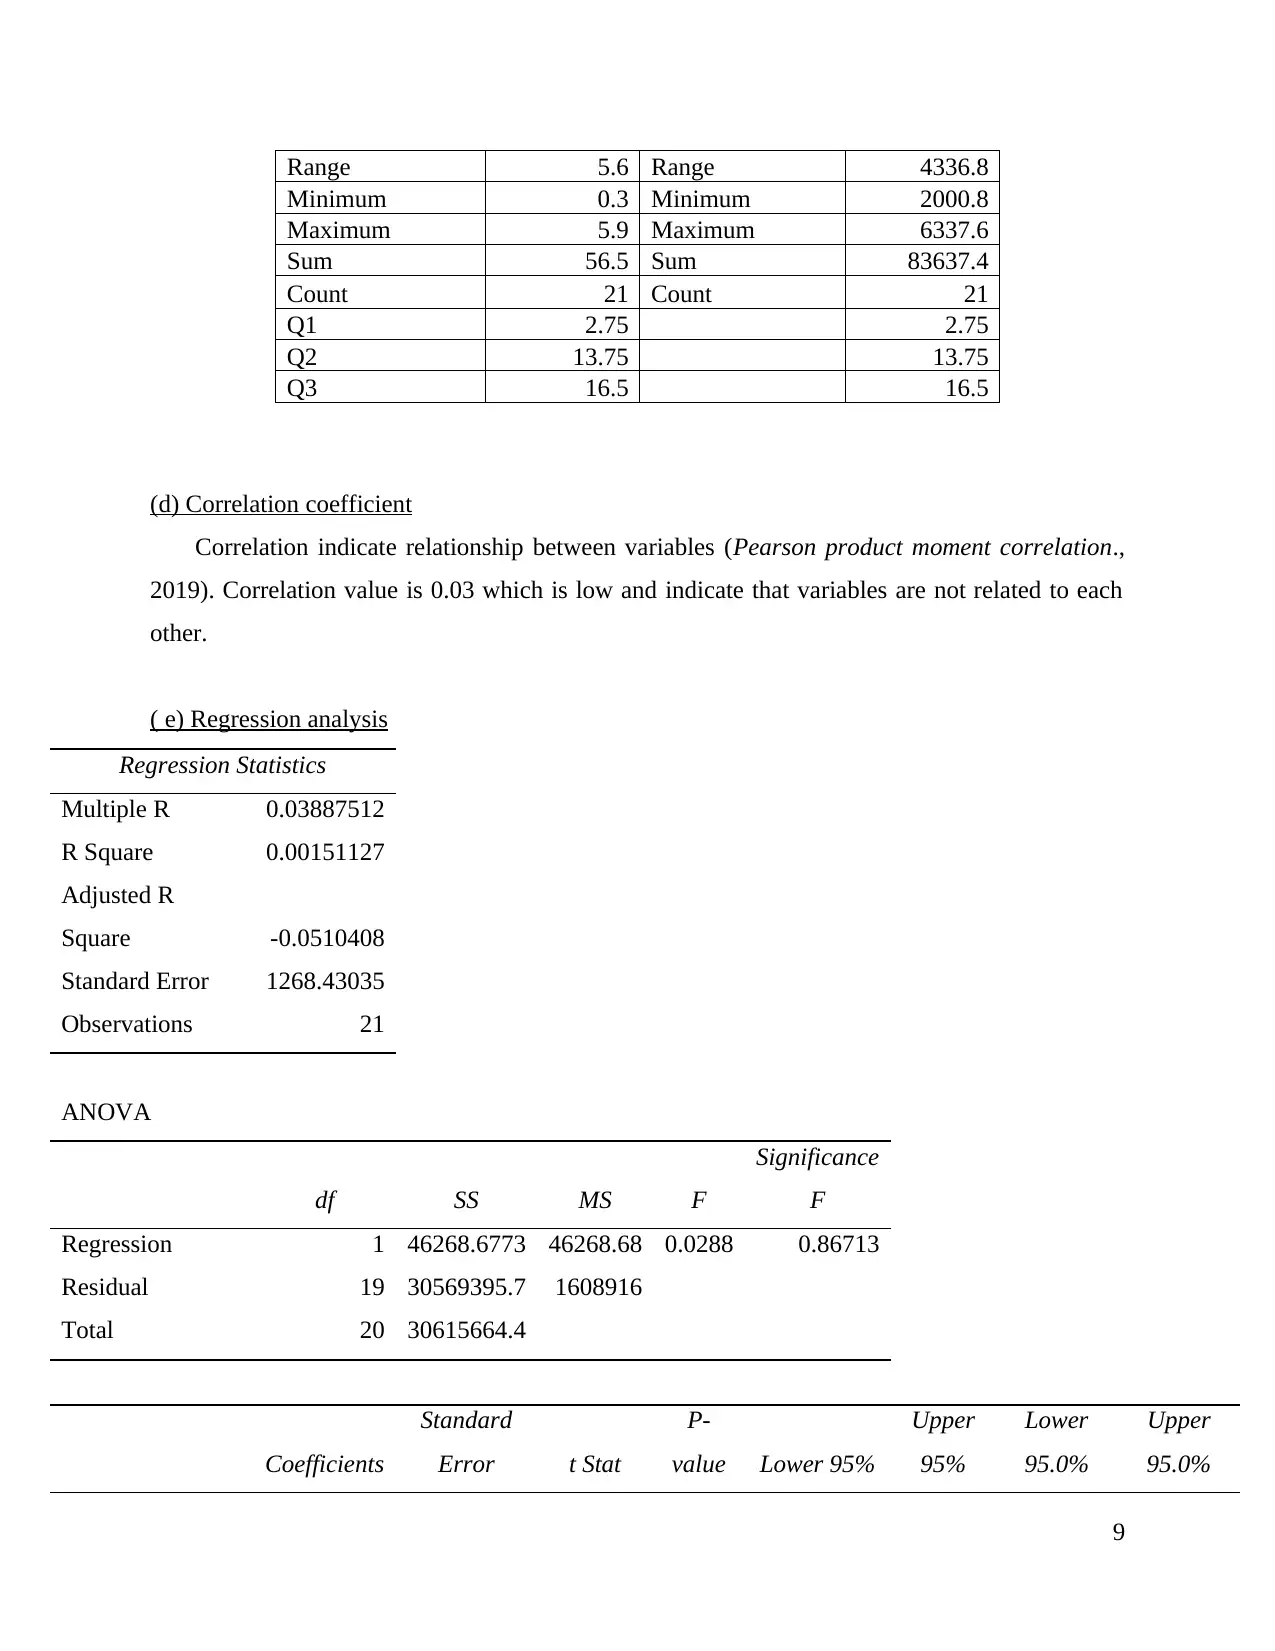
This report provides a detailed analysis of statistical and research methods applied to business decision-making. It includes an examination of food and fiber exports across Australian states, constructing frequency distributions, relative frequency distributions, cumulative frequency distributions, and ogives. The report also explores the relationship between inflation and the All-Ordinaries Index (AOI) through graphical representation, descriptive statistics, correlation coefficient analysis, and regression analysis. Key findings include the performance of Victoria and other states in food and fiber exports, the correlation between inflation and index values, and interpretations of R-squared and significance levels. The analysis utilizes various charts and tables to present data and support conclusions, offering insights into the application of statistical techniques in business contexts. Desklib provides access to similar solved assignments and past papers for students.

STATISTICS AND RESEARCH
METHODS FOR BUSINESS DECISION
MAKING
METHODS FOR BUSINESS DECISION
MAKING
Paraphrase This Document
Need a fresh take? Get an instant paraphrase of this document with our AI Paraphraser

TABLE OF CONTENTS
Q1.....................................................................................................................................................1
(A)Food and fibre export across states of Australia....................................................................1
(b) Percentage share of states......................................................................................................2
© Comment on observations.......................................................................................................2
Q2.....................................................................................................................................................2
a. Construct a frequency distribution and a relative frequency distribution for the data............2
(b) Construct a cumulative frequency distribution and a cumulative relative frequency
distribution for the data...............................................................................................................3
c. Plot a relative frequency histogram for the data......................................................................4
d. Construct an ogive for the data...............................................................................................4
e. What proportion of the data is less than 20?...........................................................................5
f. What proportion of the data is more than 24?.........................................................................6
Q3.....................................................................................................................................................7
(A)Graphical representation of variables....................................................................................7
(b) Relationship between inflation and index.............................................................................8
© Descriptive statistics...............................................................................................................8
(d) Correlation coefficient...........................................................................................................9
( e) Regression analysis...............................................................................................................9
(F) R square interpretation........................................................................................................10
(g) Level of significance of model............................................................................................10
(h) Standard error and best fit...................................................................................................10
REFERENCES..............................................................................................................................................11
Figure 1Export across AU...............................................................................................................1
Figure 2Percentage share of states in year 2010 and 2015..............................................................2
Figure 3Relative frequency distribution..........................................................................................4
Figure 4Ogive chart.........................................................................................................................5
Figure 5Rate of inflation and AOI...................................................................................................7

Figure 6Inflation and Index.............................................................................................................8
⊘ This is a preview!⊘
Do you want full access?
Subscribe today to unlock all pages.

Trusted by 1+ million students worldwide

Q1
(A)Food and fibre export across states of Australia
Figure 1Export across AU
In case of most of states other than Tasmania elevation is observed in the export of the food and
fibre. Highest growth is observed in case of Victoria where in the year 2010 export value was
7,344 and in the year 2015 it was 11,656. In case of other export value enhancement is observed
as in the year 2010 value was 973 which increased to 4278. Hence, Australia Government can
focus on other states and Victoria to export more food and fibre.
1
Paraphrase This Document
Need a fresh take? Get an instant paraphrase of this document with our AI Paraphraser

(b) Percentage share of states
Figure 2Percentage share of states in year 2010 and 2015
It can be seen from the above chart that in case of NSW percentage change is observed. In the
year 2010 percentage share was 19% and in the year 2015 percentage share was 16%. In case of
others strong percentage change is observed. In year 2010 percentage share was 4% and in the
year 2015 it become 10%. Thus, highest percentage plunge is seen in case of others in the year
2015.
© Comment on observations
Data and chart are clearly indicating that Victoria and others are performing good. Thus, in
order to increase export Australia Government, need to focus on Queensland, WA and SA
because growth rate and export both are low in these states.
Q2
a. Construct a frequency distribution and a relative frequency distribution for the data
Table 1Frequency distribution
Row
Labels
Count of Weekly sales
calls
0-4 4
5-9 9
2

10-14 7
15-19 11
20-24 2
25-29 5
30-34 2
Grand
Total 40
Row
Labels
Count of Weekly sales
calls
Relative
frequency
0-4 4 10%
5-9 9 23%
10-14 7 18%
15-19 11 28%
20-24 2 5%
25-29 5 13%
30-34 2 5%
Grand
Total 40 100%
(b) Construct a cumulative frequency distribution and a cumulative relative frequency
distribution for the data
Table 2Cumulative and relative frequency distribution
Row
Labels
Count of
Weekly sales
calls
Relative
frequency
Cumulative
frequency
Cumulative
relative
frequency
0-4 4 10% 4 10%
5-9 9 23% 13 33%
10-14 7 18% 20 50%
15-19 11 28% 31 78%
20-24 2 5% 33 83%
3
⊘ This is a preview!⊘
Do you want full access?
Subscribe today to unlock all pages.

Trusted by 1+ million students worldwide

25-29 5 13% 38 95%
30-34 2 5% 40 100%
c. Plot a relative frequency histogram for the data
Figure 3Relative frequency distribution
d. Construct an ogive for the data
Table 3Count of weekly sales calls
Row
Labels
Count of Weekly sales
calls
0-4 4
5-9 9
10-14 7
15-19 11
20-24 2
25-29 5
30-34 2
Grand
Total 40
4
30-34 2 5% 40 100%
c. Plot a relative frequency histogram for the data
Figure 3Relative frequency distribution
d. Construct an ogive for the data
Table 3Count of weekly sales calls
Row
Labels
Count of Weekly sales
calls
0-4 4
5-9 9
10-14 7
15-19 11
20-24 2
25-29 5
30-34 2
Grand
Total 40
4
Paraphrase This Document
Need a fresh take? Get an instant paraphrase of this document with our AI Paraphraser

Table 4Input for Ogive chart
Row
Labels Frequency
Lat number of frequency
change
Cumulative
frequency
0-4 4 4 4
5-9 9 9 13
10-14 7 14 20
15-19 11 19 31
20-24 2 24 33
25-29 5 29 38
30-34 2 34 40
Figure 4Ogive chart
e. What proportion of the data is less than 20?
Table 5Proportion of less than 20
Row Labels Frequency
0-4 4
5-9 9
5

10-14 7
15-19 11
20-24 2
25-29 5
30-34 2
Proportion of less than
20 78%
Proportion of less then 20 is 78% in total size of data. In other words, it can be said that 78% of
total sample units make 19 weekly sales.
f. What proportion of the data is more than 24?
Table 6Proportion of less than 24
Row Labels Frequency
0-4 4
5-9 9
10-14 7
15-19 11
20-24 2
25-29 5
30-34 2
Proportion of less than
24 18%
Proportion of less than 24 is 83% in total size of data. In other words, it can be said that 18%
of total sample units make more than 24weekly sales.
6
15-19 11
20-24 2
25-29 5
30-34 2
Proportion of less than
20 78%
Proportion of less then 20 is 78% in total size of data. In other words, it can be said that 78% of
total sample units make 19 weekly sales.
f. What proportion of the data is more than 24?
Table 6Proportion of less than 24
Row Labels Frequency
0-4 4
5-9 9
10-14 7
15-19 11
20-24 2
25-29 5
30-34 2
Proportion of less than
24 18%
Proportion of less than 24 is 83% in total size of data. In other words, it can be said that 18%
of total sample units make more than 24weekly sales.
6
⊘ This is a preview!⊘
Do you want full access?
Subscribe today to unlock all pages.

Trusted by 1+ million students worldwide

Q3
(A)Graphical representation of variables
Figure 5Rate of inflation and AOI
On comparison it can be seen that almost most of times same trends ae observed in inflation
rate and Index but rate of change in both was quite different. In the years 2004 to 2007 inverse
trend are also observed and small hike observed in inflation but Index change at very high pace.
On other hand, in year 2009 inflation rate decline but Index value decline at much high rate. It
can be said that Index is very sensitive to inflation with small change in latter one big change
comes in former one.
7
Paraphrase This Document
Need a fresh take? Get an instant paraphrase of this document with our AI Paraphraser

(b) Relationship between inflation and index
Figure 6Inflation and Index
It can be observed that 50% data points are scattered here and there in the chart. It can be said
that only to some extent Index and inflation are corelated to each other. On X axis inflation rate
is taken and on Y axis Index change percentage is taken. This is done because in this
combination in better way chart can be interpreted (Why does independent variable go on the x
axis?., 2015). Inflation is independent variable and taken on X axis and Index is dependent and
taken at Y axis.
© Descriptive statistics
Rate of inflation
(%)
All-Ordinaries
index
Mean 2.69047619 Mean 3982.733333
Standard Error 0.260393911 Standard Error 269.9897018
Median 2.5 Median 4127.6
Mode 2.4 Mode #N/A
Standard
Deviation 1.193274806
Standard
Deviation 1237.248245
Sample Variance 1.423904762 Sample Variance 1530783.22
Kurtosis 2.038281598 Kurtosis
-
1.010009362
Skewness 0.798407674 Skewness 0.182747008
8

Range 5.6 Range 4336.8
Minimum 0.3 Minimum 2000.8
Maximum 5.9 Maximum 6337.6
Sum 56.5 Sum 83637.4
Count 21 Count 21
Q1 2.75 2.75
Q2 13.75 13.75
Q3 16.5 16.5
(d) Correlation coefficient
Correlation indicate relationship between variables (Pearson product moment correlation.,
2019). Correlation value is 0.03 which is low and indicate that variables are not related to each
other.
( e) Regression analysis
Regression Statistics
Multiple R 0.03887512
R Square 0.00151127
Adjusted R
Square -0.0510408
Standard Error 1268.43035
Observations 21
ANOVA
df SS MS F
Significance
F
Regression 1 46268.6773 46268.68 0.0288 0.86713
Residual 19 30569395.7 1608916
Total 20 30615664.4
Coefficients
Standard
Error t Stat
P-
value Lower 95%
Upper
95%
Lower
95.0%
Upper
95.0%
9
⊘ This is a preview!⊘
Do you want full access?
Subscribe today to unlock all pages.

Trusted by 1+ million students worldwide
1 out of 14
Related Documents

Your All-in-One AI-Powered Toolkit for Academic Success.
+13062052269
info@desklib.com
Available 24*7 on WhatsApp / Email
Unlock your academic potential
Copyright © 2020–2025 A2Z Services. All Rights Reserved. Developed and managed by ZUCOL.